The Water Encyclopedia: Hydrologic Data and Internet Resources - Chapter 6 docx
Bạn đang xem bản rút gọn của tài liệu. Xem và tải ngay bản đầy đủ của tài liệu tại đây (2.34 MB, 92 trang )
CHAPTER 6
Groundwater
Melvin Rivera
CONTENTS
Section 6A Groundwater — United States . . . . . . 6–2
Section 6B Water Wells — United States . . . . . . 6–17
Section 6C Water Wells . . . . 6–22
Section 6D Injection Wells . . 6–39
Section 6E Pumping of Water . . . 6–49
Section 6F Subsidence . . . . . 6–59
Section 6G Aquifer Characteristics 6–64
Section 6H Soil Moisture . . . 6–76
Section 6I Springs 6–79
Section 6J Artificial Recharge . . . 6–85
Section 6K Geophysical Logging . 6–88
6-1
q 2006 by Taylor & Francis Group, LLC
SECTION 6A GROUNDWATER — UNITED STATES
THE WATER ENCYCLOPEDIA: HYDROLOGIC DATA AND INTERNET RESOURCES6-2
q 2006 by Taylor & Francis Group, LLC
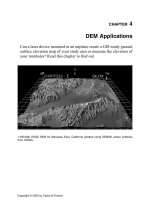
EXPLANATION
Unconsolidated sand and gravel aquifers
Sandstone aquifers
Basaltic and other volcanic-rock aquifers
Semiconsolidated sand aquifer
Coastal lowlands aquifer system
Texas coastal uplands aquifer system
Mississippi embayment aquifer system
Basin and Range aquifers
Rio Grande aquifer system
California Coastal Basin aquifers
Pacific Northwest basin-fill aquifers
Puget-Willamette Lowland aquifer system
Northern Rocky Mountains Intermountain
Basins aquifer system
Central Valley aquifer system
High Planes aquifer
Pacos River Basin alluvial aquifer
Mississippi River Valley alluvial aquifer
Seymour aquifer11
Surfical aquifer system
Unconsolidated-deposit aquifer (Alaska)
South Coast aquifer (Puerto Rico)
Colorado Plateaus aquifer
Denver Basin aquifer system
Lower Cretaceous aquifers
Rush Springs aquifer
Central Oklahoma aquifer
Ada-Varnoosa aquifer
Southern Nevada volcanic-rock aquifers
Northern California volcanic-rock aquifers
Pliocene and younger basaltic-rock aquifers
Miocene basaltic-rock aquifers
Volcanic and sedimentary-rock aquifers
Snake River Plain aquifer system
Carbonate-rock aquifers
Sandstone and carbonate-rock aquifers
Glacial deposit aquifers overlie
bedrock aquifers in many areas
Not a principal aquifer
Basin and Range carbonate-rock aquifers
Roswell Basin aquifer system
Ozark Plateaus aquifer system
Bialine aquifer
Arbuckle Simpsion aquifer
Silarian-Devonian aquifers
Ordovician aquifers
Upper carbonate aquifers
Eoxiden aquifer system
Biscayne aquifer
New York and New England carbonate rock
aquifers
Early Mesozoic basin aquifers
New York sandstone aquifers
Pennsylvantan aquifers
Mississippian aquifer of Michigan
Cambrian-Ordovician aquifer system
Jacobsville aquifer
Lower Tertiary aquifers
15
16
1
2
3
4
5
7
8
9
10
12
13
14
6
30
20
21
22
23
24
26
27
28
29
31
38
35
36
37
39
25
43
44
45
46
47
49
50
51
52
58
59
60
61
48
17
Southeastern Coastal plain aquifer system
18
Northern Atlantic Coastal plain aquifer
system
19
32
Upper Cretaceous aquifers
33
Upper Tertiary aquifers (Wyoming)
34
40
Columbia Plateaus aquifer system
41
Volcanic-rock aquifer-Overlain by
sedimentary deposits where patterned (Hawaii)
42
53
Piedmont and Blue Ridge carbonate rock
aquifers
54
Castle Hayne aquifer
55
North Coast Limestone aquifer system (Puerto Rico)
56
Kin
g
shill a
q
uifer
(
St. Croix
)
57
Kilometres
Scale
Miles
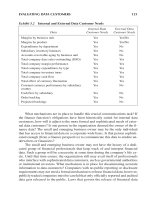
Figure 6A.1 Principal aquifers of the United States. (From .)
GROUNDWATER 6-3
q 2006 by Taylor & Francis Group, LLC
q 2006 by Taylor & Francis Group, LLC
Figure 6A.2 River valley aquifers in the United States. (From Water Information Center, 1973, Water Atlas of the United States. H.E.
Thomas, The Conservation of Ground Water, McGraw-Hill, 1951. With permission.)
THE WATER ENCYCLOPEDIA: HYDROLOGIC DATA AND INTERNET RESOURCES6-4
q 2006 by Taylor & Francis Group, LLC
Table 6A.1 Occurrence of Aquifers in the United States
(1) (2) (3) (4) (5) (6) (7) (8) (9) (10) (11) (12)
Geologic
Age and Rock
Type
Western
Mountain
Ranges
Arid
Basin
Columbi
Lava
Plateau
Colorado
Plateau
High
Plains
Unglaciated
Central
Region
Glaciated
Central
Region
Unglaciated
Appalachian
Region
Glaciated
Appalachian
Region
Atlantic
and Gulf
Coastal
Plain
Special
Comments
Cenozoic
Quaternary
Aluvium and
related
deposits
(primarily.
Recent and
Pleistocene
sediments
and may
include
some of
Pliocene age)
S and G
deposits in
valleys and
along
stream
courses.
Highly
productive
but not
greatly
developed
— P to M
S and G
deposits in
valleys and
along
stream
courses.
Highly
developed
with local
depletion.
Storage
large but
perennial
recharge
limited-P
S and G
deposits
along
streams,
interbedded
with
basalt — I
to M
U S and G
along
water
courses.
Sand
dune
deposits
—P
(in part)
S and G
along
water
courses
and in
terrace
deposits — I
(limited)
S and G
along
water
courses
—M
S and G along water
courses and in terrace
deposits. Not developed
S and G along
water courses
and in terrace
and littoral
deposits,
especially
in the
Mississippi
and
tributary
valleys.
Not highly
developed
in East
and South.
Some
depletion
in Gulf
Coast — I
The most
widespread and
important
aquifers in the
United States.
Well over
one-half of all
groundwater
pumped in the
United States is
withdrawn from
these aquifers.
Many are easily
available for
artificial recharge
and induced
infiltration.
Subject to
saltwater
contamination in
coastal areas
Glacial drift,
especially
outwash
(Pleisto-
cene)
S and G
deposits in
northern
part of
region — I
S and G
deposits
especially
in northern
part of
region and
in some
valleys — I
S and G
outwash,
especially
in Spokane
area — I
U S and G
outwash,
much of it
reworked
(see
above) — I
S and G
outwash
especially
along
northern
boundary
of region
—I
S and G
outwash,
terrace
deposits
and lenses
in till
throughout
region — P
(in part)
S and G
outwash in
northern
part. Not
highly
developed
—M
S and G
outwash,
terrace
deposits
and
lenses
in till.
Locally
highly
deve-
loped
—I
S and G
outwash in
Mississippi
Valley
(see above)
—I
Other
Pleisto-
cene
sediments
Alluvial Fm and other
basin deposits in the
southern part — M to P
(see Alluvium above)
U U Alluviated plains and
valley fills — M to I
U U U Coquina,
limestone,
sand, and
marl Fms in
Florida — M
(Continued)
GROUNDWATER 6-5
q 2006 by Taylor & Francis Group, LLC
Table 6A.1 (Continued)
(1) (2) (3) (4) (5) (6) (7) (8) (9) (10) (11) (12)
Geologic
Age and Rock
Type
Western
Mountain
Ranges
Arid
Basin
Columbi
Lava
Plateau
Colorado
Plateau
High
Plains
Unglaciated
Central
Region
Glaciated
Central
Region
Unglaciated
Appalachian
Region
Glaciated
Appalachian
Region
Atlantic
and Gulf
Coastal
Plain
Special
Comments
Tertiary
Sedi-
ments,
Pliocene
S and G
in valley
fill and
terrace
deposits.
Not highly
developed
—M
Some S
and G
in valley
fill — M
U U Ogalalla
Fm in High
Plains.
Extensive
S and G
with huge
storage
but little
recharge
locally.
Much
depletion
—P
(in part)
U U Absent Absent Dewitt Ss in
Texas.
Citronelle
and LaFayette
Fms in Gulf
States — I
Miocene Ellensburg
Fm in
Washi-
ngton — I;
elsewhere
—U
U Ellensburg
Fm in
Washington
—I;
elsewhere
—U
U Arikaree
Fm — M
Arikaree
Fm — M
Flaxville
and other
terrace
deposits,
S and G in
north
western
part — M
Absent Absent New Jersey,
Maryland,
Delaware,
Virginia —
Cohansey
and Calvert
Fms — I
Delaware
Aquifers in
coastal areas
subject to
saltwater
encroachment
and
contamination
to North
Carolina —
St. Marys
and
Calvert
Fms — I
Georgia and
Florida —
Tampa Ls,
Alluvium Bluff
Gp, and
Tamiami
Fm — I
Eastern Texas —
Oakville and
Catahoula
Ss — I
Oligocene U U U U Brule, clay,
locally — I;
else
where —
U
U U Absent Absent Suwannee Fm,
Byram Ls,
and Vicksburg
Gp — I
THE WATER ENCYCLOPEDIA: HYDROLOGIC DATA AND INTERNET RESOURCES6-6
q 2006 by Taylor & Francis Group, LLC
Eocene Knight and
Almy Fm
in south-
west
Wyoming
—M
U U Kngiht and
Almy Fm in
southwest
Wyoming,
Chuska
Ss, and
Tohatchi
Sh in
northwest
Arizona
and north-
east New
Mexico
—M
U Claibourne
and Wilcox
Gp in
southern
Illinois (?),
Kentucky,
and Missouri
— M; else-
where — U
Absent Absent Absent New Jersey,
Maryland,
Delaware,
Virginia —
Pamunkey Gp —
I. North Carolina
to Florida — Ocal
a Ls and Castle
Hayne Marl — P
(in part)
Florida — Avon Park
Ls, South
Carolina to
Mexican border,
Claibourne Gp,
Wilcox Gp — I
Includes the principal
formations (Ocala
Ls, especially) of
the great Floridan
aquifer. Subject to
saltwater
contamination in
coastal areas but
source of largest
groundwater supply
in southeastern
United States
Paleocene U U U U Feet Union
Gp — M
Feet Union
Gp — M
Feet Union
Gp — M
Absent Absent Clayton
Fm in
Georgia
—I
Volcanic
rocks,
primarily
basalt
U Local
flows — M
Many
interbeded
basalt
flows
from
Eocene
to Plio-
cene — P
Local
flows —
M
Absent Absent Absent Absent Absent Absent
Mesozoic
upper
creta-
ceous
U Ss lenses
in southern
California
—M;
elsewhere
—U
U Dakota Ss and other not clearly distinguishable Ss a notable source of
water from Minnesota and Iowa to the Rocky Mountains and south
into New Mexico; also in Utah and Arizona — I
In northwestern part of region Fox Hills and related Ss (Lennep, Colgate,
etc.) locally valuable as water sources — M
U U New Jersey,
Maryland,
Delaware —
Magothy
and Raritan
Fm — I
North and
South
Carolina —
Peedee
and Black
Creek
Fms — I
In coastal areas
subject to
saltwater
encroachment and
contamination.
Ss aquifers of the
central regions
and the west
primarily valuable
when water from
other sources
is unavailable
Ss of Montana Gp — M
Ss members of Mesaverde Gp in Wyoming, Colorado,
Utah, New Mexico, and Arizona — M
In Texas aquifers listed
under col. 11 — I
Alabama
and
Georgia —
Ripley
and Eutah
Fms — I
(Continued)
GROUNDWATER 6-7
q 2006 by Taylor & Francis Group, LLC
Table 6A.1 (Continued)
(1) (2) (3) (4) (5) (6) (7) (8) (9) (10) (11) (12)
Geologic
Age and Rock
Type
Western
Mountain
Ranges
Arid
Basin
Columbi
Lava
Plateau
Colorado
Plateau
High
Plains
Unglaciated
Central
Region
Glaciated
Central
Region
Unglaciated
Appalachian
Region
Glaciated
Appalachian
Region
Atlantic
and Gulf
Coastal
Plain
Special
Comments
Tennessee,
Kentucky,
Illinois —
McNairy
Ss — I
Arkansas
to Texas —
Navarro Gp
and Taylor
Fm — I
Lower
creta-
ceous
U U U In northern part of these regions
Lakota, Cloverly, and
Kootenai Ss — M
In southern part Purgatoire and
Dakota Ss—M. Texas aquifers
listed in col. 11—I
U U U Texas —
Woodbine
Ss — I.
New Jersey,
Maryland,
Delaware —
Patapsco
and Patuxent
Fms — I
West of
Mississippi
River,
especially
in Texas —
Edwards Ls
and Ss in
Trinity
Gp — I
Jurassic Locally —
Ss Fm —
M
Locally —
Ss Fm
—M
U Ss Fms.
Some may
not be
develo-
ped — I
U U Absent Absent Absent U
Triassic Locally — Ss
and C Fms — M
U Ss and C
Fms used
locally.
Shinarump
C and corre-
latives give
rise to
springs — I
U U Absent Ss, C, jointed shale, and basalt beds
of Newark Gp in Massachusetts,
Connecticut, New Jersey,
Pennsylvania, Maryland, Virginia,
and North Carolina — M
Water from
Ss, C, and Ls
Fms west of
Mississippi
river,
especially
valuable when
water from
other sources
is unavailable
THE WATER ENCYCLOPEDIA: HYDROLOGIC DATA AND INTERNET RESOURCES6-8
q 2006 by Taylor & Francis Group, LLC
Paleozoic
Permian
U U U DeChelly
Ss — I
U San Andres
Ls in
Roswell
Basin — P
U U Absent U
Kaibab
Ls — M
Quarter-
master
Gp gives
rise to
many
springs —
M
Other Ss
and Ls in
Kansas,
Oklahoma,
and
Texas — M
Pennsyl-
vanian
Tensleep Ss
in Wyoming
and other
Ss else-
where — M
U U U U Ss and C beds from the Appalachians
to Iowa and eastern
Kansas — M to I
Jointed
and
weath-
ered Sh,
Ss, and C
in Rhode
Island and
Massach-
usetts
—M
U
Mississippian Ls locally
but little
deve-
loped;
springs arise
from Ls
in Rocky
Mountains
—M
Afew
springs
arise
from Ls
locally
—U
U Some
springs
arise
from Ls
locally
—U
U In Illinois, Iowa, Missouri, and Kentucky
the Burlington, Keokuk,
and St. Louis Ls — I
Some Ss (primarily Chester) — M
In Alabama and Tennessee — the
Feet Payne chert, Gaspar Fm,
and St. Genevieve and
Tuscumbia Ls — I
In Kentucky many springs arise in Ls
UUDo
Devonian U U U U U U, except locally in Michigan
(Traverse Fm), Illinois,
Missouri, Ohio
(Columbia Ls), and
Kentucky — M
Jointed Ls, Ss, and Sh,
some highly
metamorphosed
M locally and
little used
U
Silurian U U U U U Ls and dolomite Fms
in New York, Kentucky,
Tennessee, Ohio,
Illinois, and Iowa
UUU
Better-known aquifers
include Monroe dolomite
and related carbonate
Fms in Ohio — I;
“Niagaran” dolomite
in Illinois — P (in part)
(Continued)
GROUNDWATER 6-9
q 2006 by Taylor & Francis Group, LLC
Table 6A.1 (Continued)
(1) (2) (3) (4) (5) (6) (7) (8) (9) (10) (11) (12)
Geologic
Age and Rock
Type
Western
Mountain
Ranges
Arid
Basin
Columbi
Lava
Plateau
Colorado
Plateau
High
Plains
Unglaciated
Central
Region
Glaciated
Central
Region
Unglaciated
Appalachian
Region
Glaciated
Appalachian
Region
Atlantic
and Gulf
Coastal
Plain
Special
Comments
Ordovician U U U U U In Arkansas, Missouri,
Iowa, Illinois, eastern
Indiana, southern Wisconsin,
south-
eastern Minnesota,
the St. Peter Ss — I
Locally Ls and Ss Fms;
not highly developed — M
U
Overlying and subjacent
Ls and Ss where present
in above states and in
Kansas, Oklahoma, and
New York — M to I
In Kentucky and
Tennessee — Ls
Fm — M to I
Cambrian U U U U U Ss beds in Wisconsin,
Minnesota, Iowa,
and Illinois include
Jordan Ss,
“Dresbach Fm”
(Galesville Ss, Eau
Claire Fm,
Mt. Simon Ss) — P
(in part)
Ls Fms give
rise to large
springs in
southern
Appal-
achians.
Otherwise
—U
Eastern
New York
and New
England
Ss
Fms — M;
other-
wise — U
U
Ls and Ss Fms in
Missouri and Arkansas
give rise to many
large springs and
yield water to many
wells — P
Precambrian
(including
crystalline
rocks
which may
be younger)
Weathered and jointed
rocks locally — M
U U U U Weathered and jointed rocks locally in Minnesota,
Wisconsin, northern Michigan, Piedmont Plateau,
New England — M to I. Some Ss in North
Central States
UDo
Note: Abbreviations: (1) Aquifers: P, principal aquifer in region; I, important aquifer in region; M, minor aquifer in region; U, unimportant as an aquifer in region. (2) Rock terms; S, sand, Ss,
sandstone; G, gravel; C, conglomerate; Sh, shale; Ls, limestone; Fm, formation; Gp, group.
Source: From Maxey, In Chow, Handbook of Applied Hydrology, McGraw-Hill, Copyright 1964. With permission.
THE WATER ENCYCLOPEDIA: HYDROLOGIC DATA AND INTERNET RESOURCES6-10
q 2006 by Taylor & Francis Group, LLC
M
o
u
n
t
a
i
n
Western
Columbia
Ranges
Lava
Plateau
Alluvial
Basins
ALASKA
HAWAII
Hawaiian
Islands
Alaska
Nonglaciated
Central
region
d
e
t
a
i
c
a
l
G
Colorado
Plateau
and
Wyoming
Basin
Nonglaciated
Central
region
Western Min
Ranges
High
Plains
Western
Ranges
Northeast
Superior
and
Uplands
Nonglaciated
Central region
Central
region
M
ir
Plains
High
Nonglaciated
Central
region
Northeast and
Superior uplands
Atlantic
and
Gulf
Glaciated
Central region
Nonglaciated
Central region
Nonglaciated
Central
region
Piedmont
and
B
l
u
e
R
i
d
g
e
Plain
C
o
a
s
t
a
l
0
0 800 KM
500 MI
Southeast C
oastal
Plain
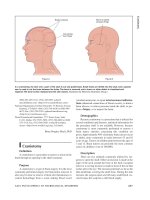
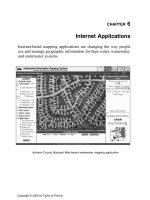
Figure 6A.3 Groundwater regions of the United States. (From Heath, R.C., Classification of ground-water regions of the United States,
Groundwater, 20, 4, 1982.)
GROUNDWATER 6-11
q 2006 by Taylor & Francis Group, LLC
Table 6A.2 Principal Physical and Hydrologic Characteristics of Groundwater Regions in the United States
THE WATER ENCYCLOPEDIA: HYDROLOGIC DATA AND INTERNET RESOURCES6-12
q 2006 by Taylor & Francis Group, LLC
q 2006 by Taylor & Francis Group, LLC
Table 6A.3 Basic Data Required for Groundwater Studies
A. Maps, Cross Sections, and Fence Diagrams
1. Planimetric
2. Topographic
3. Geologic
a. Structure
b. Stratigraphy
c. Lithology
4. Hydrologic
a. Location of wells, observation wells, and springs
b. Groundwater table and potentiometric contours
c. Depth to water
d. Quality of water
e. Recharge, discharge, and contributing areas
5. Vegetative cover, location of wetlands
6. Soils
7. Aerial photographs
B. Data on Wells and Springs
1. Location, depth, diameter, types of well, and logs
2. Static and pumping water level, hydrographs, yield, specific capacity, quality of water
3. Present and projected groundwater development and use
4. Corrosion, incrustation, well interference, and similar operation and maintenance problems
5. Location, type, geologic setting, and hydrographs of springs
6. Observation well networks
7. Water sampling sites
C. Aquifer Data
1. Type, such as unconfined, artesian, or perched
2. Thickness, depths, and formational designation
3. Boundaries
4. Transmissivity, storativity, and permeability
5. Specific retention
6. Discharge and recharge
7. Ground and surface water relationships
8. Aquifer models
D. Climatic Data
1. Precipitation
2. Temperature
3. Evapotranspiration
E. Surface Water
1. Use
2. Quality
3. Runoff distribution, reservoir capacities, inflow and outflow data
4. Return flows, section gain or loss
5. Recording stations
6. Low flow data
F. Environment
1. Location of hazardous waste sites or other potential sources of pollution
2. Use of herbicides, pesticides, fertilizers, and road salt
3. Site history
G. Local Drilling Facilities and Practices
1. Size and types of drilling rigs locally available
2. Logging services locally available
3. Locally used materials, well designs, and drilling practices
4. State or local rules and regulations
Source: From U.S. Bureau of Reclamation, Groundwater Manual ; Amended, 1977.
GROUNDWATER 6-13
q 2006 by Taylor & Francis Group, LLC
1 Northern Great Plains 14Upper Colorado River basin
2
High Plains 15Oahu, Hawaii
3 Central Valley, California 16Caribbean Islands
4
Northern Midwest 17Columbia Plateau
5
Southwest Alluvial Basins
18
San Juan Basin
6
Floridan 19Michigan Basin
7
Northern Atlantic Coastal Plain 20Edwards-Trinity
8
Southeastern Coastal Plain
21
Midwestern Basins and Arches
9
Snake River Plain 22Appalachian Valleys and Piedmont
10 Central Midwest
23Puget-Willamette Lowland
11 Gulf Coastal Plains
24Southern California Alluvial Basins
12 Great Basin
25Northern Rocky Mountain Intermontane
13 Northeast Glacial Aquifers
The U.S. Geological Survey initiated the Regional Aquifer-System Analysis (RASA)
Program in 1978 in response to Federal and State needs for information to improve
management of the Nation's groundwater resources. The objective of the RASA
Program is to define the regional geohydrology and establish a framework of background
information—geologic, hydrologic, and geochemical—that can be used for regional
assessment of groundwater resources and in support of detailed local studies. The
program was completed in 1995.
A total of 25 aquifer s
y
stems were studied under the RASA Pro
g
ram.
15
Hawaii
23
23
17
25
1
9
12
3
24
5
20
Caribbean Islands
18
14
2
10
4
19
21
13
22
11
8
6
16
Figure 6A.4 Regional aquifer study areas. (From .)
THE WATER ENCYCLOPEDIA: HYDROLOGIC DATA AND INTERNET RESOURCES6-14
q 2006 by Taylor & Francis Group, LLC
0 200 400 Miles
0 200 400 Kilometres
Explanation
Depth to saline ground water, in feet
Less than 500
500 to 1,000
More than 1,000
Inadequate information
Figure 6A.5 Depth to saline groundwater in the United States (generalized from Feth and others, 1965). (From USGS fact sheet 075-03,
October 2003.)
10°
15°
15°
10°
5°
15°
20°
20°
20°
20°
25°
5°
Figure 6A.6 Average shallow groundwater temperatures in the United States developed by Collins. (From www.epa.gov.)
GROUNDWATER 6-15
q 2006 by Taylor & Francis Group, LLC
Table 6A.4 Estimated Groundwater in Storage, by Continent
Continent 0–100 m 100–200 m 200–2000 m Total
Europe 0.2 0.3 1.1 1.6
Asia 1.3 2.1 4.4 7.8
Africa 1 1.5 3.0 5.5
North America 0.7 1.2 2.4 4.3
South America 0.3 0.9 1.8 3
Australia 0.1 0.2 0.9 1.2
Total 3.6 6.2 13.6 23.4
Note: In millions of km
3
; based on publications by soviet hydrologists.
Source: From Castany, G., Hydrogeology of deep aquifers, Episodes, 1981, 3, 1981.
Groundwater
0–25 %
26–50 %
51– 75 %
76–100 %
Aquifer areas
Aquifer areas with a flow
rate greater than 0.4 l/sec.
Regions outside Canada
Boundaries
International
Canada / Kalaallit Nunaat
dividing line
EEZ (200 mile)
0 590 1180 1770
2360
km
Figure 6A.7 Groundwater potential in Canada and a percentage of people using groundwater resources in Canadian municipalities over
10,000 people. (From www.atlas.gc.ca.)
THE WATER ENCYCLOPEDIA: HYDROLOGIC DATA AND INTERNET RESOURCES6-16
q 2006 by Taylor & Francis Group, LLC
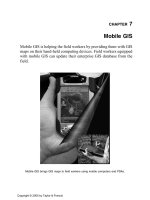
SECTION 6B WATER WELLS — UNITED STATES
600
500
400
300
200
100
0
1900 1910 1920 1930 1940
Year
1950 1960 1964 1980 1985
Number of wells drilled, in thousands per year
WORLD WAR 2
WORLD WAR 1
KOREAN
WAR
DEPRESSION
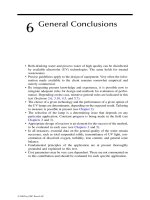
Figure 6B.8 Number of water wells drilled in the United States and relation to major events in the United Stated history. (From Hindall,
S.M., Eberle, Michael,1987, National and regional trends in water-well drilling in the United States 1964–1984, U.S.
Geological Survey, Open File Report 87–247; 1985 data from National Water Well Association.)
Table 6B.5 Number and Type of Water Wells and Boreholes Constructed in the United States in 1985
Application/type 1985
Commercial/industrial 49,379
Heat pump supply/return 18,029
Agricultural irrigation 21,583
Private household 488,918
Public supply 20,010
Monitoring 121,294
Livestock watering
a
29,343
Lawn/turf irrigation
a
27,036
Other 34,482
Total 810,074
Note: Based on Water Well Journal Survey of 8,043 firms.
a
Included in “Other” category on pie chart.
Source: From McCray, Kevin. Copyright Water Well Journal September 1986. Reprinted with permission.
HEAT PUMP
PUBLIC
2.47%
IRRIGATION
2.66%
COMM/IND
6.1%
OTHER
11.22%
MONITORING
14.97%
2.23%
PRIVATE HOUSEHOLD WELLS
60.35%
GROUNDWATER 6-17
q 2006 by Taylor & Francis Group, LLC
HAWAII
ALASKA
LEGEND
UNITS/SQ.MI.
< 10
10 – 40
> 40
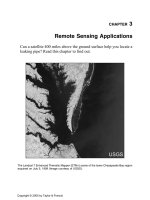
Figure 6B.9 Density of housing units using on site domestic water supply systems in the United States [By county].
(From U.S. Environmental Protection Agency, Office of Water Supply, Office of Solid Waste Management Programs,
1977, The Report to Congress: Waste Disposal Practices and Their Effects on Groundwater.)
THE WATER ENCYCLOPEDIA: HYDROLOGIC DATA AND INTERNET RESOURCES6-18
q 2006 by Taylor & Francis Group, LLC
Table 6B.6 Number and Type of Water Wells in the United States, 1988
State Irrigation Public Supply
a
Community
Supply Household
Alabama N/A 1,706 1,013 267,202
Alaska 10 1,283 454 32,391
Arizona 6,125 2,533 1,650 43,226
Arkansas 21,078 3,220 1,073 213,672
California 67,770 8,143 3,320 359,584
Colorado 17,809 3,116 1,465 84,459
Connecticut N/A 5,373 1,073 241,130
Delaware 559 1,141 497 52,701
Florida 29,017 11,337 4,650 573,059
Georgia 4,492 4,139 2,460 405,078
Hawaii N/A 219 218 536
Idaho 7,371 3,114 1,312 88,853
Illinois 1,107 10,018 1,492 443,681
Indiana N/A 16,100 1,805 546,381
Iowa 2,210 5,052 3,674 236,709
Kansas 18,658 2,456 2,405 116,567
Kentucky N/A 1,144 386 247,506
Louisiana 4,558 3,162 1,996 200,446
Maine N/A 3,433 595 149,331
Maryland N/A 4,955 953 252,142
Massachussets N/A 2,894 1,384 132,119
Michigan N/A 12,188 1,138 934,184
Minnesota 4,250 13,163 2,467 382,572
Missisippi N/A 3,109 2,257 150,816
Missouri 3,700 3,996 1,633 305,853
Montana 997 2,504 999 80,817
Nebraska 61,361 1,558 1,501 112,740
Nevada 2,332 1,156 697 24,142
New Hampshire N/A 2,009 733 110,712
New Jersey N/A 7,765 2,256 227,326
New Mexico 8,031 2,478 1,545 70,157
New York 651 18,068 5,381 659,973
North Carolina 530 15,972 5,094 821,995
North Dakota 808 1,261 718 54,008
Ohio N/A 13,306 3,508 692,062
Oklahoma 4,351 3,265 2,181 164,506
Oregon 9,241 3,330 1,267 178,407
Pennsylvania N/A 17,477 5,578 800,292
Rhode Island N/A 916 169 33,987
South Carolina 185 3,376 2,174 297,435
South Dakota 1,266 1,244 872 56,512
Tennessee 320 3,125 1,006 258,997
Texas 59,636 13,297 9,207 490,453
Utah 2,295 1,961 1,164 14,511
Vermont N/A 1,739 653 58,380
Virginia N/A 6,771 2,869 455,556
Washington 5,853 6,130 3,810 195,132
West Virginia N/A 2,771 834 181,069
Wisconsin N/A 22,982 2,239 521,579
Wyoming 1,409 1,373 647 30,900
Totals 348,116 282,827 98,472 13,101,846
Grand total 13,732,680
Note: N/A, Not available.
a
Includes community supply (systems with at least 15 service connections used by year-round residents or
regularly serving at least 25 year-round residents).
Source: From National Water Well Association, 1988.
GROUNDWATER 6-19
q 2006 by Taylor & Francis Group, LLC
Table 6B.7 Number of Water Wells Drilled in the United States, 1960–1984
Estimated Number of Wells Drilled
a
Percent
Percentage Change between
Annual Totals
b
State 1960 1964 1980 1981 1982 1983 1984
of Total
Drilled
in 1984
1960
and
1964
1964
and
1984
1980
and
1984
Alabama 4,000 4,500 5,960 6,420 5,920 5,570 6,260 1.6 C13 C39 C5
Alaska 726 1,000 2,440 2,400 2,400 2,800 2,700 0.68 C38 C170 C11
Arizona 1,400 1,520 2,190 2,220 2,380 2,710 2,760 0.7 C8.6 C82 C26
Arkansas 5,000 5,000 4,010 5,910 2,750 3,320 4,200 1.1 NC K16 C5
California 9,100 10,000 17,100 15,900 11,300 11,000 14,300 3.6 C10 C43 K16
Colorado 3,100 5,910 4,910 4,570 4,390 4,360 4,060 1.0 C91 K31 K17
Connecticut 6,500 6,500 5,470 5,410 4,500 5,140 5,780 1.5 NC K11 C6
Delaware 3,800 3,440 2,000 2,680 2,290 2,700 3,100 0.78 K9.5 K10 C55
District of
Columbia
12 12 ND 0 0 0 ND ND NC ND ND
Florida 33,900 55,000 40,200 40,500 38,900 43,200 45,600 11 C62 K17 C13
Georgia 10,500 10,000 11,000 13,400 10,100 10,800 12,200 3.1 K4.8 C22 C11
Hawaii 17 21 11 11 7 7 2 !0.1 C24 K90 K82
Idaho 1,400 1,400 2,880 1,470 2,400 1,590 1,630 0.35 NC C16 K43
Illinois 21,000 19,500 14,000 12,200 13,400 13,600 15,300 3.9 K7.1 K22
C9.3
Indiana 17,700 15,000 9,670 8,180 9,700 9,180 10,300 2.6 K15 K31 C6.5
Iowa 9,000 15,000 5,890 6,850 4,120 3,780 3,140 0.79 C67 K79 K47
Kansas 4,700 5,500 4,530 5,050 3,380 3,420 3,910 1.0 C17 K29 K14
Kentucky 9,880 9,620 5,060 5,100 4,800 5,440 5,740 1.4 K2.6 K40 C13
Louisiana 974 2,620 6,050 6,830 6,580 5,180 5,560 1.4 C170 C110 K8.1
Maine 1,500 1,700 2,860 2,570 2,440 3,470 3,900 1.0 C13 C130 C36
Maryland 4,020 6,900 7,200 8,000 6,700 8,800 8,300 2.1 C72 C20 C15
Massachusetts 8,000 9,000 6,330 6,270 5,370 6,820 7,670 1.9 C12 K15 C21
Michigan 25,000 25,000 24,000 20,000 16,000 17,000 18,500 4.7 NC K26 K23
Minnesota 13,000 9,000 14,400 10,500 10,800 11,100 12,500 3.1 K31 C39 K13
Mississippi 5,300 5,900 2,670 3,550 2,540 2,400 2,640 0.66 C11 K55 K1
Missouri 6,380 9,990 10,900 8,530 7,830 10,200 11,500 2.9 C57 C15 C5.5
Montana 1,900 2,000 3,580 6,410 6,260 2,360 2,560 0.64 C5.3 C28 K28
Nebraska 5,510 6,000 4,500 5,940 3,470 3,260 3,660 0.92 C8.9 K39 K19
Nevada 824 825 775 765 503 639 718 0.18 NC K13
K7.4
New Hampshire 3,600 4,400 3,050 4,190 2,630 5,210 5,860 1.5 C22 C33 C92
New Jersey 3,800 3,440 8,620 8,540 8,580 10,900 13,100 3.3 K9.5 C280 K52
New Mexico 2,290 3,150 2,750 2,880 3,370 3,430 3,110 0.78 C38 K1.3 C13
New York 25,000 25,000 16,800 17,000 15,600 17,800 20,000 5.0 NC K20 C19
North Carolina 20,000 25,000 10,500 12,000 13,500 15,900 17,100 4.3 C25 K32 C63
North Dakota 4,200 3,760 1,710 2,190 1,450 1,480 1,450 0.36 K10 K61 K15
Ohio 17,100 18,600 16,700 14,300 14,200 14,000 15,700 4.0 C8.8 K160 K6.0
Oklahoma 4,400 5,000 7,980 7,630 6,500 5,870 6,590 1.8 C14 C32 K17
Oregon 3,500 4,500 7,500 6,620 3,800 3,550 3,530 0.89 C29 K22 K53
Pennsylvania 13,500 16,200 15,600 12,400 9,620 8,140 10,800 2.7 C20 K33 K31
Rhode Island 200 250 319 240 206 387 548 0.14 C25 C120 C72
South Carolina 5,300 5,400 11,400 5,340 4,640 7,780 8,740 2.2 C1.9 C62 K23
South Dakota 6,080 5,430 2,210 1,820 1,590 1,330 1,500 0.38 K11 K72 K32
Tennessee 10,000 8,000 7,080 7,130 6,710 7,600 8,020 2.0 K20 NC C13
Texas 19,000 25,000 16,200 17,700 21,700 17,700 21,200 5.3 C32 K15
C31
Utah 630 650 630 547 507 488 548 0.14 C3.2 K16 K13
Vermont 1,240 1,460 3,100 2,280 1,900 2,330 3,050 0.77 C18 C110 K1.6
Virginia 8,500 10,000 10,900 8,830 9,060 15,300 16,900 4.3 C18 C69 C55
Washington 1,400 1,700 5,040 4,290 3,550 4,320 4,030 1.0 C21 C137 K20
West Virginia 5,500 5,900 3,280 3,510 2,730 2,580 2,900 0.73 C7.3 K51 K12
Wisconsin 11,000 12,000 11,600 9,900 9,590 10,400 11,700 2.9 C9.1 K2.5 C0.86
(Continued)
THE WATER ENCYCLOPEDIA: HYDROLOGIC DATA AND INTERNET RESOURCES6-20
q 2006 by Taylor & Francis Group, LLC
Table 6B.8 Regional Trends in Water-Well Construction in the United States, 1960–1984
Number of Wells Drilled
Average
Annual
Total 1980
Through
Region 1960 1964 1980 1981 1982 1983 1984 1984
Northeast (includes DC) 63,300 68,000 62,100 60,600 50,800 60,200 70,800 60,900
Southeast 95,300 126,000 102,000 106,000 93,600 112,000 121,000 107,000
Great Lakes and Central
Appalachians
130,000 123,000 106,000 95,300 87,900 90,900 101,000 96,200
South-Central 54,800 77,200 63,200 62,100 60,600 57,300 63,300 61,300
Northern Rockies and Northern
Great Plains
20,100 19,600 17,900 16,700 18,100 12,500 13,300 15,700
Southwest (includes Hawaii) 12,000 13,000 20,700 17,700 15,100 14,800 18,300 17,300
Pacific Northwest (includes
Alaska)
5,620 7,200 15,000 11,400 9,750 8,670 10,300 11,000
Totals 381,000 434,000 387,000 370,000 336,000 359,000 397,000 370,000
Percentage of Total Wells Drilled Percentage Change between Annual Totals
1964 1984 1960 and 1964 1964 and 1984 1980 and 1984
Northeast (includes
DC)
16 18 C7.4 C4.1 C14
Southeast 29 30 C32 K3.9 C19
Great Lakes and
Central
Appalachians
28 25 K5.4 K18 K4.7
South-Central 18 16 C41 K18 NC
Northern Rockies
and Northern
Great Plains
4.5 3.3 K2.5 K32 K26
Southwest (includes
Hawaii)
3.0 4.6 C8.3 C41 K12
Pacific Northwest
(includes Alaska)
1.7 2.6 C28 C43 K31
Totals 100 100 C14 K8.5 C2.6
Source: From Hindall, S.M., Eberle, Michael, national and regional trends in water-well drilling in the United States 1964–1984, U.S.
Geological Survey, Open File Report, 87–247, 1987.
Table 6B.7 (Continued)
Estimated Number of Wells Drilled
a
Percent
Percentage Change between
Annual Totals
b
State 1960 1964 1980 1981 1982 1983 1984
of Total
Drilled
in 1984
1960
and
1964
1964
and
1984
1980
and
1984
Wyoming 1,000 1,000 3,010 3,680 2,970 2,500 2,520 0.6 NC C152 K16
Totals 381,000 434,000 387,000 371,000 336,000 359,000 397,000 100 C14 C8.5 C2.6
a
Numbers rounded to three significant figures.
b
Numbers rounded to two significant figures.
Source: From Hindall, S.M., Eberle, Michael, national and regional trends in water-well drilling in the United States 1964–1984, U.S.
Geological Survey, Open File Report, 87–247, 1987.
GROUNDWATER 6-21
q 2006 by Taylor & Francis Group, LLC
SECTION 6C WATER WELLS
THE WATER ENCYCLOPEDIA: HYDROLOGIC DATA AND INTERNET RESOURCES6-22
q 2006 by Taylor & Francis Group, LLC
Table 6C.9 Water Well Construction Methods and Applications
Method
Materials for
Which Best
Suited
Water Table
Depth for
Which Best
Suited (m)
Usual
Maximum
Depth (m)
Usual
Diameter
Range (cm)
Usual
Casing
Material
Customary
Use
Yield
m
3
/day
a
Remarks
Augering
Hand auger
Clay, silt sand, gravel
less than 2 cm
2–9 10 5–20 Sheet metal Domestic,
drainage
15–250 Most effective for penetrating
and removing clay. Limited
by gravel over 2 cm. Casing
required if material is loose
Power auger Clay, silt sand, gravel
less than 5 cm
2–15 25 15–90 Concrete, steel or
wrought-iron pipe
Domestic,
irrigation,
drainage
15–500 Limited by gravel over 5 cm,
otherwise same as for hand
auger
Driven Wells
Hand, air
hammer
Silt, sand, gravel less
than 5 cm
2–5 15 3–10 Standard weight pipe Domestic,
drainage
15–200 Limited to shallow water table,
no large gravel
Jetted Wells
Light, portable
rig
Silt, sand, gravel less
than 2 cm
2–5 15 4–8 Standard weight pipe Domestic,
drainage
15–150 Limited to shallow water table,
no large gravel
Drilled Wells
Cable tool
Unconsolidated and
consolidated
medium hard and
hard rock
Any depth 450
b
8–60 Steel or wrought-iron
pipe
All uses 15–15,000 Effective for water exploration.
Requires casing in loose
materials. Mudscow and
hollow rod bits developed
for drilling unconsolidated
fine to medium sediments
Rotary Silt, sand, gravel less
than 2 cm; soft to
hard consolidated
rock
Any depth 450
b
8–45 Steel or wrought-iron
pipe
All uses 15–15,000 Fastest method for all except
hardest rock. Casing
usually not required during
drilling. Effective for gravel
envelope wells
Reserve-
circulation
rotary
Silt, sand, gravel,
cobble
2–30 60 40–120 Steel or wrought-iron
pipe
Irrigation,
industrial,
municipal
2500–20,000 Effective for large-diameter
holes in unconsolidated and
partially consolidated
deposits. Requires large
volume of water for drilling.
Effective for gravel
envelope wells
Rotary-
percussion
Silt, sand, gravel less
than 5 cm; soft to
hard consolidated
rock
Any depth 600
b
30–50 Steel or wrought–iron
pipe
Irrigation,
industrial,
municipal
2500–15,000 Now used in oil exploration.
Very fast drilling. Combines
rotary and percussion
methods (air drilling)
cuttings removed by air.
Would be economical for
deep water wells
a
Yield influenced primarily by geology and availability of groundwater.
b
Greater depths reached with heavier equipment.
Source: From U.S. Soil Conservation Service, Engineering Field Manual for Conservation Practices, 1969.
GROUNDWATER 6-23
q 2006 by Taylor & Francis Group, LLC
Table 6C.10 Relative Performance of Different Drilling Methods in Various Types of Geologic Formations
Type of
Formation
Cable
Tool
Direct
Rotary
(with
Fuids)
Direct
Rotary
(with
Air)
Direct
Rotary
(Down-the-Hole
Air
Hammer)
Direct
Rotary
(Drill-
Through
Casing
Hammer)
Reverse
Rotary
(with
fluids)
Reverse
Rotary
(Dual
Wall)
Hydr-
aulic
Percu-
ssion Jetting Driven Auger
Dune sand 2 5
Not recommended
Not recommended
65
a
65531
Loose sand and gravel 2 5 6 5
a
65531
Quicksand 2 5 6 5
a
655
Not recommended
1
Loose boulders in
alluvial fans or glacial
drift
3–2 2–1 5 2–1 4 1 1 1
Clay and slit 3 5 5 5 5 3 3 3
Firm shale 5 5 5 5 5 3
Not recommended
2
Sticky shale 3 5 5 3 5 3 2
Brittle shale 5 5 5 5 5 3
Not applicable
Sandstone — poorly
cemented
34
Not applicable
454
Sandstone — well
cemented
33 5 3 5 3
Chert nodules 5 3 3 3 3 5
Limestone 5 5 5 6 5 5 5
Limestone with chert
nodules
53 5 6 3 3 5
Limestone with small
cracks or fractures
53 5 6 2 5 5
Limestone, cavernous 5 3–1 2 5 1 5 1
Dolomite 5 5 5 6 5 5 5
Basalts, thin layers in
sedimentary rocks
53 5 6 3 5 5
Basalts — thick layers 3 3 4 5 3 4 3
Basalts — highly
fractured (lost
circulation zones)
31 3 3 1 4 1
Metamorphic rocks 3 3 4 5 3 4 3
Granite 3 3 5 5 3 4 3
Note: Rate of Penetration: 1, Impossible; 2, Difficult; 3, Slow; 4, Medium; 5, Rapid; 6, Very rapid.
a
Assuming sufficient hydrostatic pressure is available to contain active sand (under high confining pressures).
Source: From Driscoll, F.G., 1986, Groundwater and Wells. Copyright Johnson Division.
THE WATER ENCYCLOPEDIA: HYDROLOGIC DATA AND INTERNET RESOURCES6-24
q 2006 by Taylor & Francis Group, LLC
Table 6C.11 Description of Drilling Methods
Methods Without Drilling Fluids
Displacement Boring
Pros:
† Does not require heavy equipment (by hand or lightweight equipment)
† Clean method for shallow well installation
Cons:
† Method limited to shallow depths
† Method limited to soft soils and boulder, cobble-free zones
† Not efficient if necessary to install several wells
† Practical limitation up to w2
00
diameter sampler
Similar to the above method is “Direct Push Technology” or DPT. A common trade name is GeoProbe.
DPT does not require heavy equipment, most units are pickup mounted or ATV mounted for easy
accessibility
Driven Wells
Pros:
† Cost effective
† Easy access in most conditions
Cons:
† Limited to shallow depths (! 50 ft)
† Limited to unconsolidated, soft formations relatively free of cobbles or boulders
† May require pre-drilling a hole of slightly greater diameter that the well point
Solid-Stem Auger
Pros:
† Rapid and low-cost drilling in clayey formations
† Clean method, does not require circulation fluids
† No casing necessary where the formation is stable
† Allows collection of representative sample in semi-consolidated formations
Cons:
† Practical limitation to 24
00
diameter
† Inefficient in loose, sandy material (depends on the depth)
† Inefficient below the water table (depends on the depth)
Hollow-Stem Auger (HSA)
Pros:
† Allows collection of uncontaminated sample in unconsolidated formation
† Can be used as temporary casing to prevent caving
† Relatively rapid, especially in clayey formations
Cons:
† Ineffective through boulders
† Limited drilling in loose, granular soils, particularly below the water table where sample recovery
can be compromised
† Difficult to retrieve a sample in loose, granular soil because cuttings do not always want to come
to the surface. Samples must be collected with a split spoon or a continuous corer, either of which
can provide excellent samples if done correctly
† Limited to rather shallow depths
Sonic Drilling
Pros:
† Drilling can proceed with or without the use of drilling fluids
† Method can be utilized in unconsolidated and some consolidated formations
† Minimal disturbance to soil samples
† Good recovery of quasi-continuous samples
† Conventional air rotary or down-hole hammer methods can be employed through the outer drive
casing
† The rig can also be operated as a fluid rotary machine
Cons:
† A relatively new method that is not available everywhere
† Relatively expensive compared to other drilling methods
(Continued)
GROUNDWATER 6-25
q 2006 by Taylor & Francis Group, LLC