The Water Encyclopedia: Hydrologic Data and Internet Resources - Chapter 8 doc
Bạn đang xem bản rút gọn của tài liệu. Xem và tải ngay bản đầy đủ của tài liệu tại đây (7.3 MB, 224 trang )
CHAPTER 8
Water Quality
Katherine L. Thalman and James M. Bedessem
CONTENTS
Section 8A Water Quality. . . 8-1
Section 8B Drinking Water Quality Standards United States 8-33
Section 8C Drinking Water Standards — World . 8-54
Section 8D Municipal Water Quality. . . 8-71
Section 8E Industrial Water Quality . . . 8-105
Section 8F Irrigation Water Quality . . . 8-115
Section 8G Water Quality for Aquatic Life . . . . . 8-129
Section 8H Recreational Water Quality . 8-176
Section 8I Water Quality for Livestock and Aquaculture . . 8-183
Section 8J Water Treatment Processes . 8-189
Section 8K Water Treatment Facilities . 8-218
8-1
q 2006 by Taylor & Francis Group, LLC
SECTION 8A WATER QUALITY
Table 8A.1 Summary of Quality Inputs to Surface and Groundwaters
Contributing Factor Principal Quality Input to Surface Waters
Meteorological water Dissolved gases native to atmosphere
Soluble gases from man’s industrial activities
Particulate matter from industrial stacks, dust, and radioactive particles
Material washed from surface of earth, e.g.,
Organic matter such as leaves, grass, and other vegetation in all stages of
biodegradation
Bacteria associated with surface debris (including intestinal organisms)
Clay, silt, and other mineral particles
Organic extractives from decaying vegetation
Insecticide and herbicide residues
Domestic use Undecomposed organic matter, such as garbage ground to sewer, grease, etc.
(exclusive of industrial) Partially degraded organic matter such as raw wastes from human bodies
Combination of above two after biodegradation to various degrees of sewage
treatment
Bacteria (including pathogens), viruses, worm eggs
Grit from soil washings, eggshells, ground bone, etc.
Miscellaneous organic solids, e.g., paper, rags, plastics, and synthetic materials
Detergents
Industrial use Biodegradable organic matter having a wide range of oxygen demand
Inorganic solids, mineral residues
Chemical residues ranging from simple acids and alkalis to those of highly complex
molecular structure
Metal ions
Agricultural use Increased concentration of salts and ions
Fertilizer residues
Insecticide and herbicide residues
Silt and soil particles
Organic debris, e.g., crop residue
Consumptive use (all sources) Increased concentration of suspended and dissolved solids by loss of water to
atmosphere
Contributing Factor Principal Quality Input to Groundwater
Meteorological water Gases, including O
2
and CO
2
,N
2
,H
2
S, and H
Dissolved minerals, e.g.:
Bicarbonates and sulfates of Ca and Mg dissolved from earth minerals
Nitrates and chlorides of Ca, Mg, Na and K dissolved from soil and organic decay
residues
Soluble iron, Mn, and F salts
Domestic use Detergents
(principally via septic tank Nitrates, sulfates, and other residues of organic decay
systems and seepage from polluted Salts and ions dissolved in the public water supply
surface waters) Soluble organic compounds
Industrial use
(not much direct disposal to soil)
Soluble salts from seepage of surface waters containing industrial wastes
Agriculture use Concentrated salts normal to water applied to land
Other materials as per meteorological waters
Land disposal of solid wastes Hardness-producing leaching from ashes
(not properly installed) Soluble chemical and gaseous products or organic decay
Note: This list includes the types of things that may come from any contributing factor. Not all are present in each specific instance.
Source: From McGauhey, Engineering Management of Water Quality, McGraw-Hill, Copyright 1968.
THE WATER ENCYCLOPEDIA: HYDROLOGIC DATA AND INTERNET RESOURCES8-2
q 2006 by Taylor & Francis Group, LLC
Table 8A.2 Conditions That May Cause Variations in Water Quality
Climatic conditions Runoff from snowmelt—muddy, soft, high bacterial count
Runoff during drought—high mineral content, hard, groundwater characteristics
Runoff during floods—less bacteria than snowmelt, may be muddy (depending upon
other factors listed below)
Geographic conditions Steep headwater runoff differs from lower valley areas in ground cover, gradients,
transporting power, etc.
Geologic conditions Clay soils produce mud
Organic soils or swamps produce color
Cultivated land yields silt, fertilizers, herbicides, and insecticides
Fractured or fissured rocks may permit silt, bacteria, etc., to move with groundwater
Mineral content dependent upon geologic formations
Season of year Fall runoff carries dead vegetation—color, taste, organic extractives, bacteria
Dry season yields dissolved salts
Irrigation return water, in growing season only
Cannery wastes seasonal
Aquatic organisms seasonal
Overturn of lakes and reservoirs seasonal
Floods generally seasonal
Dry period, low flows, seasonal
Resource management practices Agricultural soils and other denuded soils are productive of sediments, etc. (See third
item under Geologic conditions.)
Forested land and swampland yield organic debris
Overgrazed or denuded land subject to erosion
Continuous or batch discharge of industrial wastes alters shock loads
Inplant management of waste streams governs nature of waste
Diurnal variation Production of oxygen by planktonic algae varies from day to night
Dissolved oxygen in water varies in some fashion
Raw sewage flow variable within 24-hr period; treated sewage variation less
pronounced
Industrial wastes variable—process wastes during productive shift; different material
during washdown and cleanup
Source: From McGauhey, Engineering Management of Water Quality, McGraw-Hill, Copyright 1968.
WATER QUALITY 8-3
q 2006 by Taylor & Francis Group, LLC
Table 8A.3 Principal Chemical Constituents in Water — Their Sources, Concentrations, and Effects upon Usability
Constituent Major Sources Concentration in Natural Water Effect upon Usability of Water
Silica (SiO
2
) Feldspars, ferromagnesium and clay minerals,
amorphous silicachert, opal
Ranges generally from 1.0 to 30 mg/L, although
as much as 100 mg/L is fairly common; as
much as 4,000 mg/L is found in brines
In the presence of calcium and magnesium,
silica forms a scale in boilers and on steam
turbines that retards heat; the scale is difficult
to remove. Silica may be added to soft water
to inhibit corrosion of iron pipes
Iron (Fe) 1. Natural sources
Igneous rocks:
Amphiboles, ferromagnesian micas, ferrous
sulfide (FeS), ferric sulfide or iron pyrite
(FeS
2
), magnetite (Fe
3
O
4
)
Generally less than 0.50 mg/L in fully aerated
water. Groundwater having a pH less than 8.0
may contain 10 mg/L; rarely as much as
More than 0.1 mg/L precipitates after exposure
to air; causes turbidity, stains plumbing
fixtures, laundry and cooking utensils, and
Sandstone rocks: 50 mg/L may occur. Acid water from thermal imparts objectionable tastes and colors to
Oxides, carbonates, and sulfides or iron clay
minerals
springs, mine wastes and industrial may
contain more than 6,000 mg/L
foods and drinks. More than 0.2 mg/L is
objectionable for most industrial uses
2. Man-made sources:
Well casing, piping, pump parts, storage
tanks, and other objects of cast iron and
steel which may be in contact with the water
Industrial wastes
Manganese (Mn) Manganese in natural water probably comes
most often from soils and sediments.
Metamorphic and sedimentary rocks and
mica biotite and amphibole hornblende
minerals contain large amounts of
manganese
Generally 0.20 mg/L or less. Groundwater and
acid mine water may contain more than
10 mg/L. Reservoir water that has “turned
over” may contain more than 150 mg/L
More than 0.2 mg/L precipitates upon oxidation;
causes undesirable tastes, deposits on foods
during cooking, stains plumbing fixtures and
laundry and fosters growths in reservoirs,
filters, and distribution systems. Most
industrial users object to water containing
more than 0.2 mg/L
Calcium (Ca) Amphiboles, feldspars, gypsum, pyroxenes,
aragonite, calcite, dolomite, clay minerals
As much as 600 mg/L in some western streams;
brines may contain as much as 75,000 mg/L
Calcium and magnesium combine with
bicarbonate, carbonate, sulfate, and silica to
form heat-retarding, pipe-clogging scale in
Magnesium (Mg) Amphiboles, olivine, pyroxenes, dolomite,
magnesite, clay minerals
As much as several hundred mg/L in some
western streams; ocean water contains more
than 1,000 mg/L and brines may contain as
much as 57,000 mg/L
boilers and in other heat-exchange
equipment. Calcium and magnesium combine
with ions of fatty acid in soaps to form soap
suds; the more calcium and magnesium, the
more soap required to form suds. A high
concentration of magnesium has a laxative
effect, especially on new users of the supply
Sodium (Na) Feldspars (albite), clay minerals, evaporates,
such as halite (NaCl) and mirabilite
(Na
2
SO
4
10H
2
O), industrial wastes
As much as 1,000 mg/L in some western
streams; about 10,000 mg/L in sea water;
about 25,000 mg/L in brines
More than 50 mg/L sodium and potassium in the
presence of suspended matter causes
foaming, which accelerates scale formation
THE WATER ENCYCLOPEDIA: HYDROLOGIC DATA AND INTERNET RESOURCES8-4
q 2006 by Taylor & Francis Group, LLC
Potassium (K) Feldspars (orthoclase and microcline),
feldspathoids, some micas, clay minerals
Generally less than about 10 mg/L; as much as
100 mg/L in hot springs; as much as
25,000 mg/L in brines
and corrosion in boilers. Sodium and
potassium carbonate in recirculating cooling
water can cause deterioration of wood in
cooling towers. More than 65 mg/L of sodium
can cause problems in ice manufacture
Carbonate (CO
3
) Commonly 0 mg/L in surface water; commonly
less than 10 mg/L in groundwater. Water high
in sodium may contain as much as 50 mg/L of
carbonate
Upon heating, bicarbonate is changed into
steam, carbon dioxide, and carbonate. The
carbonate combines with alkaline earths—
principally calcium and magnesium—to form
Bicarbonate
(HCO
3
)
Limestone, dolomite Commonly less than 500 mg/L; may exceed
1,000 mg/L in water highly charged with
carbon dioxide
a crustlike scale of calcium carbonate that
retards flow of heat through pipe walls and
restricts flow of fluids in pipes. Water
containing large amounts of biocarbonate and
alkalinity are undesirable in many industries
Sulfate (SO
4
) Oxidation of sulfide ores; gypsum; anhydrite;
industrial wastes
Commonly less than 1,000 mg/L except in
streams and wells influenced by acid mine
drainage. As much as 200,000 mg/L in some
brines
Sulfate combines with calcium to form an
adherent, heat-retarding scale. More than
250 mg/L is objectionable in water in some
industries. Water containing about 500 mg/L
of sulfate tastes bitter; water containing about
1,000 mg/L may be cathartic
Chloride (Cl) Chief source is sedimentary rock (evaporates);
minor sources are igneous rocks. Ocean tides
force salty water upstream in tidal estuaries
Commonly less than 10 mg/L in humid regions;
tidal streams contain increasing amounts of
chloride (as much as 19,000 mg/L) as the bay
or ocean is approached. About 19,300 mg/L in
seawater, and as much as 200,000 mg/L in
brines
Chloride in excess of 100 mg/L imparts a salty
taste. Concentrations greatly in excess of
100 mg/L may cause physiological damage.
Food processing industries usually require
less than 250 mg/L. Some industries—textile
processing, paper manufacturing, and
synthetic rubber manufacturing—desire less
than 100 mg/L
Fluoride (F) Amphiboles (hornblende), apatite, fluorite, mica Concentrations generally do not exceed 10 mg/L
in groundwater or 1.0 mg/L in surface water.
Concentrations may be as much as
1,600 mg/L in brines
Fluoride concentration between 0.6 and
1.7 mg/L in drinking water has a beneficial
effect on the structure and resistance to decay
of children’s teeth. Fluoride in excess of
1.5 mg/L in some areas causes “mottled
enamel” in children’s teeth. Fluoride in excess
of 6.0 mg/L causes pronounced mottling and
disfiguration of teeth
(Continued)
WATER QUALITY 8-5
q 2006 by Taylor & Francis Group, LLC
Table 8A.3 (Continued)
Constituent Major Sources Concentration in Natural Water Effect upon Usability of Water
Nitrate (NO
3
) Atmosphere; legumes, plant debris, animal
excrement, nitrogenous fertilizer in soil and
sewage
In surface water not subjected to pollution,
concentration of nitrate may be as much as
5.0 mg/L but is commonly less than 1.0 mg/L.
In groundwater the concentration of nitrate
may be as much as 1,000 mg/L
Water containing large amount of nitrate (more
than 100 mg/L) is bitter tasting and may cause
physiological distress. Water from shallow
wells containing more than 45 mg/L has been
reported to cause methemoglobinemia in
infants. Small amounts of nitrate help reduce
cracking of high-pressure boiler steel
Dissolved solids The mineral constituents dissolved in water
constitute the dissolved solids
Surface water commonly contains less than
3,000 mg/L; streams draining salt beds in arid
regions may contain in excess of
15,000 mg/L. Groundwater commonly
contains less than 5,000 mg/L; some brines
contain as much as 300,000 mg/L
More than 500 mg/L is undesirable for drinking
and many industrial uses. Less than 300 mg/L
is desirable for dyeing of textiles and the
manufacture of plastics, pulp paper, rayon.
Dissolved solids cause foaming in steam
boilers; the maximum permissible content
decreases with increases in operating
pressure
Source: From U.S. Geological Survey, 1962; amended.
THE WATER ENCYCLOPEDIA: HYDROLOGIC DATA AND INTERNET RESOURCES8-6
q 2006 by Taylor & Francis Group, LLC
Table 8A.4 Relative Abundance of Dissolved Solids in Potable Water
Major Constituents
(1.0 to 1000 mg/L)
Secondary Constituents
(0.01 to 10.0 mg/L)
Minor Constituents
(0.0001 to 0.1 mg/L)
Trace Constituents
(generally less than
0.001 mg/L)
Sodium Iron Antimony
a
Beryllium
Calcium Strontium Aluminum Bismuth
Magnesium Potassium Arsenic Cerium
a
Bicarbonate Carbonate Barium Cesium
Sulfate Nitrate Bromide Gallium
Chloride Fluoride Cadmium
a
Gold
Silica Boron Chromium
a
Indium
Cobalt Lanthanum
Copper Niobium
a
Germanium
a
Platinum
Iodide Radium
Lead Ruthenium
a
Lithium Scandium
a
Manganese Silver
Molybdenum Thallium
a
Nickel Thorium
a
Phosphate Tin
Rubidium
a
Tungsten
a
Selenium Ytterbium
Titanium
a
Yttrium
a
Uranium Zirconium
Vanadium
Zinc
a
These elements occupy an uncertain position in the list.
Source: From Davis and DeWiest, Hydrogeology, John Wiley & Sons, Copyright 1966.
Table 8A.5 Characteristics of Water That Affect Water Quality
Characteristic Principal Cause Significance Remarks
Hardness Calcium and magnesium
dissolved in the water
Calcium and magnesium
combine with soap to form an
USGS classification of hardness
(mg/L as CaCO
3
)
insoluble precipitate (curd) and 0–60: Soft
thus hamper the formation of a 61–120: Moderately hard
lather. Hardness also affects 121–180: Hard
the suitability of water for use in
the textile and paper industries
and certain others and in
steam boilers and water
heating
More than 180: Very hard
pH (or hydrogen-ion
activity)
Dissociation of water molecules
and of acids and bases
dissolved in water
The pH of water is a measure of
its reactive characteristics.
Low values of pH, particularly
below pH 4, indicate a
corrosive water that will tend to
dissolve metals and other
substances that it contacts.
High values of pH, particularly
above pH 8.5, indicate an
alkaline water that, on heating,
will tend to form scale. The pH
significantly affects the
treatment and use of water
pH values: less than 7, water is
acidic; value of 7, water is
neutral; more than 7, water is
basic
(Continued)
WATER QUALITY 8-7
q 2006 by Taylor & Francis Group, LLC
Table 8A.5 (Continued)
Characteristic Principal Cause Significance Remarks
Specific electrical
conductance
Substances that form ions when
dissolved in water
Most substances dissolved in
water dissociate into ions that
can conduct an electrical
current. Consequently, specific
electrical conductance is a
valuable indicator of the
amount of material dissolved in
water. The larger the
conductance, the more
mineralized the water
Conductance values indicate the
electrical conductivity, in
micromhos, of 1 cm
3
of water
at a temperature of 258C
Total dissolved solids Mineral substances dissolved in
water
Total dissolved solids is a
measure of the total amount of
minerals dissolved in water
USGS classification of water
based on dissolved solids
(mg/L)
and is, therefore, a very useful Less than 1,000: Fresh
parameter in the evaluation of 1,000–3,000: Slightly saline
water quality. Water containing
less than 500 mg/L is preferred
3,000–10,000: Moderately
saline
for domestic use and for many 10,000–35,000: Very saline
industrial processes More than 35,000: Briny
Source: From Heath, R.C., 1984, Basic groundwater hydrology, U.S. Geological Survey Water-Supply Paper 2220.
THE WATER ENCYCLOPEDIA: HYDROLOGIC DATA AND INTERNET RESOURCES8-8
q 2006 by Taylor & Francis Group, LLC
ALASKA
HAWAII
Re
g
ional data not available
PUERTO RICO
Regional data not available
Less than
120 PPM
120 to 350
PPM
More than
350 PPM
Figure 8A.1 Dissolved solids in surface water. (From U.S. Water Resources Council, 1968.)
150
Stn 028015
Tennessee R.
United States
Stn 001005
R. de la Plata
Stn 054002
Chao Phrya R.
Thailand
Argentina
Stn 033004
Murray Darling
Australia
Stn 075006
Ebro En
Mendavia
Spain
Stn 080007 Sagami R.
JJJASOND
3050
2520
1990
1460
930
400
225
190
155
120
85
50
100
80
60
40
20
0
33100
29240
25380
21520
17660
13800
1400
1150
900
650
400
150
1225
980
735
490
245
0
FM MA
JJJASONDFM MA
JJJASOND
TDS (mg L
–1
)
Discharge (m
3
s
–1
)
FM MA
JJJASONDFM MA
JJJASONDFM MA
JJJASONDFM MA
140
130
120
110
100
700
630
560
490
420
350
140
130
120
110
100
90
215
190
165
140
115
90
165
150
135
120
105
90
450
380
310
240
170
100
Japan
Figure 8A.2 Seasonal variation of total dissolved solids (TDS) and water discharge at selected world river stations for selected
years. (From United Nations Environment Programme, Global Environment Monitoring System Water Programme
(GEMS/WATER), The annotated digital atlas of global water quality, www.gemswater.org. Reprinted with permission.)
WATER QUALITY 8-9
q 2006 by Taylor & Francis Group, LLC
Dissolved Oxygen
Explanation
Trend in concentration
in percent
Upward, >15
Upward, 0–150
None
Downward, 0–15
Downward, >15
Nationwide
Concentration deficit > 4.0 mg/L
Concentration < 6.5 mg/L
Water year
Water year
1980 1981 1982 1983 1984 1985 1986 1987 1988 1989
1980 1981 1982 19831984 1985 1986 1987 1988 1989
100
90
80
70
60
50
40
30
20
10
0
100
90
80
70
60
50
40
30
20
10
0
Percentage of stations where 20 percent
or more of the concentrations were
less than 6.5 mg/L
Percentage of stations where 20 percent
or more of the concentrations were less
than or greater than the values shown
Land use
0
0
Agriculture, 119 stations
Urban, 26 stations
Forest, 98 stations
Range, 100 stations
500 Miles
500 km
Fecal Coliform
Nationwide
Water year
Water year
1980 1981 1982 1983 1984 1985 1986 1987 1988 1989
100
90
80
70
60
50
40
30
20
10
0
100
90
80
70
60
50
40
30
20
10
0
Agriculture, 83 stations
Urban, 20 stations
Forest, 77 stations
Range, 80 stations
Land use
0
0
Percentage of stations where the annual
average concentration was greater than
200 colonies per 100 millieliters
Percentage of stations where the annual
average concentration was greater than
the concentration shown
1980 19811982 1983 1984 1985 1986 1987 1988 1989
200 colonies per
100 milliliters
1,000 colonies per
100 milliliters
500 Miles
500 km
Explanation
Trend in concentration
in percent
Upward, >50
Upward, 0−50
None
Downward, 0−50
Downward, >50
Concentration and trends in dissolved oxygen in stream water at 424 selected water-quality monitoring stations in the
conterminous United States, water years 1980−89.
Concentration and trends in fecal coliform bacteria in stream water at 313 selected water-quality monitoring stations in the
conterminous United States, water years 1980−89.
Figure 8A.3 Concentration trends in dissolved oxygen and fecal coliform bacteria in United States rivers, 1980–1989. (From USDA,
Natural Resources Conservation Services, 1997, Water Quality and Agriculture, Status, Conditions, and Trends,
www.nrcs.usda.gov. Original Source: Smith, R.A., Alexander, R.B., and Lanfear, K.J., 1993, Stream water quality in the
conterminous United States – status and trends of selected indicators during the 1980’s in National Water Summary
1990–91 – Stream water quality, U.S. Geological Survey Water-Supply Paper 2400, www.usgs.gov.)
THE WATER ENCYCLOPEDIA: HYDROLOGIC DATA AND INTERNET RESOURCES8-10
q 2006 by Taylor & Francis Group, LLC
Total Phosphorous
500 Miles
500 km
Explanation
Trend in concentration
in percent
Upward, >50
Upward, 0−50
None
Downward, 0−50
Downward, >50
Nationwide
No data
No data
No data
No data
No data
0.1 mg/L
0.5 mg/L
Percentage of stations where
the annual average concentration was
greater than the concentration shown
Percentage of stations where
the annual average concentration was
greater than 0.1
mg/L
Water year
Water year
Agriculture,110 stations
Urban, 28 stations
Forest, 98 stations
Range, 100 stations
1980 1981 1982 1983 1984 1985 1986 19871988 1989
100
100
90
90
80
80
70
70
60
60
50
50
40
40
30
30
20
20
10
10
0
0
1980 19811982 1983 1984 19851986 1987 1988 1989
Land use
0
0
Percentage of stations where
the annual average concentration was
greater than the concentration shown
Percentage of stations where
the annual average concentration was
greater than 1 milligram per liter
Nationwide
Nitrate
Land use
Explanation
Trend in concentration
in percent
Upward, >50
Upward, 0–50
None
Downward, 0–50
Downward, >50
100
90
80
70
60
50
40
30
20
10
0
100
90
80
70
60
50
40
30
20
10
0
1980 1981 1982 1983 1984 1985 1986 1987 1988 1989
1980 1981 1982 1983 1984 1985 1986 1987 1988 1989
Water year
Water year
1 mg/L
3 mg/L
Agriculture, 88 stations
Urban, 24 stations
Forest, 82 stations
Range, 89 stations
HDSN
500 Miles
500 km
0
0
Concentration and trends total phosphorus in stream water at 410 selected water-quality monitoring stations in the
conterminous United States, water years 1982−1989.
Concentration and trends in nitrate in stream water at 344 selected water-quality monitoring stations in the
conterminous United States, water years 1980−1989.
Figure 8A.4 Concentration trends in phosphorous, nitrate, and suspended solids in United States rivers, 1980 to 1989. (From USDA,
Natural Resources Conservation Services, 1997, Water quality and agriculture, status, conditions, and trends,
www.nrcs.usda.gov. Original Source: Smith, R.A., Alexander, R.B., and Lanfear, K.J., 1993, Stream water quality in the
conterminous United States – status and trends of selected indicators during the 1980’s in National Water Summary
1990–91–Stream water quality, U.S. Geological Survey Water-Supply Paper 2400, www.usgs.gov.)
WATER QUALITY 8-11
q 2006 by Taylor & Francis Group, LLC
Percentage of stations where the
annual average concentration was
greater than the concentration shown
Percentage of stations where the
annual average concentration was
greater than 500 mg/L
Nationwide
Suspended Sediment
Land use
Explanation
Trend in concentration
in percent
Concentration and trends in suspended sediment in stream water at 324 selected water-quality monitoring stations
in the conterminous United States, water years 1980−1989.
Upward, >50
Upward, 0−50
None
Downward, 0−50
Downward, >50
100
90
80
70
60
50
40
30
20
10
0
100
90
80
70
60
50
40
30
20
10
0
1980 19811982 1983 1984 1985 1986 1987 1988 1989
1980 1981 1982 1983 1984 1985 1986 1987 1988 1989
Water year
Water year
Agriculture, 86 stations
Urban, 21 stations
Forest, 77 stations
500 mg/L
1,000 mg/L
100 mg/L
Range, 81 stations
500 Miles
500 km
0
0
Figure 8A.4 (Continued)
THE WATER ENCYCLOPEDIA: HYDROLOGIC DATA AND INTERNET RESOURCES8-12
q 2006 by Taylor & Francis Group, LLC
Table 8A.6 Trends of Surface-Water Quality in the United States, 1974–1981
Number of Stations with—
Constituents and
Properties
Increasing
Trends
No
Change
Decreasing
Trends
Total
Stations
Temperature 39 218 46 303
pH 74 174 56 304
Alkalinity 18 207 79 304
Sulfate 82 182 40 304
Nitrate-nitrite 76 203 25 304
Ammonia 31 221 30 282
Total organic carbon 36 230 13 279
Phosphorus 39 232 30 301
Calcium 23 198 83 304
Magnesium 50 208 46 304
Sodium 103 173 28 304
Potassium 69 193 42 304
Chloride 104 164 36 304
Silica 48 213 41 302
Dissolved solids 68 183 51 302
Suspended sediment 44 204 41 289
Conductivity 69 193 43 305
Turbidity 42 199 18 259
Fecal coliform bacteria 19 216 34 269
Fecal streptococcus bacteria 2 190 78 270
Phytoplankton 22 234 44 300
Dissolved trace metals
Arsenic 68 228 11 307
Barium 4 81 1 86
Boron 2 15 3 20
Cadmium 32 264 7 303
Chromium 12 152 2 166
Copper 6 83 6 95
Iron 28 258 21 307
Lead 5 232 76 313
Manganese 30 250 19 299
Mercury 8 194 2 204
Selenium 2 201 21 224
Silver 1 32 0 33
Zinc 19 251 32 302
Note: Selected water-quality constituents and properties at NASQAN stations.
Source: From U.S. Geological Survey Water-Supply Paper 2250.
WATER QUALITY 8-13
q 2006 by Taylor & Francis Group, LLC
522.836 to 5685.231
0.0 to 522.836
0.0 to 0.0
0.0 to 0.0
Suspended sediment concentration_ milligrams per liter
Suspended sediment
5685.231 to 217000.0 6.408 to 44.686
2.404 to 6.408
0.0 to 2.404
0.0 to 0.0
0.0 to 0.0
Nitrite plus nitrate_water_filtered_milligrams per liter as nitrogen
Nitrite plus nitrate
Lead_water_filtered_micrograms per liter
Lead
3.249 to 29.777
0.633 to 3.249
0.0 to 0.633
0.0 to 0.0
0.0 to 0.0
Arsenic_water_filtered_micrograms per liter
Arsenic
19.974 to 284.0
4.079 to 19.974
0.0 to 4.079
0.0 to 0.0
0.0 to 0.0
Chloride_water_filtered_milligrams per liter
272.212 to 4742.1
55.944 to 272.212
0.0 to 55.944
0.0 to 0.0
0.0 to 0.0
Phosphorus_water_filtered_milligrams per liter
Chloride Phosphorous
0.768 to 11.0
0.186 to 0.768
0.0 to 0.186
0.0 to 0.0
0.0 to 0.0
Figure 8A.5 United States Geological Survey NAWQA water quality thematic maps showing maximum concentrations of suspended
sediment, nitrite plus nitrate, lead, arsenic, chloride, and phosphorous detected in rivers of the United States. (From United
States Geological Survey, NAWQA Date Warehouse Mapper, www.maptrek.er.usgs.gov/NAWQAMapTheme/index.jsp,
Maps generated in May 2005.)
THE WATER ENCYCLOPEDIA: HYDROLOGIC DATA AND INTERNET RESOURCES8-14
q 2006 by Taylor & Francis Group, LLC
Table 8A.7 Estimates of National Background Nutrient Concentrations in the United States
Nutrient
Background
Concentration
(mg/L)
Total nitrogen in streams
(Data from 28 watersheds in first 20 study units)
1.0
Nitrate in streams
(26)
0.6
Ammonia in streams
(26)
0.1
Nitrate in shallow groundwater
(27)
2.0
Total phosphorus in streams
(26)
0.1
Orthophosphate in shallow groundwater
(Data from 47 wells in first 20 study units)
0.02
Source: From U.S. Geological Survey, 1999, The quality of our nation’s waters, nutrients and pesticides,
U.S. Geological Survey Circular 1225, .
WATER QUALITY 8-15
q 2006 by Taylor & Francis Group, LLC
Table 8A.8 Water Quality of Great Salt Lake, Utah, 1850–1998
Silica
(SiO
2
)
Calcium
(Ca)
Magnesium
(Mg)
Sodium
(Na)
Potassium
(K)
Lithium
(Li)
Bicarbonate
(AsCO
3
)
Sulfate
(SO
4
)
Chloride
(Cl)
Fluoride
(F)
Boron
(B)
Bromlum
(Br)
Total
Percent
Precauseway
1850 — 0.27 38.29 — — — 5.57 55.87 — — — 100
1869 — 0.17 2.52 33.15 1.60 — — 6.57 55.99 — — — 100
August 1892 — 1.05 1.23 33.22 1.71 — — 6.57 56.22 — — — 100
October 1913 — 0.16 2.76 33.17 1.66 — 0.09 6.68 55.48 — — — 100
March 1930 — 0.17 2.75 32.90 1.61 — 0.05 5.47 57.05 — — — 100
South of causeway
April 1960 0.00 0.12 2.91 32.71 1.71 — 0.06 6.60 55.88 0.01 — 100
December 1963 0.00 0.09 3.29 31.02 1.86 — 0.07 9.02 54.64 — 0.01 — 100
May 1966 0.00 0.09 3.80 30.56 2.22 0.02 0.10 7.99 65.21 0.00 0.01 — 100
June 1976 — 0.17 3.47 31.29 2.66 0.02 — 7.22 55.11 — 0.01 0.04 100
July 1998 — 0.23 3.52 31.67 2.16 — — 6.36 56.07 — — — 100
North of causeway
December 1963 0.00 0.09 4.66 29.08 2.75 — 0.09 7.28 56.04 — 0.01 — 100
May 1966 — 0.05 4.38 29.67 2.61 0.02 0.09 8.58 54.59 0.00 0.01 — 100
June 1976 — 0.13 3.17 32.04 2.58 0.02 — 6.62 55.39 — 0.01 0.04 100
July 1998 — 0.11 3.09 32.59 1.53 — — 6.40 56.29 — — — 100
Note: Composition, in percentage by weight, of dissolved ions in brine.
Source: From Modified from Arnow, Ted, 1984, Water-level and water-quality changes in Great Salt Lake, Utah, 1847–1983, U.S. Geological Survey Circ. 913; 1998 Data Utah Geological
Survey met.utah.edu/jhorel/homepages/jhorel/saltlake/chemistry.html.
THE WATER ENCYCLOPEDIA: HYDROLOGIC DATA AND INTERNET RESOURCES8-16
q 2006 by Taylor & Francis Group, LLC
Measurements
made in
nonconsecutive
years
Railroad
causeway
constrcted
Pre-causeway
Gunnison Bay
at Saline gage
Gilbert Bay
at Saltair
Boat Harbor gage
Post-causeway
30
27
24
21
18
15
12
Salinity (percent)
9
6
3
0
1873
1850
1879
1889
1894
1900
1903
1907
1930
1958
1961
1964
1966
1968
1970
1972
1974
1976
1978
1980
1982
1984
1986
1988
1990
1992
1994
1996
1998
Figure 8A.6 Salinity in the Great Salt Lake, Utah 1950–1998. The Salinity of Great Salt Lake is determined by the amount of inflow (and its
salt content) and the amount of evaporation. When there is a lot of inflow, the lake elevation increases and the salinity of the
water decreases. When there is less inflow or the evaporation rate is high, the lake elevation declines and the water becomes
saltier. In 1959, a solid-fill railroad causeway was constructed across the middle of the lake. The causeway divides the lake
into two parts: the north part (Gunnison Bay), which receives little freshwater inflow, and the south part (Gilbert Bay), which
receives almost all the inflow. For any given lake elevation, the salinity of Gunnison Bay is always greater than the salinity of
Gilbert Bay. The USGS measures salinity periodically at Saltair Boat Harbor and at Promontory (Gilbert Bay) and at Saline
(Gunnison Bay). (From U.S. Geological Survey, />WATER QUALITY 8-17
q 2006 by Taylor & Francis Group, LLC
Condensation
Nitrogen, oxygen
carbon dioxide
dissolved
Precipitation
Temporary retention in moun-
tain areas as soil water
1. CO
2
dissolved in soil, Ca, Mg,
Na bicarbonates added to
water
1. CO
2
added, forming carbonic
acid
2. SO
4
dissolved in areas, where
oxidation of sulfides is
occuring
3. Connate water or soluble
compounds of marine
sediments added
Evporation
Mineral
matter re-
tained in soil
Transpiration
Mineral matter
largely retained
in soil, partly
carried off in
crop plants
2. Reaction of soil minerals with
carbonic acid to form soluble
bicarbonates
3. Precipitation of colloidal iron,
aluminum, and silica, of car-
bonates as solubility limit is
reached
4. Cation exchange
Runoff
Phreatophytes
Groundwater
1. Cation exchange
Atmosphere
Evaporation
Chlorides and
sulfates of
sodium,
magnesium,
calcium, and
potassium
carried with
water vapor
Soil water
Effluent
seepage
Outflow to ocean
Carries mineral matter back
Subsurface outflow to ocean
2. Sulfate reduction by
anaerobic bacteria
substituting bicarbonate
for the sulfate
Ocean
Figure 8A.7 Geochemical cycle of surface and groundwater. (From U.S Geological Survey.)
THE WATER ENCYCLOPEDIA: HYDROLOGIC DATA AND INTERNET RESOURCES8-18
q 2006 by Taylor & Francis Group, LLC
Table 8A.9 Natural Inorganic Constituents Commonly Dissolved in Groundwater That Are Most Likely to Affect Use of the Water
Substance Major Natural Sources Effect on Water Use
Concentrations of
Significance (mg/L)
a
Bicarbonate (HCO
3
)
and
carbonate (CO
3
)
Products of the solution of carbonate rocks,
mainly limestone (CaCO
3
)
and dolomite (CaMgCO
3
), by water
containing carbon dioxide
Control the capacity of water to
neutralize strong acids.
Bicarbonates of calcium and
magnesium decompose in steam
boilers and water heaters to form
scale and release corrosive
carbon dioxide gas. In
combination with calcium and
magnesium, cause carbonate
hardness
150–200
Calcium (Ca) and
magnesium (Mg)
Soils and rocks containing limestone,
dolomite, and gypsum (CaSO
4
).
Small amounts from igneous and
metamorphic rocks
Principal cause of hardness and of
boiler scale and deposits in hot-
water heaters
25–50
Chloride (Cl) In inland areas, primarily from seawater
trapped in sediments at time of
deposition; in coastal areas, from
seawater in contact with freshwater
in productive aquifers
In large amounts, increase
corrosiveness of water and, in
combination with sodium, gives
water a salty taste
250
Fluoride (F) Both sedimentary and igneous rocks.
Not widespread in occurrence
In certain concentrations, reduces
tooth decay; at higher
concentrations, causes mottling of
tooth enamel
0.7–1.2
b
Iron (Fe) and
manganese (Mn)
Iron present in most soils and rocks;
manganese less widely distributed
Stain laundry and are objectionable
in food processing, dyeing,
bleaching, ice manufacturing,
brewing, and certain other
industrial processes
FeO0.3, MnO0.05
Sodium (Na) Same as for chloride. In some sedimentary
rocks, a few hundred milligrams per liter
may occur in freshwater as a result of
exchange of dissolved calcium and
magnesium for sodium in the aquifer
materials
See chloride. In large
concentrations, may affect
persons with cardiac difficulties,
hypertension, and certain other
medical conditions. Depending on
the concentrations of calcium and
magnesium also present in the
water, sodium may be detrimental
to certain irrigated crops
69 (irrigation),
20–170 (health)
c
Sulfate (SO
4
) Gypsum, pyrite (FeS), and other rocks
containing sulfur (S) compounds
In certain concentrations, gives
water a bitter taste and, at higher
concentrations, has a laxative
effect. In combination with
calcium, forms a hard calcium
carbonate scale in steam boilers
300–400 (taste),
600–1,000
(laxative)
a
A range in concentration is intended to indicate the general level at which the effect on water use might become significant.
b
Optimum range determined by the U.S. Public Health Service, depending on water intake.
c
Lower concentration applies to drinking water for persons on a strict diet; higher concentration is for those on a moderate diet.
Source: From Heath, R.C., 1982, Basic groundwater hydrology, U.S. Geological Survey Water-Supply Paper 2220.
WATER QUALITY 8-19
q 2006 by Taylor & Francis Group, LLC
Table 8A.10 Inorganic Substances Found in Groundwater
Concentration
(mg/L)
Aluminum 0.1–1,200
Ammonia 1.0–900
Antimony —
Arsenic 0.01–2,100
Barium 2.8–3.8
Beryllium less than 0.01
Boron —
Cadmium 0.01–180
Calcium 0.5–225
Chlorides 1.0–49,500
Chromium 0.06–2,740
Cobalt 0.01–0.18
Copper 0.01–2.8
Cyanides 1.05–14
Fluorides 0.1–250
Iron 0.04–6,200
Lead 0.01–5.6
Lithium —
Magnesium 0.2–70
Manganese 0.1–110
Mercury 0.003–0.01
Molybdenum 0.4–40
Nickel 0.05–0.5
Nitrates 1.4–433
Nitrites —
Palladium —
Potassium 0.5–2.4
Phosphates 0.4–33
Selenium 0.6–20
Silver 9.0–330
Sodium 3.1–211
Sulfates 0.2–32,318
Sulfites —
Thallium —
Titanium —
Vanadium 243.0
Zinc 0.1–240
Source: From Office of Technology Assessment 1984, Protecting the
nation’s groundwater from contamination, U.S. Congress,
Washington DC.
THE WATER ENCYCLOPEDIA: HYDROLOGIC DATA AND INTERNET RESOURCES8-20
q 2006 by Taylor & Francis Group, LLC
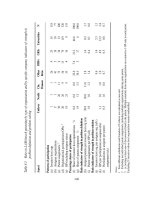
Table 8A.11 Summary of Inorganic Elements Found in Rural Water Supplies
In % of Rural Households
Element
Level Exceeded
(mg/L) Nationwide West North-Central Northeast South
Mercury 0.002 24.1 10.4 31.8 22.0 25.0
Iron 0.3 18.7 7.0 28.2 16.0 17.0
Cadmium 0.01 16.8 27.1 20.7 1.6 17.3
Lead 0.05 16.6 16.9
a
10.8
a
9.6
a
23.1
a
Manganese 0.05 14.2 4.7 19.9 16.9 12.3
Sodium 100 14.2 15.0 19.2 6.0 14.1
Selenium 0.01 13.7 41.3 25.7 0.0 2.1
Silver 0.05 4.7 2.1 3.7 4.8 4.8
Sulfates 250.0 4.0 11.7 7.4 0.5 0.7
Nitrate-N 10.0 2.7 4.0 5.8 0.3 1.3
Fluoride 1.4 2.5 6.2 1.8 0.0 2.7
Arsenic 0.05 0.8 2.1 1.8 0.0 0.0
Barium 1.0 0.3 0.0 0.0 0.0 0.7
Magnesium 125.0 0.1 0.5 0.1 0.0 0.0
Chromium 0.05
b
0.0 0.0 0.0 0.0
Boron
c
Note: According to survey conducted by United States Environmental Protection Agency.
a
May be distorted upwards.
b
Not detected.
c
Not tested.
Source: From U.S Environmental Protection Agency, 1984, National Statistical Assessment of Rural Conditions, Executive Summary.
Office of Drinking Water.
WATER QUALITY 8-21
q 2006 by Taylor & Francis Group, LLC
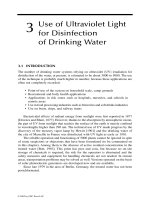
Table 8A.12 Water Quality in Selected Rivers in the World, 1996–1999
Dissolved Oxygen (DO)
(mg/L)
Biological Oxygen Demand (BOD)
(mg/L)
Nitrates (c)
(mg/L)
1996 1997 1998 1999
Average
Last
3 yrs (b) 1996 1997 1998 1999
Average
Last
3 yrs (b) 1996 1997 1998 1999
Average
Last
3 yrs (b)
Canada
Mackenzie X X X X X X X X X X X X X X X
Saskatchewan 8.8 9.2 — — 9.1 X X X X X 0.14 0.15 — — 0.14
Columbia X X X X X X X X X X 0.11 0.10 0.08 — 0.10
Saint John X X X X X X X X X X — — — — —
Mexico
Bravo 7.5 8.0 7.7 — 7.7 3.1 2.0 2.4 — 2.5 0.15 0.18 0.16 — 0.16
Lerma 5.8 3.5 0.7 — 3.3 17.0 12.0 92.3 — 40.4 0.78 0.30 0.82 — 0.63
Pa
´
nuco 6.6 7.6 6.5 — 6.9 1.7 1.6 1.1 — 1.4 0.13 1.06 0.19 — 0.46
Grijalva 5.1 6.4 6.2 — 5.9 4.4 4.3 5.4 — 4.7 — 0.10 0.14 — 0.10
U.S.A
Delaware 10.6 11.8 11.9 11.1 11.6 1.6 1.9 1.3 2.6 1.9 — — — — —
Mississippi 8.4 8.5 8.2 8.8 8.5 0.9 1.1 1.2 1.4 1.2 — — — — —
Japan
Ishikari 11.0 11.0 11.0 11.0 11.0 1.2 1.2 1.2 0.9 1.1 X X X X X
Yodo 9.6 9.4 9.4 9.3 9.4 2.0 1.6 1.7 1.6 1.6 X X X X X
Tone {Sakae-
hashi}
9.5 9.4 9.4 9.5 9.4 2.3 1.5 1.5 2.0 1.7 X X X X X
Chikugo 9.9 9.8 9.8 10.0 9.9 1.4 1.2 1.3 1.4 1.3 X X X X X
Korea
Keum 8.7 8.9 9.8 10.0 9.6 3.9 2.7 2.6 3.0 2.8 2.15 2.09 2.05 2.36 2.17
NakDong 9.3 9.7 9.8 10.5 10.0 3.6 3.4 2.2 2.9 2.8 3.01 2.88 2.78 2.91 2.86
YoungSan 9.4 9.7 9.8 9.5 9.7 2.1 2.1 2.2 2.0 2.1 1.89 2.87 3.23 2.89 3.00
Han 8.7 9.1 10.0 8.3 9.1 3.9 4.1 3.6 3.3 3.7 1.39 2.05 2.36 2.44 2.29
Austria
Donau 11.0 11.5 10.8 — 11.1 3.7 2.5 2.8 — 3.0 2.29 2.21 0.85 — 1.78
Inn 11.5 11.3 11.0 — 11.3 2.4 2.2 2.4 — 2.3 1.48 1.29 1.26 — 1.35
Grossache 11.7 11.2 — — 11.3 1.2 1.1 — — 1.4 0.73 0.68 — — 0.72
Belgium
Meuse 11.0 — — — — 2.5 — — — — 2.00 — — — —
Escaut 7.4 — — — — 5.7 — — — — 4.67 — — — —
Czech R.
Labe 10.3 10.3 9.9 10.3 10.1 3.5 3.9 3.7 3.7 3.8 4.57 4.31 3.89 4.02 4.07
Odra 9.7 9.5 9.9 10.2 9.9 4.9 4.2 3.9 4.8 4.3 3.77 2.35 3.24 3.03 2.87
Morava 11.2 11.0 11.0 10.9 11.0 5.0 5.4 4.4 5.5 5.1 3.98 3.27 3.29 3.46 3.34
Dyje 10.3 10.4 10.5 11.2 10.7 4.5 5.1 6.4 4.5 5.4 5.43 4.44 3.63 3.55 3.87
Denmark
Gudena
´
X X X X X 2.4 3.0 2.3 — 2.6 0.98 1.36 1.50 — 1.28
Skjerna
´
10.5 9.7 8.7 — 9.6 1.3 1.6 1.3 — 1.4 2.29 2.33 2.90 — 2.50
Susa
´
X X X X X 1.9 2.7 — — 2.1 1.01 1.18 — — 1.83
Odense X X X X X 2.0 1.9 — — 1.9 4.22 3.69 5.98 — 4.63
THE WATER ENCYCLOPEDIA: HYDROLOGIC DATA AND INTERNET RESOURCES8-22
q 2006 by Taylor & Francis Group, LLC
Finland
Torniojoki 11.8 11.7 — — 11.6 X X X X X 0.07 0.06 — — 0.06
Kymijoki 8.6 12.1 — — 10.6 X X X X X 0.32 0.19 — — 0.25
Kokema
¨
enjoki 10.8 10.6 — — 10.7 X X X X X 0.53 0.71 — — 0.58
France
Loire 10.1 10.3 10.7 9.9 10.3 5.8 5.9 5.9 4.6 5.4 2.32 2.53 2.65 3.03 2.74
Seine 4.2 4.6 5.9 7.1 5.8 4.7 5.3 4.4 3.4 4.4 6.62 6.27 5.90 5.77 5.98
Garonne 9.5 9.6 9.3 8.5 9.1 1.1 1.4 1.4 1.7 1.5 1.92 2.14 1.85 2.22 2.07
Rho
¨
ne 9.1 9.9 9.7 10.5 10.0 2.1 1.3 1.3 1.5 1.4 1.44 1.50 1.59 1.41 1.50
German
Rhein 10.0 9.9 9.7 10.3 10.0 X X X X X 3.49 3.15 3.15 2.59 2.96
Elbe 11.6 11.2 11.3 11.6 11.4 X X X X X 4.29 3.92 3.57 3.41 3.63
Weser 9.7 10.8 10.1 9.9 10.3 3.8 2.9 2.1 2.4 2.5 4.52 4.52 4.20 4.43 4.38
Donau 11.1 11.1 10.9 11.1 11.0 2.2 2.4 2.2 2.1 2.2 2.34 2.22 2.07 2.10 2.13
Donar 11.1 11.1 10.9 11.1 11.9 X X X X X X X X X X
Greece
Strimonas — — 9.8 11.1 10.8 X X X X X 0.87 2.29 1.04 1.52 1.62
Axios — — 8.3 8.5 9.6 X X X X X 1.13 2.31 0.66 1.24 1.40
Akeloos — — — — — X X X X X X X X X X
Nestos — — — — — X X X X X X X X X X
Hungary
Maros 9.9 9.7 9.9 10.1 9.9 4.3 2.9 3.3 3.7 3.3 1.95 2.06 2.16 2.34 2.19
Duna 9.7 10.8 9.5 10.1 10.1 2.6 2.7 2.6 2.1 2.5 2.59 2.59 1.90 2.12 2.20
Dra
´
va 10.6 10.1 9.8 9.8 9.9 3.1 3.3 3.0 2.9 3.1 1.64 1.37 1.63 1.47 1.49
Tisza 11.1 12.6 12.1 12.7 12.5 1.5 2.0 2.6 3.6 2.7 0.77 0.66 0.77 0.64 0.69
Ireland
Boyne 10.9 10.9 11.0 10.7 10.9 2.0 1.5 1.9 1.6 1.7 3.69 3.25 3.14 2.48 2.96
Clare 11.6 10.9 10.3 10.7 10.6 1.6 1.1 1.5 2.5 1.7 1.82 1.97 1.80 1.40 1.72
Barrow 11.4 10.8 10.9 11.0 10.9 2.4 1.6 1.8 1.5 1.6 5.22 4.58 4.95 4.14 4.55
Blackwater 10.7 10.2 10.8 10.5 10.5 1.9 2.0 2.1 2.7 2.2 2.89 2.76 2.74 2.20 2.57
Italy
Po X X X X X X X X X X 2.89 2.21 2.05 2.10 2.12
Adige 10.4 — 10.7 8.3 9.8 X X X X X 1.26 1.37 1.22 1.15 1.25
Arno 9.2 13.0 7.2 8.1 9.4 X X X X X X X X X X
Metauro 9.9 10.2 9.9 10.0 10.0 X X X X X — — — 1.53 —
Luxembourg
Moselle 9.4 9.1 9.1 9.2 9.1 2.6 2.6 2.2 2.6 2.5 3.07 2.88 2.92 2.62 2.81
Su
¨
re 10.0 10.2 10.4 10.6 10.4 3.1 2.9 2.7 3.1 2.9 5.0 5.45 5.74 4.90 5.36
The Netherlands
Maas-Keizersveer 9.8 9.2 9.2 — 9.4 X X X X X X X X X X
Maas-Eysden X X X X X 3.0 2.0 3.6 — 2.9 X X X X X
Rijn/Maas Delta 11.9 11.4 10.5 — 11.3 X X X X X 3.64 3.03 3.55 2.55 3.04
Rijn-Lobith 10.2 10.0 10.3 — 10.2 3.0 5.0 — — 3.3 3.64 3.55 3.55 2.53 3.14
Ijssel-Kampen 10.0 9.6 9.5 — 9.7 X X X X X 4.02 3.55 3.95 2.64 3.38
Norway
Skienselva X X X X X X X X X X 0.21 0.20 0.21 0.20 0.20
Glomma X X X X X X X X X X 0.40 0.39 0.38 0.36 0.38
Drammenselva X X X X X X X X X X 0.28 0.29 0.27 0.26 0.27
(Continued)
WATER QUALITY 8-23
q 2006 by Taylor & Francis Group, LLC
Table 8A.12 (Continued)
Dissolved Oxygen (DO)
(mg/L)
Biological Oxygen Demand (BOD)
(mg/L)
Nitrates (c)
(mg/L)
1996 1997 1998 1999
Average
Last
3 yrs (b) 1996 1997 1998 1999
Average
Last
3 yrs (b) 1996 1997 1998 1999
Average
Last
3 yrs (b)
Otra X X X X X X X X X X 0.16 0.14 0.14 0.14 0.14
Poland
Wisia 10.2 10.6 10.8 10.5 10.6 3.9 4.6 3.4 3.4 3.8 1.62 1.37 1.84 1.42 1.54
Odra 9.8 9.6 11.6 10.9 10.7 3.7 5.1 5.5 4.0 4.9 2.20 1.89 2.63 2.51 2.34
Slovak R.
Maly Dunaj 9.1 10.5 9.5 9.6 9.8 2.6 3.7 2.9 3.1 3.2 2.55 2.27 2.31 2.48 2.35
Vah 10.1 9.7 9.9 9.3 9.6 4.5 3.9 2.6 2.1 2.9 2.41 2.12 1.71 2.06 1.97
Hron 10.4 10.9 10.5 — 10.6 3.9 3.3 3.2 — 3.5 1.86 1.96 1.89 — 1.90
Hornad 9.6 9.9 9.5 9.6 9.7 6.8 5.4 3.1 2.7 3.7 2.85 3.06 2.64 2.62 2.77
Spain
Guadalquivir 7.0 5.0 6.0 4.0 5.0 14.5 2.6 3.4 6.6 4.2 3.67 6.55 6.08 5.65 6.09
Duero 7.0 7.0 9.0 10.0 8.7 3.8 2.5 2.1 3.7 2.8 1.79 1.81 2.37 1.31 1.83
Ebro 9.6 9.5 10.0 10.0 9.8 5.2 5.5 4.3 — 5.0 2.26 2.75 2.42 — 2.48
Guadiana 9.9 9.3 8.0 — 9.1 2.9 1.8 2.9 — 2.6 2.10 1.97 1.82 — 1.96
Sweden
Dela
`
lven X X X X X X X X X X 0.12 0.10 0.12 0.12 0.11
Ra
`
ne alv X X X X X X X X X X 0.04 0.04 0.03 0.03 0.03
Mo
`
numsa
´
n X X X X X X X X X X 0.16 0.12 0.16 0.19 0.16
Ro
`
nnea
`
n X X X X X X X X X X 1.35 1.74 1.59 1.30 1.54
Switzerland
Rhin 10.6 10.4 10.4 11.1 10.6 X X X X X 1.56 1.40 1.37 1.34 1.37
Aare 10.1 10.5 10.6 10.4 10.5 X X X X X 1.99 1.77 1.78 1.49 1.68
Rho
¨
ne 11.2 11.5 11.5 11.6 11.5 X X X X X X X X X X
Turkey
Porsuk 9.2 9.5 8.7 8.2 8.8 1.3 1.1 1.3 1.3 1.2 1.45 1.20 1.15 1.21 1.19
Sakarya 8.8 9.1 9.3 8.6 9.0 3.7 3.2 3.5 3.4 3.4 1.37 1.42 1.43 1.50 1.45
Yesilirmak 10.2 9.6 9.6 8.8 9.3 2.0 2.7 2.4 2.2 2.4 2.90 1.70 7.53 5.05 4.76
Gediz 3.9 4.9 6.3 5.5 5.6 2.2 2.0 5.5 3.3 3.6 1.15 0.57 0.29 0.06 0.31
UK
Thames 10.2 11.0 10.8 10.5 10.8 3.0 2.7 1.7 1.7 2.0 8.13 7.85 7.68 6.79 7.44
Severn 10.7 10.8 10.3 — 10.6 2.8 2.0 1.9 7.9 3.9 6.95 6.64 6.70 6.20 6.51
Clyde 8.5 8.0 9.6 8.7 8.8 3.9 2.1 2.5 2.3 2.3 1.95 1.88 2.06 1.70 1.88
Mersey 8.1 7.7 8.2 8.2 8.0 3.9 3.6 3.1 2.8 3.2 4.83 4.43 4.73 5.64 4.94
Lower Bann
(N. Ireland)
9.8 9.1 — — 9.2 3.8 2.8 — — 3.4 0.80 1.09 — — 1.01
THE WATER ENCYCLOPEDIA: HYDROLOGIC DATA AND INTERNET RESOURCES8-24
q 2006 by Taylor & Francis Group, LLC
Total Phosphorus (c)
(mg/L)
Ammonium (c)
(mg/L)
Lead (c)
(mg/L)
1996 1997 1998 1999
Average
Last
3 yrs (b) 1996 1997 1998 1999
Average
Last
3 yrs (b) 1996 1997 1998 1999
Average
Last2
3 yrs (b)
Canada
Mackenzie 0.07 — — — — X X X X X 1.63 — — — —
Saskatchewan 0.04 0.05 — — 0.044 0.041 0.041 — — 0.039 0.87 2.57 — — 1.39
Columbia 0.01 0.01 0.01 0.01 0.009 X X X X X 0.96 0.76 0.42 0.34 0.51
Saint John — — — — — X X X X X — — — — —
Mexico
Bravo 0.11 0.13 0.10 — 0.113 0.030 0.030 0.030 — 0.030 X X X X X
Lerma — 2.60 5.63 — — — 1.350 18.450 — — X X X X X
Panuco — — 0.03 — — 0.020 0.060 0.030 — 0.037 X X X X X
Grijalya 0.19 0.03 0.04 — 0.085 — 0.080 0.120 — 0.067 X X X X X
USA
Delaware 0.05 0.06 0.05 0.09 0.067 0.030 0.040 0.030 0.040 0.037 — — — — —
Mississippi 0.19 0.15 0.18 0.24 0.190 0.020 0.020 0.060 0.020 0.033 — — — — —
Japan
Ishikari X X X X X X X X X X X X X X X
Yodo X X X X X X X X X X X X X X X
Tone {Sakae-
hashi}
X XXX X XXXX X XXXX X
Chikugo X XXX X XXXX X XXXX X
Korea
Keum 0.13 0.10 0.05 0.04 0.064 0.838 0.922 0.530 0.411 0.621 — — — — 0
NakDong 0.07 0.14 0.08 0.04 0.086 0.901 0.516 0.283 0.124 0.308 — — — — 0
YoungSan 0.15 0.07 0.14 0.10 0.105 0.510 0.230 0.236 0.317 0.261 — — — — 0
Han 0.28 0.37 0.21 0.21 0.264 2.368 2.416 1.624 1.540 1.860 — — — — 0
Austria
Donau 0.04 0.11 0.16 — 0.104 0.160 0.124 0.150 — 0.145 0.64 0.54 5.00 — 2.06
Inn 0.04 0.18 0.14 — 0.117 0.098 0.101 0.080 — 0.093 0.58 1.34 1.60 — 1.17
Grossache 0.08 0.07 — — 0.070 0.015 0.030 — — 0.025 3.20 4.00 — — 2.40
Belgium
Meuse 0.15 — — — — 0.050 — — — — 3.90 — — — —
Escaut 0.80 — — — — 4.450 — — — — 8.50 — — — —
Czech R.
Labe — 0.23 0.23 0.21 0.223 0.505 0.429 0.300 0.250 0.326 2.00 1.20 0.85 1.10 1.05
Odra 0.44 0.45 0.39 0.33 0.389 1.912 1.336 0.590 0.500 0.809 17.50 6.38 1.90 1.30 3.19
Morava 0.31 0.25 0.20 0.28 0.243 0.688 0.660 0.390 0.440 0.497 2.67 2.42 1.18 2.20 1.93
Dyje 0.32 0.38 0.51 0.37 0.420 0.462 0.475 0.340 0.390 0.402 X X X X X
Denmark
Gudena
´
0.10 0.11 0.10 — 0.101 0.089 0.095 0.047 — 0.077 X X X X X
Skjerna
´
0.05 0.05 0.06 — 0.053 0.119 0.106 0.094 — 0.106 X X X X X
Susa
´
0.32 0.36 — — 0.278 0.096 0.103 — — 0.097 X X X X X
Odense 0.14 0.14 0.16 — 0.145 0.154 0.076 0.076 — 0.102 X X X X X
Finland
Torniojoki 0.01 0.02 — — 0.017 0.017 — — — 0.017 0.12 0.23 — — 0.15
(Continued)
WATER QUALITY 8-25
q 2006 by Taylor & Francis Group, LLC