Trace Environmental Quantitative Analysis: Principles, Techniques, and Applications - Chapter 5 (end) ppt
Bạn đang xem bản rút gọn của tài liệu. Xem và tải ngay bản đầy đủ của tài liệu tại đây (5.02 MB, 174 trang )
547
5
Specific Laboratory
Experiments
Theory guides, experiment decides.
—I.M. Kolthoff
CHAPTER AT A GLANCE
Identifying the ubiquitous phthalate esters in the environment 551
Determination of polycyclic aromatic hydrocarbons in contaminated soil 556
Data acquisition and control software, introduction to HPLC 561
Determination of organochlorine pesticides, comparison of LLE and SPE
techniques 566
Determination of trifluralin in chemically treated lawns 571
Determination of VOCs in gasoline-contaminated groundwater 576
Screening for BTEX in wastewater 582
Introduction to GC 586
Comparison of soil types via quantitative determination of chromium 591
Determination of ultratrace lead in drinking water 594
Determination of degree of hardness in groundwater 599
Determination of oil and grease in wastewater using SPE 604
Comparison of UV and IR absorption spectra of chemically similar organic
compounds 609
Determination of anionic surfactants in wastewater 613
Visible spectrophotometric determination of trace iron in groundwater 617
Spectrophotometric determination of phosphorous in eutrophicated surface
water 621
Introduction to the visible spectrophotometer 623
Determination of inorganic anions in drinking water using IC 628
Determination of Cr(VI) in a contaminated aquifer 636
Introduction to pH measurement, estimating the degree of purity of snow 641
How to weigh the right way 645
References 646
This chapter provides a series of laboratory experiments that attempt to show some
examples of how to conduct trace environmental quantitative analysis (TEQA) in
light of what has been discussed so far. These experiments were written by the author
before the first four chapters were created. The impetus for writing these experiments
© 2006 by Taylor & Francis Group, LLC
548 Trace Environmental Quantitative Analysis, Second Edition
was in support of a graduate-level course titled “Environmental Analytical Chemistry
Laboratory.” This course began in the mid-1990s, and the instruction followed the
installation of a teaching analytical laboratory coordinated by the author at Michigan
State University in the Department of Civil and Environmental Engineering.
There are several options that an instructor can use to design a laboratory
program that gives students the opportunity to measure environmentally significant
chemical analytes. It is this author’s opinion that it does not really matter which
analytes are to be quantitated as long as an appropriate mix of sample prep and
instrumental techniques is applied. One laboratory schedule that was used during
the 1995–1996 academic year is now considered.
1. WHAT MIGHT A TYPICAL LABORATORY
SCHEDULE LOOK LIKE?
Listed below is the laboratory program implemented by the author for a course in
TEQA. Under each experiment title is a statement about what outcomes the student
will realize. The degree to which the instructor makes the course more or less rigorous
is determined by the curriculum objectives. An experimental course in TEQA can
consist of a series of experiments with everything set up for the student at the less
rigorous level or of the same experiments whereby the student does everything. Some
compromise between these two extremes might be the most appropriate.
A series of actual student experiments given as individual handouts follows this
laboratory course outline.
Project No. Description
First 6 weeks Orientation to laboratory discussion of outcomes and what is expected; definition
of and assignment to workstations; safety requirements; waste disposable
regulations
Descriptive introductory information
1 Introduction to visible spectrophotometry and determination of Fe(III)/Fe(II) in
groundwater or determination of PO
4
3–
in surface waters
Quantitative analysis; emphasis on standards preparation techniques; statistical
treatment of data; environmental sampling techniques; learning to operate the UV-vis
spectrophotometer; learning to operate the flame atomic absorption (AA)
spectrophotometer; no write-up required
2 Determination of anionic surfactants by micro-liquid–liquid extraction (
µµ
µµ
LLE)
using ion pairing with methylene blue
Quantitative analysis; emphasis on sample preparation, unknown sample analysis;
write-up required
3 Ultraviolet absorption spectroscopy or infrared absorption spectroscopy or
fluorescence spectroscopy
a
Qualitative analysis; introduction to molecular spectroscopic instrumentation;
sampling techniques; write-up required
4 Determination of the degree of hardness in groundwater using flame atomic
absorption spectroscopy: measuring Ca, Mg, and Fe
Quantitative analysis; calibration using external standard mode; spiked recovery; no
write-up required
© 2006 by Taylor & Francis Group, LLC
Specific Laboratory Experiments 549
Project No. Description
5 Determination of lead in drinking water using graphite furnace atomic absorption
spectroscopy
Quantitative analysis; learning to use the WinLab software for furnace atomic
absorption spectroscopy; calibration based on standard addition; no write-up required
6 Comparison of soil types via a quantitative determination of the chromium
content using visible spectrophotometry and flame atomic absorption
spectroscopy
Quantitative analysis; use of two instrumental methods to determine the Cr (III) and
Cr (VI) oxidation states; digestion techniques applied to soils; write-up required
Next 7 weeks
7 An introduction to data acquisition and control using Turbochrom and an
introduction to high-performance liquid chromatograph (HPLC): evaluating
those experimental parameters that influence instrument performance
Qualitative analysis; emphasis on learning to operate the HPLC and the Turbochrom
software; no write-up required; answer questions in lab notebook
8 Identifying the ubiquitous phthalate esters in the environment using HPLC,
photodiode array detection (PDA), and possible confirmation by gas
chromatography-mass spectrometry (GC-MS)
Qualitative analysis; interpretation of chromatograms, UV absorption spectra, mass
spectra; experience with GC-MS; write-up required
9 An introduction to gas chromatography: evaluating experimental parameters that
affect gas chromatographic performance
Qualitative analysis; emphasis on learning to operate the GC; measurement of split
ratio; no write-up required; answer questions in lab notebook
10 Determination of priority pollutant volatile organic compounds (VOCs) in
wastewater: comparison of sample preparation methods —
µµ
µµ
LLE vs. static
headspace sampling
Quantitative analysis; unknown sample analysis; statistical treatment of data; write-
up required
11 Determination of the herbicide residue trifluralin in soil from lawn treatment by
gas chromatography using solid-phase extraction (SPE) methods
Quantitative analysis; calibration based on internal standard mode; unknown sample
analysis; statistical treatment of data; write-up required
12 Determination of priority pollutant nonvolatile organochlorine pesticides in
contaminated groundwater: comparison of sample preparation methods — µµ
µµ
LLE
vs. solid-phase extraction techniques
a
Quantitative analysis; emphasis on sample preparation, unknown sample analysis;
calibration based on internal mode; statistical treatment of data; write-up required
13 Determination of selected priority pollutant polycyclic aromatic hydrocarbons in
oil-contaminated soil using LLE-RP-HPLC-PDA; determination of oil and grease
in contaminated soil via quantitative Fourier-transform infrared
spectrophotometry
Quantitative analysis; sample preparation; write-up required
a
Projects are considered extra credit and thus not required. Students must make arrangements with the
laboratory instructor in order to perform these experiments.
© 2006 by Taylor & Francis Group, LLC
550 Trace Environmental Quantitative Analysis, Second Edition
This is a very ambitious one-semester laboratory schedule. To effectively educate
students while delivering the course content requires a dedicated support staff, a
committed faculty, sufficient laboratory glassware and accessories, and expensive
analytical instrumentation, including interface of each instrument to a PC that oper-
ates chromatography or spectroscopy software. Each lab session requires a minimum
of 4 h and a maximum of 8 h. Students must be taught not only how to prepare
environmental samples for trace analysis, but also how to operate sophisticated
analytical instrumentation. The intensity of the lab activities starts from an initial
and less rigorous laboratory session, with rigor increasing as each session unfolds.
2. HOW IS THE INSTRUCTIONAL LABORATORY
CONFIGURED?
When the laboratory experiments that follow were developed, the author had just
completed coordinating the installation and start-up of four student workstations.
Each workstation consisted of:
1. One Autosystem
(PerkinElmer Instruments) gas chromatograph incor-
porating dual capillary columns (one for VOCs and one for SVOCs) and
dual detectors (FID and ECD).
2. One HPLC that included a 200 Series
LC binary pump, a manual injector
(Rheodyne), a reversed-phase column and guard column, and a LC250
photodiode array (PDA) ultraviolet absorption detector.
3. One Model 3110
(PerkinElmer Instruments) atomic absorption spectro-
photometer with flame and graphite furnace capability with deuterium
background correction.
4. One personal computer (PC) that enabled all three instruments above to
be interfaced. For GC and HPLC, Turbochrom
(PE-Nelson) Chromatog-
raphy Processing Software (now called TotalChrom; PerkinElmer Instru-
ments) was used for the data acquisition via the 600 LINK
(PE-Nelson)
interface that was external to the PC. For AA, Winlab
(PerkinElmer
Instruments) software was used via an interface board that was installed
into the PC console.
5. A UV-vis spectrophotometer Genesys 5
(Spectronic Instruments) was
used. If another spectrophotometer is used, an infrared phototude is nec-
essary to quantitate in that experiment.
In addition, a Model 2000
(Dionex) ion chromatograph interfaced to the PC
via a 900
interface (PE-Nelson) and a Model 1600
FTIR Spectrophotometer
(PerkinElmer Instruments) were available for all students to use in the instructional
laboratory. Individual university and college departments will have their own unique
laboratory configurations. In order to carry out all of the experiments introduced in
this chapter, instructional laboratories must have, at a minimum, the following
analytical instruments: GC-FID, GC-ECD, HPLC-UV, FlAA and GFAA, IC, and a
UV-vis spectrophotometer (stand-alone). Accessories for sample preparation, as
listed in each of the subsequent experiments, are also needed.
© 2006 by Taylor & Francis Group, LLC
Specific Laboratory Experiments 551
Each experiment that follows was written as independent of the others in the
collection as possible. For ease of access, references drawn from each experiment
have been collected at the end of the chapter and consecutively numbered. Safety
tips appear in each experiment as poignant reminders to students and instructors
alike of the perils associated with laboratory work. Instructors can pick and choose
to use a given experiment as written here or modify it to fit their unique laboratory
situations. Several experiments make reference to the computer programs written
they desire their students to use these programs. If they want to use these programs,
they will have to manually enter the code into MSDOS, along with an execution
program for GWBASIC. The reader will notice that some information in each
intent, and the author hopes revisiting certain key concepts in this chapter reinforces
reader comprehension.
IDENTIFYING THE UBIQUITOUS PHTHALATE ESTERS
IN THE ENVIRONMENT USING HPLC, PHOTODIODE
ARRAY DETECTION, AND CONFIRMATION BY GC–MS
B
ACKGROUND
AND
S
UMMARY
OF
M
ETHOD
The most commonly found organic contaminant in landfills and hazardous waste
sites has proven to be the homologous series of aliphatic esters of phthalic acid.
This author has found phthalate esters in almost every Superfund waste site sample
that he personally analyzed during the period 1986–1990 while employed in an
environmental testing laboratory in New York.
The molecular structures for two representative phthalate esters are drawn
below.
1
Dimethyl phthalate (DMP) and bis(2-ethyl hexyl)phthalate (bis) represent
examples of a lower-molecular-weight phthalate ester to a higher-molecular-weight
ester. DMP and the higher homologs, diethyl phthalate (DEP), di-n-propyl (DPP),
and di-n-phthalate (DBP), are the focus of this exercise.
The photodiode array UV absorption detector provides both spectral peak match-
2
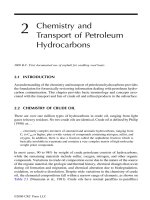
39 min in the HPLC chromatogram is retrieved from a stored library file. The UV
spectrum for the peak and that for a reference standard are compared.
Figure 5.2 overlays UV absorption spectra for three points along the Gaussian
chromatographically resolved peak and uses an algorithm to calculate a purity match.
COOCH
2
CH(C
2
H
5
)(CH
2
)
3
CH
3
COOCH
2
CH(C
2
H
5
)(CH
2
)
3
CH
3
O
O
O
O
C
C
CH
3
CH
3
© 2006 by Taylor & Francis Group, LLC
ing and, if desired, peak purity determinations. This is nicely illustrated in Figure 5.1
and Figure 5.2. In Figure 5.1, the UV absorption spectrum from the peak at or near
experiment duplicates topics covered in Chapters 2, 3, and 4. This duplication is by
by the author in GWBASIC, found in Appendix C. Instructors can decide whether
552 Trace Environmental Quantitative Analysis, Second Edition
Note the difference between the overlayed UV absorption spectra for the impure vs.
the pure peak. You will not be using the peak purity algorithm in this exercise.
Analytical Method Development Using HPLC
Analytical method development in HPLC usually involves changing the composition
of the mobile phase until the desired degree of separation of the targeted organic
compounds has been achieved. One starts with a mobile phase that has a high solvent
strength and moves downward in solvent strength to where a satisfactory resolution
FIGURE 5.1 Spectral peak matching.
FIGURE 5.2 Peak purity determination by spectral overlay.
100
80
60
40
20
Wavelength (nm)
250 300
Spectral library file
Propazine
Atrazine
?
?
Matchi
30 35 40 4525
20
15
10
5
Absorbance (mAU)
Scaled ABS.
200 400
200 400
Wavelength (nm)
Wavelength (nm)
Purity match
764
Purity match
999
Spectra
Signal
Impure Pure
Time (min)
7.8 8.0 8.2 8.47.6
© 2006 by Taylor & Francis Group, LLC
Specific Laboratory Experiments 553
can be achieved. Recall the key relationship for chromatographic resolution from
A useful illustration of the effects of selectivity, plate count, and capacity factor
follows:
HPLC chromatogram (A) shows a partial separation of two organic compounds,
e.g., DMP from DEP. This degree of resolution, R
S
, could be improved by changing
k′, N, or α. In (B), k′ is increased, which changes the retention times and shows a
slight improvement in R
S
. Increasing N significantly increases R
S
, as shown in (C);
the greatest increase in R
S
is obtained by increasing α, as shown in (D). Refer to
Chapter 4 or an appropriate monograph on HPLC to enlarge on these concepts.
GC-MS Using a Quadrupole Mass Spectrometer
In a manner similar to obtaining specific UV absorption spectra for chromatographi-
cally separated peaks, as in HPLC-PDA, GC-MS also provides important identification
of organic compounds first separated by gas chromatography. The mass spectrometer
that you will use consists of four rods arranged to form parallel sides of a rectangle,
RN
k
k
S
= −
′
+
′
1
4
1
1
12
()()
/
α
(D)
(C)
(B)
(A)
t
0
Initial
Increase
N
Increase
α
Vary
k′
t
© 2006 by Taylor & Francis Group, LLC
Chapter 4:
554 Trace Environmental Quantitative Analysis, Second Edition
as shown below. The beam from the ion source is directed through the quadrupole
section, as shown below.
The quadrupole rods are excited with a large DC voltage superimposed on a
radio frequency (RF) voltage. This creates a three-dimensional, time-varying field
in the quadrupole. An ion traveling through this field follows an oscillatory path.
By controlling the ratio of RF to DC voltage, ions are selected according to their
mass-to-charge ratio. Continuously sweeping the RF/DC ratio will bring different
m/z ratios across the detector. An oversimplified sketch of a single quadrupole MS,
O
F
W
HAT
V
ALUE
I
S
T
HIS
E
XPERIMENT
?
The goal of this experiment is to provide an opportunity for students to engage in
analytical method development by identifying an unknown phthalate ester provided
to them. This is an example of qualitative analysis. The reference standard solution
consists of a mixture of the four phthalate esters: DMP, DEP, DPP, and DBP. Each
group will be given an unknown that contains one or more of these phthalate esters.
A major objective would be to use available instrumentation to achieve the goal.
Students will have available to them an HPLC in the reversed-phase mode (RP-HPLC)
and access to the department’s gas chromatograph-mass spectrometer system.
Students must first optimize the separation of the esters using RP-HPLC, record
and store the ultraviolet absorption spectra of the separated esters, and compare the
spectrum of the unknown against the stored UV spectra. In addition, staff will be
available to conduct the necessary GC-MS determination of the unknown. A hard
copy of the chromatogram and mass spectrum will be provided so that the student
will have additional confirmatory data from which to make a successful identification
of the unknown phthalate ester.
EXPERIMENTAL
High-performance liquid chromatograph set up for reversed-phase separations.
Capillary gas chromatograph-mass spectrometer incorporating a quadrupole
mass-selective detector.
Ion
collector
Resonant
ion
Nonresonant
ion
Electron
collector
Ionizing
electron
beam
© 2006 by Taylor & Francis Group, LLC
as shown in Chapter 4, appears below:
Specific Laboratory Experiments 555
Preparation of Chemical Reagents
Note: All reagents used in this analytical method contain hazardous chemicals. Wear
appropriate eye protection, gloves, and protective attire. Use of concentrated acids
and bases should be done in the fume hood.
Accessories to Be Used with the HPLC per Student or Group
1 HPLC syringe. This syringe incorporates a blunt end; use of a beveled-
end GC syringe would damage inner seals to the Rheodyne HPLC injector.
1Four-component phthalate ester standard. Check the label for concentration
values.
1 Unknown sample that contains one or more phthalate esters. Be sure to
record the code for the unknown assigned.
Procedure
Unlike previous exercises, no methods have been developed for this exercise. Consult
with your lab instructor regarding the details for developing a general strategy. You
will be introduced to Turboscan
®
, software that will allow you to store and retrieve
UV absorption spectra.
First, find the mobile phase solvent strength that optimizes the separation of the
four phthalate esters. Second, retrieve the UV absorption spectrum for each of the
four and build a library. Third, inject the unknown sample and retrieve its UV
spectrum. Fourth, make arrangements with the staff to get your unknown analyzed
using GC-MS.
FOR THE REPORT
Include your unknown phthalate ester identification code along with the necessary
laboratory data and interpretation of results to support your conclusions.
Please address the following in your report:
1. Compare the similarities and differences for the homologous series of
phthalate esters on both UV absorption spectra and mass spectra from
your data.
2. Explain what you would have to do if you achieved the optimum resolution
and suddenly ran out of acetonitrile. Assume that you have only methanol
available in the lab. Would you use the same mobile-phase composition
in this case?
3. This exercise introduces you to the quadrupole mass filter. Briefly describe
how the mass spectrum is obtained, and if you so desire, attempt to provide
a brief mass spectral interpretation. You may want to review a text that
© 2006 by Taylor & Francis Group, LLC
introduces GC-MS or review Chapter 4.
556 Trace Environmental Quantitative Analysis, Second Edition
DETERMINATION OF PRIORITY POLLUTANT
POLYCYCLIC AROMATIC HYDROCARBONS (PAHS)
IN CONTAMINATED SOIL USING RP-HPLC-PDA
WITH WAVELENGTH PROGRAMMING
B
ACKGROUND
AND
S
UMMARY
OF
M
ETHOD
In 1979, the EPA proposed Method 610, which, if properly implemented, would
determine the 16 priority pollutant PAHs in municipal and industrial discharges.
3
The method was designed to be used to meet the monitoring requirements of the
National Pollutant Discharge Elimination System (NPDES). The assumption used
was that a high expectation of finding some, if not all, of the PAHs was likely. The
method incorporated packed-column GC in addition to HPLC, and because of the
inherent limitation of packed columns, they were unable to resolve four pairs of
compounds (e.g., anthracene from phenanthrene). Because RP-HPLC could separate
all 16 PAHs, it become the method of choice. The method involved extracting a l-L
sample of wastewater using methylene chloride, use of Kuderna–Danish evaporative
concentrators to reduce the volume of solvent, cleanup using a silica gel microcolumn,
and a solvent exchange to acetonitrile prior to an injection into an HPLC system.
The method requires that a UV absorbance detector and a fluorescence detector be
connected in series to the column outlet. This affords maximum detection sensitivity
because some PAHs (e.g., naphthalene, phenanthrene, fluoranthene, among others)
are much more sensitive when detected by fluorescence than by UV absorption.
In most laboratories today, PAHs are routinely monitored under EPA Method
8270 and comprise the majority of neutrals under the base, neutral, acid (BNAs)
designation of the method.
4
This is a liquid–liquid extraction method with determi-
nation by gas chromatography-mass spectrometry (GC-MS). Careful changes in pH
of the aqueous phase enables a selective extraction of bases and neutrals from acidic
compounds. Examples of priority pollutant organic bases include aniline and sub-
stituted anilines. Examples of priority pollutant organic acids include phenol and
substituted phenols. The most popular method of recent years has been EPA Method
525, which incorporates SPE techniques and is applicable to PAHs in drinking water.
5
The most common wavelength, λ, for use with aromatic organic compounds is
generally 254 nm because almost all molecules that incorporate the benzene ring in
their structure absorb at this wavelength. This wavelength may or may not be the
most sensitive wavelength for most PAHs.
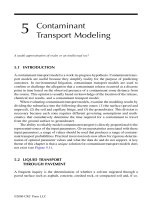
PAHs in a reference standard mixture and from a soil extract. In the lower chro-
matogram of each figure, λ was held fixed at 255 nm, whereas for the upper
chromatogram of each figure, λ was changed during the run so as to demonstrate
how the wavelength influences peak height.
6
The wavelength-programmed HPLC
chromatogram shows much less background absorbance and hence increased sen-
sitivity. This information should be used in developing the wavelength-programmed
HPLC method.
© 2006 by Taylor & Francis Group, LLC
Figure 5.3 compares RP-HPLC chromatograms for the 16 priority pollutant
Specific Laboratory Experiments 557
O
F
W
HAT
V
ALUE
I
S
T
HIS
E
XPERIMENT
?
The exercise affords the student an opportunity to build a new HPLC method using
the chromatography data-handling software. The method will also incorporate the
concept of wavelength programming, whose objective is to maximize detector sen-
sitivity for a given analyte and which can only be performed using a PDA detector
and accompanying digital electronics. The following table summarizes the detection
limits for λ = 255 and 280 and for UV programming during the chromatographic run:
FIGURE 5.3 Comparison of UV detection at 255 nm with programmed wavelength for PAH
standards and for soil extracts that contain PAHs.
20 mAU
20 mAU
255 nm
280 nm
360 nm
335 nm
Absorbance (255 nm) Absorbance
0.0 5.0 10.0 15.0
1
1
2
3
4
5
6*
7
8
9
11
12
13
14*
15
16
2
3
4
5
6
7
8
9
10
11
12
13
14
15
16
10*
Sample: 10 µL NIST 1647b
Sample: 10 µL NIST 1647b
255 nm
Programmed wavelength
*
Higher sensitivity
Lower sensitivity
Minutes
2 mAU
5 mAU
Programmed wavelength
255 nm
1
4
3
4
5
5
6
6
7
7
8
8
9
9
10
10
3
1
13 14
Absorbance (255 nm) Absorbance
0.0 5.0 10.0 15.0
Minutes
Soil extract
255 nm vs programmed wavelength
© 2006 by Taylor & Francis Group, LLC
558 Trace Environmental Quantitative Analysis, Second Edition
EXPERIMENTAL
High-performance liquid chromatograph that incorporates a UV absorption detector
under reversed-phase conditions.
Preparation of Chemical Reagents
Note: All reagents used in this analytical method contain hazardous chemicals. Wear
appropriate eye protection, gloves, and protective attire. Use of concentrated acids
and bases should be done in the fume hood.
Accessories to Be Used with the HPLC per Group
1 HPLC syringe. This syringe incorporates a blunt end; use of a beveled-
end GC syringe would damage inner seals to the Rheodyne injector.
1 sixteen-component PAH standard. Check the label for concentration values.
Procedure
Be sure to record your observations in your laboratory notebook.
Creating the Wavelength Program Method
Again, you will first find the HPLC instrument in the off position; use “hands on”
to activate the instrument and allow at least 15 min for the detector to warm up and
stabilize. Ask your laboratory instructor for assistance if necessary. Observe the
Sensitivity and Linearity Data for UV Absorption Detection
No. PAH
λλ
λλ
==
==
255 nm
(ng)
λλ
λλ
==
==
280 nm
(ng)
λλ
λλ
==
==
Programmed
(ng)
1 Naphthalene 0.6 0.7 0.7(280 nm)
2 Acenaphthylene 0.9 1.9 1.9
3 Acenaphthene 1.42 0.60 0.60
4 Fluorene 0.13 0.53 0.53
5 Phenanthrene 0.06 0.36 0.36
6 Anthracene 0.03 2 1.2(335 nm)
7 Fluoranthene 0.22 0.24 0.45
8 Pyrene 0.25 1.1 0.07
9 Benz(a)anthracene 0.09 0.08 0.5
10 Chrysene 0.06 0.41 6.0
11 Benzo(f)fluoranthene 0.09 0.23 0.4(360 nm)
12 Benzo(k)fluoranthene 0.14 0.31 0.6
13 Benzo(a)pyrene 0.11 0.2 0.2
14 Dibenz(a,h)anthracene 0.45 0.14 4
15 Benzo(g,h,i)perylene 0.32 0.32 0.3
16 Indeno(1,2,3-c,d)pyrene 0.16 0.38 0.35
© 2006 by Taylor & Francis Group, LLC
Specific Laboratory Experiments 559
variability in baseline absorbance. Absorbance should not vary much above a ∆A of
0.0100. Significant variability is most often due to trapped air bubbles because of
insufficient degassing of the mobile phase. Inform your instructor if this baseline
absorbance variation is significant.
Once the baseline is stable, retrieve the method titled “PAH255” and download it.
This method is one previously created by the instructional staff and is a fixed
wavelength (λ at 255 nm). Fill the 5-µL injection loop with the PAH standard and
observe the chromatogram. The method separates the PAHs based on gradient
elution. The method incorporates a one-point calibration.
Use the above tabular information and modify this method to incorporate wave-
length programming as discussed earlier. Save the modified method as “PAHWP,”
where WP stands for “wavelength programmed.” Ask your laboratory instructor for
assistance in developing this software capability. Fill the 5-µL injection loop with
the PAH standard. Using the “chromatograms” section in the main menu, proceed
to retrieve both HPLC chromatograms that you just generated. Use the overlay
capability to compare both chromatograms and print the overlay. Update the one-
point calibration with this standard. You should not have a new method with an
updated calibration prior to injecting the extract from the soil discussed below.
Extraction Procedure for Soil
Weigh approximately 2.0 g of contaminated soil into a 50- or 125-mL glass beaker.
Add 20 mL of methylene chloride and use a glass stirring rod to facilitate mixing.
Let the contents of the mixture stand for at least 10 min. Decant the extract into a
second beaker. It may be necessary to filter this extract if particulates become a
problem. This will depend on the type of sample. Pipette 1.0 mL of the methylene
chloride extract into a clean, dry 10-mL volumetric flask. Adjust to the calibration
mark with acetonitrile. Fill the injection loop with this diluted extract. It may be
necessary to use a 0.45-µm syringe filter to remove particulates from the diluted
extract. Fill the HPLC syringe with about five times the loop volume to ensure a
reproducible injection volume. The peak area that is found refers to the concentration
of a given PAH in the diluted extract. You will be given assistance on how to allow
Turbochrom to calculate the concentration of each PAH in the original contaminated
soil. If time permits, make a second injection of the diluted extract. Discard the
excess methylene chloride extract and CH2Cl2/ACN diluted extract into a waste
receptacle when finished.
Calculation of the ppm of Each PAH in Contaminated Soil
Let us assume that upon injection of the diluted soil extract, a concentration of
225 ppm dibenzo(a,h)anthracene in the diluted soil extract was obtained based on
a correctly calibrated instrument.
What would the original concentration of dibenzo(a,h)antrhacene be in the
contaminated soil?
225 ppm means 225 µg/mL of diluted soil extract
Thus, 225 × 10 = 2250 µg/mL in the original 20 mL of extract before dilution
One says that the dilution factor DF is 10
© 2006 by Taylor & Francis Group, LLC
560 Trace Environmental Quantitative Analysis, Second Edition
(20 mL extract)(2250 µg/mL dibenzo(a,h)anthracene) = 45,000 µg total from
2 g of soil
45,000 µg total/2.0 g soil = 22,500 µg/g or ppm dibenzo(a,h)anthracene in
contaminated soil
Upon properly completing the sequence file within Turbochrom, the final result,
22,500 ppm, will be directly obtained in the “peak report” for that sample.
FOR THE REPORT
Include the overlay comparison and calibration results and list the concentration of
each PAH in the contaminated soil sample. If a second sample result is available,
estimate the precision of the method. Comment on the advantage of using a PDA
to increase sensitivity.
Address the following:
1. Explain the elution order for the 16 PAHs using chemical principles.
2. The method detection limit using a UV absorption detector for some of
the 16 priority pollutant PAHs could be improved if a different detector
could be used. Explain.
3. Explain why this method is considered quick. Are there limitations to the
use of quick methods, and if so, what are some of these?
Some representative PAHs are as follows:
Compound Abbreviation M
r
Molecular
Formula
Molecular
Structure
Aqueous
Solubility Log(K
ow
)
Naphthalene NA 128 C
10
H
8
31.7 3.36
Acenaphthylene ACY 152 C
12
H
8
16.1 3.94
Acenaphthene ACE 154 C
12
H
10
3.93 4.03
Fluorene FLE 166 C
13
H
10
1.98 4.47
Phenanthrene PH 178 C
14
C
10
1.29 4.57
Anthracene AN 178 C
14
H
10
0.073 4.54
Fluoranthene FLA 202 C
16
H
10
0.260 5.22
© 2006 by Taylor & Francis Group, LLC
Specific Laboratory Experiments 561
AN INTRODUCTION TO DATA ACQUISITION AND CONTROL
USING TURBOCHROM AND AN INTRODUCTION TO
HIGH-PERFORMANCE LIQUID CHROMATOGRAPHY (HPLC):
EVALUATING THOSE EXPERIMENTAL PARAMETERS THAT
INFLUENCE SEPARATIONS
BACKGROUND AND SUMMARY OF METHOD
Contemporary analytical instrumentation is said to be interfaced to computers. These
developments commenced in the early to mid-1980s and took hold with Windows-
based software environments in the 1990s. This can be illustrated as follows:
Interfaces can be either stand-alone or installed into the console of the PC. Instru-
ments can be controlled and data acquired from a PC, or if a control is not available,
only data acquisition is obtained. In our laboratory, both types of interfaces are used.
With appropriate software, the control and data acquisition tasks are easily per-
formed. If a means can be acquired to enable automatic sampling to be controlled
as well, a totally automated system results. This was accomplished in our laboratory.
The HPLC within each workstation is PC controlled, and the photodiode array
detector (PDA) is interfaced to the same PC, thus enabling real-time data acquisition.
Compound Abbreviation M
r
Molecular
Formula
Molecular
Structure
Aqueous
Solubility Log(K
ow
)
Pyrene PY 202 C
16
H
10
0.135 5.18
Triphenylene TRP 228 C
18
H
12
0.043 5.45
Benz(a)anthracene BaA 228 C
18
H
12
0.014 5.91
Chrysene CHR 228 C
18
H
12
0.002 5.91
PDA
Data
Control
Control
Acquisition
Link
PC
© 2006 by Taylor & Francis Group, LLC
562 Trace Environmental Quantitative Analysis, Second Edition
Students are first asked to study the present architecture so as to gain an appreciation
of contemporary HPLC-PDA-DS (data system) technology.
This experiment is designed to take you through an initial hands-on experience
with the HPLC-PDA-DS from a first sample injection to a simple quantitative
analysis. A quick method is first necessary for the system to recognize something.
This is followed by optimizing the initial method, conducting a calibration, creating
a customized report format, and evaluating the initial calibration verification (ICV).
Following completion of the initial experiment, the focus shifts to the separation
of the test mixture or organic compounds using the HPLC instrument. The effect of
solvent strength on k′ and the effect of mobile-phase flow rate on R
S
will be considered
by retrieving previously developed Turbochrom methods and making manual injections.
HPLC and Trace Environmental Analysis
High-performance liquid chromatography followed GC in the early development of
instrumental column chromatographic techniques that could be applied to trace
environmental analysis. HPLC most always complements and sometimes duplicates
GC. For example, polycyclic aromatic hydrocarbons (PAHs) can be separated and
quantitated by both techniques; however, N-methyl carbamate pesticides can be
determined by HPLC only as a result of the thermal instability in a GC injection
port. HPLC has become the dominant instrumental analysis method for the phar-
maceutical industry, yet continues to take a secondary role in the environmental
field. Samples that contain the more polar and thermally labile analytes are much
more amenable to analysis by HPLC rather than by GC. A major contaminant in a
lake in California went undetected until State Department of Health chemists iden-
tified a sulfonated anionic surfactant as the chief cause of the pollution. This pollutant
was found using HPLC techniques. HPLC encompasses a much broader range of
applicability in terms of solute polarity and molecular-weight range when compared
To illustrate how these different kinds of HPLC might aid the analyst in the
environmental testing laboratory, consider the request from an engineering firm that
wishes to evaluate the degree of phthalate ester contamination from leachate ema-
nating from a hazardous waste site. Reversed-phase HPLC is an appropriate choice
for the separation of lower-molecular-weight phthalate esters (e.g., dimethyl from
diethyl from dibutyl). Attempts to elute higher-molecular-weight and much more
hydrophobic (lipophilic) phthalate esters (e.g., dioctyl, bis(2-ethyl hexyl)) under
reversed-phase conditions are unsuccessful. The separation of these under normal-
phase HPLC conditions is successful.
Flow-Through Packed Columns
High-performance liquid chromatography requires that liquid be pumped across a
packed bed within a tubular configuration. Snyder and Kirkland
7
have used the
Hagen–Poiseuille equation for laminar flow through tubes and Darcy’s law for fluid
flow through packed beds and derived the following relationship:
© 2006 by Taylor & Francis Group, LLC
with GC. (Review Figure 4.1.)
Specific Laboratory Experiments 563
where t
0
is the retention time of an unretained solute (the time it takes after injection
for an unretained solute to pass through the column and reach the detector), L is the
length of the column, η is the viscosity of the mobile phase, ∆P is the pressure drop
across the column, d
p
is the particle size of the stationary-phase packing, and f is
an integer and is 1 for irregular porous, 2 for spherical porous, and 4 for pellicular
packings.
The importance of stationary-phase particle size is reflected in the dependence
of the void retention volume V
0
= F(t
0
), where F is the mobile-phase flow rate in,
for example, cm
3
/min, on the inverse square of d
p
. Recall that the retention volume
of a retained solute whose capacity factor is given by k′ is
Hence, the smaller the d
p
, the larger is V
0
and, consequently, V
R
. A smaller d
p
also
contributes in a significant manner to a larger N (refer to theoretical equations found
High-Pressure Liquid Chromatograph
It is quite useful to view the instrumentation for HPLC in terms of zones according
to the following schematic:
8
Zone 1 — Low-pressure zone prior to pump. This is a noncritical area served
by Teflon tubing. A fritted filter is placed at the inlet to prevent particulates
from entering the column.
Zone 2 — High-pressure zone between pump and injector. This is a noncrit-
ical area served by standard stainless-steel (SS) tubing usually 1/16 in. in
outer diameter (o.d.). A high-surface-area 0.5-µm filter can be placed here
to prevent particulates from reaching the column.
t
L
Pd f
p
0
2
2
15 000
=
, η
∆
VV k
R
=+
′
0
1()
Zone 2
Zone 1
Zone 3
Zone 5
Zone 4
© 2006 by Taylor & Francis Group, LLC
in Chapter 4).
564 Trace Environmental Quantitative Analysis, Second Edition
Zone 3 — High-pressure area surrounding injector and column. This is a
critical area where the sample is introduced to the separation system. The
volume must be well swept and minimized. Special fittings are 0.25-mm-
inner diameter (i.d.) SS tubing.
Zone 4 — Low-pressure area between column and detector. In this critical
area, separation achieved in the column can be lost prior to detection. The
volume must be well swept and minimized. Special fittings and 0.25-mm
SS or plastic tubing are required. The critical zone extends to all detectors
or fraction collectors in series or parallel connection.
Zone 5 — Low-pressure area leading to waste colletor. This noncritical area
is served by Teflon tubing. Most labs fail to fit the waste vessel with a vent
line to the hood or exhaust area.
EXPERIMENTAL
High-performance liquid chromatograph incorporating a UV absorption detector
under reversed-phase conditions.
Preparation of Chemical Reagents
Note: All reagents used in this analytical method contain hazardous chemicals. Wear
appropriate eye protection, gloves, and protective attire. Use of concentrated acids
and bases should be done in the fume hood.
Accessories to Be Used with the HPLC per Group
1 HPLC syringe. This syringe incorporates a blunt-end; use of a beveled-
end GC syringe would damage inner seals to the Rheodyne injector.
1 10-mL two-component mix at 1000 ppm each. Prepare the mixture by
dissolving 10 mg of phthalic acid (PhtA) and 10 mg of dimethyl phthalate
(DMP) in about 5 mL of 50:50 ACN:H
2
O in a 50-mL beaker. After
dissolution, transfer to a 10-mL volumetric flask and adjust to the final
mark with the 50:50 solution.
Procedure
Be sure to record your observations in your laboratory notebook.
Initial Observations of a Computer-Controlled High-Performance
Liquid Chromatograph
Upon approaching the HPLC-PDA-DS, conduct the following:
1. Identify each of the five zones discussed above.
2. Locate the following hardware components:
a. The IEEE-488 cable to the LINK interface
b. The start/stop line from the Rheodyne injector to the LINK
c. The data acquisition line from the PDA to the LINK
d. The keying and master key
© 2006 by Taylor & Francis Group, LLC
Specific Laboratory Experiments 565
Creating a QuickStart Method, Acquiring Data, Optimizing,
Calibrating, and Conducting Analysis Using the QuickStart Method
Proceed with the Turbochrom 4 Tutorial and create a method using QuickStart. Inject
a 100 ppm test mix reference standard. Optimize the method using the Graphic
Editor. Develop the calibration and report format sections of your method. Establish
a three-point calibration for DMP only between 10 and 100 ppm (inject from low
concentration to high) and prepare an ICV. Run the ICV in triplicate.
Effect of Solvent Strength on k′
A good practice when beginning to use an RP-HPLC instrument is to initially pass
a mobile phase that contains 100% acetonitrile (ACN) so as to flush out of the
reversed-phase column any nonpolar residue that might have been retained from
previously running the instrument. Retrieve the Turbo method titled “100%ACN”
and download if not already set up. Download within “setup” using the “method”
approach.
Retrieve the method from Turbochrom or equivalent software titled “80%ACN”
and proceed to use “Setup in the method mode” to enable you to operate the HPLC
with a mobile-phase composition of 80% ACN and 20% aqueous. The use of “Setup”
is called downloading the method and sequence file so that data acquisition can
begin. The aqueous mobile phase consists of 0.05% phosphoric acid dissolved in
distilled deionized water (DDI). Carefully fill the 5-µL injection loop (the injector
arm should be in the “load” position with the evaluation test mix with the HPLC
syringe). Inject by moving the injector arm from the “load” position to the “inject”
position. Observe the chromatogram that results. Note the retention times of the
components in the mixture. Give all members in the group the opportunity to make
this initial injection.
Retrieve the method titled “60%ACN,” download it, and then proceed to repeat
the injection procedure discussed above. Observe the chromatogram that results and
note retention times.
Retrieve the method titled “40%ACN,” download it, and then proceed to repeat
the injection discussed earlier. Observe the chromatogram that results and note
retention times.
Retrieve the method titled “20%ACN,” download it, and then proceed to repeat
the injection procedure discussed earlier. Observe the chromatogram that results
and note retention times.
Effect of Mobile-Phase Flow Rate on Resolution
The mobile-phase flow rate will be varied and its influence on chromatographic
resolution will be evaluated.
Retrieve the method titled “FlowHi,” download it, and then proceed to use
“Setup” as you did during the variation of solvent strength experiments. Allow
sufficient equilibration time at this elevated mobile-phase flow rate. Notice what
happens to the column back-pressure when a high flow rate is in operation. Inject
the test mix and observe the chromatogram that results.
Retrieve the method titled “FlowLo,” download it, and then proceed to repeat
the injection procedure discussed earlier. Observe the chromatogram that results.
© 2006 by Taylor & Francis Group, LLC
566 Trace Environmental Quantitative Analysis, Second Edition
FOR THE LAB NOTEBOOK
The following empirical relationship has been developed for RP-HPLC. Refer to
9
where k′ is the capacity factor for a retained peak, k
W
is the capacity factor (extrap-
olated) k′ for pure water, Φ is the volume fraction of the organic solvent in the
mobile phase, and S is a constant that is approximately proportional to solute
molecular size or surface area.
Choose one component in the evaluation test mix and determine whether the
above equation is consistent with your observations.
Address the following:
1. Among the three major parameters upon which resolution R
S
depends,
which of the three is influenced by changes in mobile-phase flow rate?
Explain.
2. Mr. Everett Efficient believes that he can conserve resources by operating
his HPLC using a mobile phase that consists only of a 0.01 M aqueous
solution containing sodium dihydrogen phosphate. Discuss what is seri-
ously deficient in Mr. Efficient’s fundamental assumption.
3. Assume that you could change HPLC columns in this exercise and that
you installed a column that contained 3-µm particle size silica. Assume
that you used the same mobile-phase composition that you used for the
reversed-phase separations that you observed. Explain what you would
expect to find if the reversed-phase test mix were injected into this HPLC
configuration.
4. Explain why DMP is retained longer (i.e., has the higher k′) than phthalic
acid given the same mobile-phase composition.
DETERMINATION OF PRIORITY POLLUTANT
SEMIVOLATILE ORGANOCHLORINE PESTICIDES:
A COMPARISON OF MICRO-LIQUID–LIQUID
AND SOLID-PHASE EXTRACTION TECHNIQUES
B
ACKGROUND AND SUMMARY OF METHOD
Organochlorine pesticides (OCs) were used widely in agriculture during he first half
of the 20th century in the U.S. and were subsequently banned from use during the
1970s. Unfortunately, some of the OCs are still in widespread use around the world.
Their persistence in the environment was not apparent until Lovelock introduced
the electron-capture detector (ECD) in 1960.
10
When combined with high-resolution
capillary gas chromatography and appropriate sample preparation methods, the ECD
provides the analytical chemist with the most sensitive means by which to identify
log log
′
= −kkS
W
Φ
© 2006 by Taylor & Francis Group, LLC
Chapter 4 or to a more specialized monograph.
Specific Laboratory Experiments 567
and quantitate OCs in environmental aqueous and soil/sediment samples. As ana-
lytical chemists were seeking to identify and quantitate OCs during the early 1970s,
it became apparent that many additional chromatographically resolved peaks were
appearing. What were considered as unknown interfering peaks in the chromatogram
were then subsequently found to be polychlorinated biphenyls (PCBs).
The OCs and PCBs were first determined in wastewaters using EPA Method
608.
11
This method originally required packed columns, and because of this, it
necessitated extensive sample preparation and cleanup techniques, which included
liquid–liquid extraction and low-pressure column liquid chromatography. Capillary
GC-ECD, when combined with more contemporary methods of sample preparation,
provides for rapid and cost-effective trace environmental analysis. Over the past
10 years, there has been dramatic improvements in sample preparation techniques
as they relate to semivolatile and nonvolatile trace analyses.
In addition to external standard and standard addition, the last principal mode
of calibration is called internal standard. This mode of calibration should be used
when there exists variability in sample injection volume, when there is concern about
the lack of instrument stability, and when there is unavoidable sample loss. Instru-
mental response then becomes related to the ratio of the unknown analyte X to that
for the internal standard S, instead of related only to the unknown analyte. If some
X is lost, one can assume that some S would be lost as well. This preserves the ratio
[X]/[S]. For extraction methods, the internal standard (IS) is added to the final extract
just prior to adjusting the final volume. Selecting a suitable IS is not trivial. It should
possess similar physical and chemical properties to the analyte of interest and not
interfere with the elution of any of the analytes that need to be identified and
quantitated. The IS should be within the same concentration range as for the cali-
bration standards and at a fixed concentration. The following is a calibration curve
for the IS mode:
This exercise introduces the student to solid-phase extraction (SPE) techniques.
The µLLE method will also be implemented. The two methods will be compared.
SPE in the reversed-phase (RP) mode of operation involves passing an aqueous
Signal due to X
Signal due to S
Concentration to X
Concentration to S
© 2006 by Taylor & Francis Group, LLC
568 Trace Environmental Quantitative Analysis, Second Edition
sample over a previously conditioned sorbent that contains a chemically bonded
silica gel held in place with polyethylene frits within a column configuration. A
typical RP-SPE sequence follows:
For RP-SPE, methanol is used to condition or wet the sorbent surface, thereby
activating the octadecyl moiety and hence forcing it to be receptive to a van der
Waals type of intermolecular interaction between the analyte and the C
18
moiety.
This phenomenon is shown below for the isolation of n-butyl phthalate on a C
18
chemically bonded sorbent.
12
The OCs studied in this exercise are lindane, endrin, and methoxychlor. Lindane
(γ-BHC) is synthesized via chlorination of benzene in the presence of ultraviolet
light. This forms a mixture of BHC isomers that are identified as α, β, γ, δ, and ε.
Selective crystallization isolates the γ isomer, whose aqueous solubility is 7.3 to
10.0 ppm and is the most soluble of the BHC isomers. Endrin is a member of the
cyclodiene insecticides and is synthesized using Diels–Alder chemistry. Methoxy-
chlor belongs to the p,p'-DDT category and structurally differs from DDT in sub-
stitution of a methoxy group in place of a chloro group para to the central carbon.
Methoxychlor’s aqueous solubility is 0.1 to 0.25 ppm and exceeds that of p,p'-DDT
1. 2.
A
A
5.3.
A
I
I
A
A
I
I
I
4.
I
I
A
A
A
Sorbent beds
Porous
frits
1. Activation of sorbent
2. Removal of activation solvent
3. Application of sample
4. Removal of interferences (I)
5. Elution of concentrated, purified analytes (A)
Si O R
OOC
OOC
Si O
Octadecyl (C
18
)
n-Butyl phthalate
(CH
2
)
17
CH
3
H
3
C(CH
2
)
3
H
3
C(CH
2
)
3
Si
© 2006 by Taylor & Francis Group, LLC
Specific Laboratory Experiments 569
by a factor of 100.
13
Molecular structures and correct organic nomenclature of these
three representative OCs are shown in the following:
EXPERIMENTAL
Gas chromatograph that incorporates an electron-capture detector.
Preparation of Chemical Reagents
Note: All reagents used in this analytical method contain hazardous chemicals. Wear
appropriate eye protection, gloves, and protective attire. Use of concentrated acids
and bases should be done in the fume hood.
Chemicals/Reagents Needed per Group
1 1000 ppm each of lindane, endrin, and methoxychlor stock standard
solution dissolved in iso-octane. This is a solvent available in ultrahigh
purity, which is an important requirement in trace environmental analysis.
1 20 ppm of an internal standard. Available candidates include 4-hydroxy-
2,4,6-trichlorobiphenyl, 3,4,3′,4′-tetrachlorobiphenyl, 1,2-dibromo-3-
chloropropane, and β-BHC.
1Vial containing approximately 30 mL of methanol for conditioning the
RP-SPE sorbent.
1Vial containing approximately 30 mL of iso-octane.
Preliminary Planning
Because there are two sample preparation methods to be implemented, assemble as
a group at the beginning of the laboratory session and decide who does what. Once
all results are obtained, the group should reassemble and share all analytical data.
P,P ′-Methoxychlor
CH
3
O
CCl
3
OCH
3
H
C
1,1,1-Trichloro-2, bis (p-methoxyphenyl) ethane
1,2,3,4,10,10-Hexachloro-exo-6,7-
epoxy-1,4,4a,5,-6,7,8,8a-octahydro-1,4
-endo, endo-5,8-dimethanonaphthalene
γ-1,2,3,4,5,6-Hexachlorocyclohexane
Gamma-BHC Endrin
H
O
H
H
H
H
H
Cl
Cl
Cl
Cl
CH
2
ClCCl
Cl
Cl
Cl
Cl
Cl
Cl
© 2006 by Taylor & Francis Group, LLC
570 Trace Environmental Quantitative Analysis, Second Edition
Selection of a Suitable Internal Standard
The most appropriate IS needs to be selected from the above list of candidates.
Consult with your laboratory instructor and proceed to inject one or more ISs and
base your decision on an interpretation of the chromatogram.
Procedure for Calibration and Quantitation of the GC-ECD
1. Prepare the necessary primary and secondary dilution standards. The
range of concentration levels for the unknowns is between 100 and
1000 pg/µL (ppb). For example, take a 100-µL aliquot of the 1000 ppm
stock and add to a 10-mL volumetric flask previously half filled with
iso-octane. Adjust to the calibration mark and label “10 ppm L,E,M (iso-
octane), primary dilution.” A 1:10 dilution of this primary dilution stan-
dard gives a secondary dilution, which should be labeled “1 ppm L,E,M
(iso-octane), secondary dilution.” Use the secondary dilution to prepare
a series of working calibrations that cover the range of concentrations in
the ppb domain, as discussed above.
2. Prepare a set of working calibration standards to include an ICV that
brackets the anticipated range for the unknowns. To each calibration
standard, add 50-µL of 20 ppm IS so that the concentration of IS in each
calibration standard is identical and at 1.0 ppm.
3. Retrieve the method from Turbochrom or other equivalent software titled
“LEMIS,” which stands for lindane, endrin, methoxychlor, internal stan-
dard mode of calibration; allow sufficient instrument equilibration time.
Write a sequence encompassing the calibration standards, ICV, and
unknowns. Save the sequence as a file with the name “G#0317” (group
#, March 17th), for example. Begin to inject a 1-µL aliquot of each
working standard. Initially inject iso-octane, then inject in the order of
lowest to highest concentration level. This order is important because it
prevents carryover from one standard to the next.
4. Update the calibration for the LEMIS method and check with your instruc-
tor as to the acceptability of the calibration. If found acceptable, proceed
to the analysis once samples have been prepared using both extraction
methods. Be sure to add the same amount of IS to each unknown extract,
as was done for the calibration standards. Because the instrument has
been calibrated and updated, the report will include an accurate readout
of concentration in a tabular format.
Procedure for Performing µµ
µµ
LLE and RP-SPE
5. Place exactly 40 mL of unknown sample into a 42-mL vial and extract
using 2 mL of iso-octane in a manner similar to that for the BTEX/THMs
exercise. This time, however, add twice the amount of IS that you added
for the preparation of the calibration standards so that the concentration
of IS remains identical to that for all other standards and samples.
© 2006 by Taylor & Francis Group, LLC
Specific Laboratory Experiments 571
6. Place exactly 40 mL of unknown sample into the 70-mL SPE reservoir,
which sits atop a previously conditioned C
18
sorbent, according to specific
instructions given to you by your laboratory instructor. Add distilled
deionized water (DDI) to the reservoir so as to fill to near capacity. Pass
the aqueous sample through the cartridge, which contains approximately
200 mg of C
18
chemically bonded silica gel. Use a wash bottle that
contains DDI to rinse the residual sample from both the reservoir and the
cartridge. Place a second SPE cartridge that is filled with anhydrous
sodium sulfate beneath the sorbent cartridge. The second SPE cartridge
containing anhydrous Na
2
SO
4
is used to remove residual moisture from
the eluent. Into the manifold place a 1.0-mL volumetric flask as an eluent
receiver and elute with two successive 500-µL aliquots of iso-octane. Add
the same amount of IS as used for the calibration standards, then adjust
to a final volume of 1.0 mL. Transfer to a separate container if necessary.
7. Inject a 1-µL aliquot of the sample extract that also contains the IS into
the GC-ECD. At this point, the LEMIS method should have had its
calibration updated.
8. Continue to make injections into the calibrated GC-ECD until all samples
have been completed. You may want to make replicate injections of a
given sample extract.
FOR THE REPORT
Include all calibration plots and calculate the correlation coefficient for the calibra-
tion plot. Calculate the precision and accuracy for the ICV, which should have been
injected in triplicate. Report on the concentration of each unknown sample. Construct
a table that shows the respective concentrations for the unknowns for each of the
two methods. Recall that the final extract volume from µLLE was 2 mL, and that
from SPE was 1 mL. Take this into account when comparing the two methods.
Which sample preparation method is preferable? Give reasons for your preference
and support this with analytical data.
DETERMINATION OF THE HERBICIDE RESIDUE
TRIFLURALIN IN CHEMICALLY TREATED LAWN SOIL
BY GAS CHROMATOGRAPHY USING SOLID-PHASE
EXTRACTION TECHNIQUES
B
ACKGROUND AND SUMMARY OF METHOD
The persistence of trace residue levels of pesticides and herbicides in the environment
has been cause for continued concern since the early 1960s, when it became apparent
that these residues were detrimental to wildlife and possibly to human health. The
benefits of using DDT gradually gave way to the increasing risk of continued use
and led to the banning of its use. Herbicides, however, do not appear to present such
a high risk to the environment and continue to find widespread use. The chlorophe-
noxy acid herbicides are not directly amenable to GC and must first be chemically
© 2006 by Taylor & Francis Group, LLC