Robotics and Automation in Construction Part 9 potx
Bạn đang xem bản rút gọn của tài liệu. Xem và tải ngay bản đầy đủ của tài liệu tại đây (6.14 MB, 30 trang )
An Active Technology for Improving the Sound Transmission Loss of Glazed Facades
233
∑
Δ
ρ
=
=
N
1i
i
2
i
t
Sp
c2
1
J
(7)
being
J the total radiated acoustic power, ρ and c the density and sound velocity of wave in
air;
p
i
the sound pressure values measured at some prescribed measurements points and ΔS
i
the surfaces relative to each measurement point. Pressure values are not directly measured,
but computed from the signals deriving from the reference sensors positioned on the glazed
panel (through the use of filters). Thus, the structural-acoustic coupling is inherent in the
definition of the cost function. It was demonstrated by (Fuller et al.,1997) and (Nelson &
Elliott, 1992) that substituting the opportune expression of radiated sound pressure, given
Fig. 5. Scheme of an ASAC system for glazed panels integrated in buildings
by the superposition of the two contributions of both the disturbance and the control
actuators, the cost function is scalar. It can be converted into a quadratic expression of
complex control voltages, and it was demonstrated that this function has a unique
minimum. The general form of the equation to be minimized becomes:
i
T
T
vcqhJ +=
(8)
where
q is the vector of complex input disturbances, h is the vector of transfer functions
associated with these disturbances;
c is the control transfer function vector and v is the
unknown vector. In this way a vector of voltages
v
i
is computed, minimizing the total
radiated field.
Once the transfer functions between the reference signal deriving from reference sensors and
the acoustic radiated noise is known for a given system, the control plant will automatically
execute all these steps, minimizing the radiated noise even if glazed panels are subject to time-
dependent input disturbances, giving back an automated glazed facade, that actively changes
its properties according to the disturbance. Before implementing this control system, it is
necessary to calculate the control transfer functions, which requires as a preliminary stage, the
choice of the opportune kind of secondary sources, carried out in the next section.
However, the analytical model can be implemented only following a series of
simplifications, which appear difficult to apply in terms of the actual situations that one can
come across in the building field:
Robotics and Automation in Construction
234
- simple support boundary constraints, whereas in fact, constraint situations are more
complex and more similar to a semi- fixed or yielding joint;
-
applications of only point forces, without the association of mass as occurs in the real
case when control is effected through the use of actuators contrasted by stiffening
structures.
Given the above considerations, it has been established that the numeric model based on the
theory of Kirchhoff-Love, will be substituted by a model built using finite element software
programs (ANSYS
TM
, LMS VIRTUAL LAB
TM
), which allows overcoming the simplifications
tied to the analytic model.
4.3 Piezoelectric actuators
Two main types of actuators, suitable for glazed facades, are presently marketed (Fig. 6):
-
Piezoelectric (PZT) patch actuators providing bending actions to excite structures;
-
PZT stack actuators providing point forces to excite structures.
a)
b)
Fig. 6. PZT patch (a) and stack actuators for glazed facades (b).
The first type is usually bonded to a surface while the second needs a stiffening structure to
fix it and make it transfer forces to a surface for controlling purposes. These actuators are
available in a wide range of sizes (from few centimetres to various decimetres) and are
capable of generating high forces (with reduced displacements) inside a wide range of
frequencies (Dimitriadis, Fuller, Rogers, 1991). Even if they were shown to work properly
for many applications, however they have not been tested in applications on glazed facades,
and most of the experiments were carried out in the automotive and aeronautic fields of
research. As far as concerns the choice of actuators, the first rectangular shaped patch may
interfere with visibility (Fig. 7-a); the stack one instead is very small but needs a stiffener in
order to work properly (Fig. 7-b).
a)
b)
Fig. 7. PZT patches (a) and PZT stack actuators (b), as applied on a glass panel.
An Active Technology for Improving the Sound Transmission Loss of Glazed Facades
235
In the asymmetric disposal of Fig. 7-a, the PZT patch excites the 2D structure with pure
bending, that can be simulated with the numerical model developed in (Dimitriadis, Fuller,
Rogers, 1991). It is assumed that the strain slope is continuous through the thickness of the
glass plate and of the PZT patch, but different along the directions parallel to the plate sides,
which in turn are assumed parallel to the coordinate axes (the strain slopes are billed
C
x
and
C
y
). The mathematical relation between strain and z-coordinate is:
zC
xx
⋅=ε and zC
yy
⋅
=
ε
(9)
being the origin of the z-axis in the middle of the plate thickness and ε the strain. The
unconstrained strain of the actuator (ε
pe
) along plate axes is dependent to the voltage applied
(
V), the actuator thickness (h
a
) and the PZT strain constant along x or y directions (d
x
= d
y
):
a
x
pe
h
Vd
=ε
(10)
Considering that the plate is subject to pure bending, no longitudinal waves will be excited,
and by applying the moment equilibrium condition about the centre of the plate along
x and
y directions as in (Fuller, Elliott, Nelson, 1997), assuming that the plate thickness is 2h
b
, the
plate elastic modulus is
E
p
, the actuator elastic modulus is E
pe
, and ν
p
and ν
pe
are the Poisson
coefficients of the plate and actuators respectively; also assuming that moments induced in
the
x and y directions (billed with m
x
and m
y
) are present only under the PZT patch, and
assuming that it is located between the points of coordinates (
x
1
,y
1
) and (x
2
,y
2
), in
(Dimitriadis, Fuller, Rogers, 1991) it is shown that:
(
)
(
)
[
]
(
)
(
)
[
]
2121peyx
yyHyyHxxHxxHCmm
−
−
−
−
−
−
ε
=
=
(11)
being
H(x) the Heaviside function and C=EIK
f
, where I is the moment of inertia of the plate;
then the equation of motion for plates subject to flexural waves can be written:
()
y,xp
t
w
h
y
w
x
w
EI
2
2
4
4
4
4
−=
∂
∂
ρ+
⎟
⎟
⎠
⎞
⎜
⎜
⎝
⎛
∂
∂
+
∂
∂
(12)
where
p is an external uniform pressure applied on the plate. Eq. (11), if written with the
actuator induced moment, becomes:
() ()
[]
(
)
(
)
[
]
0Sw
y
ymyM
x
xmxM
2
2
yy
2
2
xx
2
=ρω−
∂
−∂
+
∂
−∂
(13)
where M is the internal plate moment and m is the actuator induced bending moment; ρ
and S are density and surface of the plate; w is the displacement and ω is the wave phase
change. Assuming that the actuator is perfectly bonded on the glass plate and substituting
(11) inside (13), the solution of (12) can be calculated by using the modal expansion of (3),
which gives back:
()
(
)
21
2
n
2
m
22
mn
2
pe0
mn
ppkk
hmn
C4
W +
ω−ωπρ
ε
=
(14)
where:
p
1
= cos(kmx
1
) - cos(kmx
2
), p
2
= cos(kny
1
) - cos(kny
2
).
Robotics and Automation in Construction
236
Equation (14) can be written in terms of (3) and (5), defining the variable:
(
)
21
2
n
2
m
2
pe0
mn
ppkk
mn
C4
P +
π
ε
= (15)
Thus, given the properties of the PZT patches under use and the ones of the plate, (14)
together with (5) and (3) gives back the transversal displacement function on the 2D plate
caused by PZT patch actuators with respect to
x and y coordinates. In the case shown in Fig.
7-b, the stack actuator has the task of providing a punctual force, instead of a bending
moment. Following a procedure similar to the one explained above, it is possible to calculate
a numerical model that describes the vibration field in terms of (3) and (5) exploiting the
following relation:
f
n
f
m
a
mn
yksinxksin
ab
F4
P =
(16)
where
a and b are the side lengths of the plate; x
f
and y
f
are the coordinate of the point where
the force
F
a
is applied, that is the action provided by the stack actuator, which is dependent
to the reaction system stiffness. Assuming
d
z
the strain constant of the actuator along the z-
direction, its unconstrained displacement will be computed by:
a
z
a
L
Vd
w =
(17)
where
L
a
is its height. In fact the real displacement of the stack is lower than (16) because the
reaction system has finite stiffness
K, and the force effectively exerted by the stack along the
z-direction is:
1
z
a
a
dVK
F
K
K
=
+
(18)
being
ka the actuator stiffness. As in the previous case, the transverse vibration displacement
of a 2D plate can be calculated by (14) with (5) and (3).
In the following numerical simulations, performed according to the model described above,
the disturbance is assumed to be a wave with frequency near the frequency of the mode of
vibration (2,2) of a typical building façade’s panel, whose effect is compared with the one
given by the use of the two aforementioned kinds of actuators. The glazed panel is
supposed to be simply supported along the edges. The two configurations of Fig. 7 are
studied analytically. The properties of the glazed plate used for these simulations are listed
in Tab. 1, while for PZT patches in Tab. 2. For the simply supported plates of Tab. 1, natural
frequencies of vibration are given by (6), whose results are listed in Tab. 3 for the smallest
modes; so the frequency of the disturbance was chosen equal to 78 Hz. In the first case of
Fig. 7-a, the behaviour of the panel of Tab. 1 is simulated when equipped with two
dispositions of PZT patches:
-
8 patches equally distributed 0.05 m far from the panel edges;
-
26 patches equally distributed 0.05 m far from the panel edges.
An Active Technology for Improving the Sound Transmission Loss of Glazed Facades
237
Each rectangular shaped patch measures (0.05 x 0.04) m. Fig. 8 shows the distribution of the
maximum amplitude vibration field along the middle axis of the plate, computed along the
y=l/2. One of the diagrams is referred to the effect due to the disturbance wave at frequency
ν = 78 Hz and intensity 100 dB. For a voltage of 150 V (that is the highest limit for low-
voltage actuators) PZT patches can generate vibration fields far lower than the one
generated by the disturbance.
Vibration amplitude
-2.00E+02
-1.80E+02
-1.60E+02
-1.40E+02
-1.20E+02
-1.00E+02
-8.00E+01
-6.00E+01
-4.00E+01
-2.00E+01
0.00E+00
0
0.07
0.14
0.21
0.28
0.35
0.42
0.49
0.56
0.63
0.7
0.77
0.84
0.91
0.98
1.05
1.12
1.19
x-coordinate (m)
Amplitude (dB)
Disturbance 100 dB
8 PZT patches
26 PZT patches
Fig. 8. Amplitude displacement along the y=l/2 axis due to the positioning of PZT patches
actuators, normalized with respect to the maximum disturbance value.
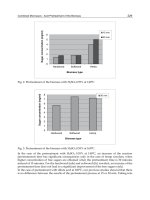
In the second case vibration amplitudes are computed for the stack configuration shown in
Fig. 7-b. In Fig. 9 such vibration amplitudes are drawn with dependence to the voltage
provided to stack actuators. It is assumed that the panel is equipped with 3 actuators (0.02
m
long with 7.8·10
-5
m
2
cross sectional area) per each side, equally spaced and at a 0.03 m
distance from the two edges; the stiffness of the reaction system is assumed equal to 200
N/μm. Fig. 9 shows that, regardless of the small rigidity of the reaction system, the stack
actuators can produce a vibration amplitude comparable with the one due to the
disturbance with only a voltage of 100 V.
Symbol QUANTITY Units of measurement Value
E
p
Modulus of elasticity Pa 6 9·10
10
ν
p
Poisson coefficient - 0.23
ρ
p
density Kg/m
3
2457
h
p
thickness
m 0.006
l
p
Side length m 1.2
Tab. 1. Glazed plate’s properties.
Symbol QUANTITY Units of measurem. Value
E
pe
Modulus of elasticity Pa 6.3·10
10
ν
pe
Poisson coefficient
0.3
ρ
pe
density Kg/m
3
7650
h
pe
thickness
m 0.0002
d
31
Expansion constant m/V -0.000000000166
Tab. 2. PZT patch’s properties.
Robotics and Automation in Construction
238
Mode FREQUENCY (HZ) Mode Frequency (Hz)
(1,1) 20.6 (2,2) 82.4
(1,2) 51.5 (2,3) 133.8
(1,3) 102.9 (3,3) 185.2
Tab. 3. Natural frequencies of vibration.
Fig. 9. Amplitude displacement along the y=l/2 axis due to the positioning of stack stiffened
actuators, normalized with respect to the maximum disturbance value.
Therefore, given the high controllability provided by stack actuators, they have been
considered suitable for controlling glazed facades and they have been object of the
experimental campaign and technologic development carried out in this research.
5. The case study: An Active Structural Acoustic control for a window pane
5.1 The components of ASAC System for glazed facades
In paragraph 4.2 the two basic arrangements for an ASAC system configuration have been
introduced, that are feed-forward and feed-back types. As already discussed, the first one
requires the knowledge of the primary disturbance, which implies the use of a reference
microphone. This solution seems to be unpractical for the suggested application, requiring
the installation of a microphone on the exterior of the window, unfeasible for functional and
aesthetical issues. Hence, the feedback arrangement is preferred by the authors and detailed
in the following pages.
The components of a feedback ASAC system for glazed facades are (Fig. 10):
-
sensors for detecting vibration (e.g. strain gauges);
-
electronic filters for analyzing signals from sensors in order to check the vibration field
induced by disturbance;
-
an electronic controller for manipulating signals from the sensors and compute the most
efficient control configuration at the actuators level;
-
charge amplifiers for driving secondary actuators on glazed panels according to the
outputs sent by the controller;
-
actuators for controlling the vibration field of glazed panels.
As seen in paragraph 4.3 two different kinds of actuators are available, patch and stack
actuators. For building applications, feasibility and aesthetical considerations suggest that
stack actuators are preferred, as their smaller size interferes less with visibility and
transparency and allow them to be easily mounted and dismantled from glass surface.
An Active Technology for Improving the Sound Transmission Loss of Glazed Facades
239
Fig. 10. Layout of the ASAC control system for glazed facades
5.2 The functioning of ASAC System for glazed facades
Signal coming from the sensors is elaborated by charge amplifiers, that convert voltage
signals into physical variables like displacements, velocity and accelerations, and by
electronic filters, that separate the total vibration field into one due to the primary
disturbance from the other connected with the action of secondary sources. The electronic
controller, starting from the error signal, estimates the radiated field in some positions of the
receiving room and then computes the opportune voltage to be supplied to the actuators in
order to reduce the panel’s acoustic efficiency. Signal amplifiers provide for necessary
electric power.
The optimization of the actuator’s actions, in order to minimize the number and the size of
the employed sensors and actuators, is derived from opportune algorithms implemented in
the controller, like the one presented in (Clark & Fuller, 1992), based on the quadratic linear
optimum control theory (see paragraph 4.2). It consists of two parts, the first dedicated to
the determination of actuator size and location and the second to sensors. In both parts, the
core algorithm computes the voltage to be supplied to the actuators in order to reduce glass
vibrations, while the rest of the procedure defines the best actuators’ configuration, upon
determination of constraints relative to plate’s geometry and design choices.
5.3 The technological solution developed as test-case
Stack actuators, as compared to laminated actuators, need a stiffener in order to work
properly, hence a technological solution to realize this stiffener has to be designed. The
presence of the stiffener, according to its position on the glass surface, may also determine
interference problems with the aesthetical appearance of the glass panel which cannot be
disregarded. First of all, in order to minimize the radiation efficiency of the vibrating glass
surface, the correct positioning of stack actuators has to be studied. Two are the possible
ways:
Robotics and Automation in Construction
240
- by decreasing the vibration amplitude of flexural waves (Fig. 11-a);
-
By changing the original vibration in order to obtain a vibration field where only even
modes dominate (Fig. 11-b).
a)
b)
Fig. 11. Reduction of the overall acoustic radiation efficiency
In the first case actuators should act in order to reduce vibration amplitudes, while in the
second one they should generate a vibration field with less radiation efficiency. To each of
the alternatives listed corresponds a different positioning of actuators: in the first case they
have to be installed in the points where maximum vibration amplitudes are monitored,
while, in the second one, they have to be moved along the border lines, with less
interference in glass panel’s appearance. Starting from these considerations, in Fig. 12 three
possible technological solutions are depicted (Naticchia and Carbonari, 2007):
a.
stack actuators positioned close to the central axis, usually characterized by maximum
amplitude vibrations, and stiffened by a metal profile (approach 1);
b.
stack actuators installed along one border of the panel and stiffened by an angular
profile (approach 2);
c.
stack actuators placed close to the borders and stiffened with point reaction systems
(approach 3).
a)
b)
c)
Fig. 12. Technologic solutions suggested for the installation of actuators.
Further proposals for technological solutions have been advanced, where the actuator is
contrasted by a point reaction system directly attached to the glass panel’s surface. For this
purpose, the use of two different kinds of metallic profiles have been hypothesized: in Fig.
13-a a circular-shaped profile contrasting a stack actuator is depicted in a 3-D view and a
An Active Technology for Improving the Sound Transmission Loss of Glazed Facades
241
cross-section view, while Fig. 13-b represents a similar solution realized with a z-shaped
profile. Both hypotheses seem to be advantageous from an aesthetical point of view,
showing little interference with visibility through the glass, and should be studied relative
to profile characteristics and to the stress induced in correspondence of the connection point
between the same profile and the glass panel.
a-1: 3D view
a-2: Section
b)
Fig. 13. Further hypotheses of point reaction systems: circular-shaped profile (a-1;a-2); Z-
shaped profile (b).
For the acoustic simulations carried out and discussed in this chapter, in order to evaluate
the effectiveness of the purposed technology over the limits imposed by the choice of one
solution with respect to another, an experimental solution has been developed, employing a
stack actuator, stiffened by a mass, realized with a cylinder of metallic material overlapped
and connected to the free extreme of the actuator, as will be detailed in paragraph 6.2.
6. Experimental analysis
In the following paragraphs, the results of experimental and numerical analyses carried out
to evaluate acoustic improvements deriving from the application of the suggested active
control technology will be presented (Carbonari and Spadoni, 2007). For this purpose, a
finite element model and an experimental prototype were built: in both models the stiffener
has been simulated with a 0.177
Kg weighted mass contrasting the free extreme of the
actuator (Fig. 15-e and 15-f).
6.1 The building of the experimental prototype
Experimental simulations were performed on a prototype, realized by assembling a
(1.00x1.40)
m sized glazed pane with an aluminium profile frame. The main problem
regarding the realization of the prototype was the simulation of a simply supporting
boundary constraint: it was pursued with the interposition of two cylindrical Teflon bars
between the glass panel and the two window frame profiles, as can be seen in Fig. 14-a.
Every screw fixing the glass panel in the window frame was subjected to the same torque
(through the use of a dynamometric spanner) equal to 0.1
N·m, in order to guarantee
uniform contact between the glass and the Teflon bars. The whole system, as shown in
Figure 14-b, was placed over dumping supports in correspondence of each panel edge, to
avoid the influence of external actions on the glass’s vibrations, establishing the simplest
boundary conditions. A seventy-seven point grid was defined on the panel, in order to
identify measurement marks.
Robotics and Automation in Construction
242
6.2 The modal analysis performed on the prototype
The purpose of the experimental analysis is to collect data in order to evaluate the reliability
of the finite element model, on which the acoustic simulations will be performed. First of all,
a modal analysis was carried out on the prototype in order to determine its natural
frequencies. The experimental apparatus employed for the measurements consisted in:
-
a transducer for exciting the system (Fig. 15-a);
-
an accelerometer for checking the vibration field (Fig. 15-b);
-
a PXI platform for collecting data (Fig. 15-c).
National Instruments PXI is a rugged PC-based platform for measurements and automation
systems, provided by the Mechanical Measurement Laboratory of the Polytechnic
University of Marche (Castellini, Revel, Tommasini, 1998; Castellini, Paone, Tommasini,
1996), whose staff contributed to these experimental tests. PXI is a deployment platform,
serving applications like manufacturing test, aerospace and military, machine monitoring,
automotive and industrial tests. It is composed of three basic components: chassis, system
controller and peripheral modules. PXI can be remotely controlled by PC or laptop
computers, but it can also provide for embedded controllers, which eliminates the need for
an external controller. In the case of the performed tests, the PXI was connected to a PC
monitor in order to display the data collected from measurements on the experimental
prototype used to perform its two modal analyses (see Fig. 17-b).
Experimental tests were carried out in the Advanced Robotics Laboratory of the Department
of Software, Management and Automation Engineering-DIIGA (“Dipartimento di
Ingegneria Informatica, Gestionale e dell’Automazione”) of the Polytechnic University of
Marche (Antonini, Ippoliti, Longhi, 2006; Armesto, Ippoliti, Longhi, Tornero, 2008), which is
equipped with:
-
one Wave Generator Hameg Instruments mod. Hm 8030-3 (see paragraph 6.3);
-
one Tektronix TDS 220 oscilloscope;
-
one National Instruments acquisition card mod. NI USB6009 (see paragraph 6.3).
a)
b)
c)
Fig. 14. The prototype used to realize simply supporting constrains (a), the window frame
prototype on the dumping supports (b), Seventy-seven point grid marked on the glazed
pane (c).
Modal analysis was first performed on the prototype as depicted in Fig. 14-b, that is on the
prototype without any control system component in order to evaluate its natural
frequencies. Subsequently, the same tests were repeated on the prototype equipped with the
Device Kit, consisting in:
-
one actuator acting as control system (in this first stage of the tests, the actuator was
inactive to study the system’s free vibration);
-
one load cell for recording the values of the forces provided by the actuator;
An Active Technology for Improving the Sound Transmission Loss of Glazed Facades
243
- one stiffening mass for simulating the presence of the stiffener (total weight of the stack
actuator device kit was 0.177
Kg).
The elements were assembled as shown in Fig. 15-e and 15-f: the stack actuator device kit
was positioned along the main axis of the prototype, at a distance of 0.24 m from the edge
and fixed to the glass panel with resin. Measurements were carried out keeping the position
of the accelerometer unchanged and exciting each one of the seventy-seven grid point with
the transducer. The data collected were processed with appropriate software in order to
restore the glass panel’s modal forms.
From the comparison of the natural frequencies recorded for the two, different, tested
systems, summarized in Tab. 4, a maximum percentage error greater than 10% was checked,
so that it had been possible to conclude that the presence of the Device Kit, with its volume
and its total weight of 0.177
Kg, can not be omitted for the development of a correct finite
element model.
m,n MODES 1.1 2.1 1.2 3.1 2.2 3.2 4.1 1.3
Prototype + Dev. Kit(Hz) 25.5 47 66.5 85 89 116.5 133.5 141
Not Controlled Prototype
(Hz)
25.50 47.50 67.00 85.50 89.00 129.50 134.50 141
ABS. ERROR % 0.00 1.05 0.75 0.58 0.00 10.04 0.74 0.00
Tab. 4. Comparison between natural frequencies values in the case of non controlled glass
panel and of the glass panel with the stack actuator device kit
a) b) c)
d) e) f)
Fig. 15. Transducer (a), accelerometer B&K with its amplifier (b), PXI platform (c), modal
analysis processing software (d), the stack actuator device kit (e,f).
Robotics and Automation in Construction
244
6.3 The harmonic analysis performed on the prototype
In the second stage of the experimental measurements, harmonic analyses were performed
on the prototype, in order to determine the structural response of a window pane, when
excited by harmonic force. For this purpose, two frequencies were selected, 81 Hz and 142
Hz, which are very close to the panel’s natural frequencies, previously defined for modes
(3,1) and (1,3). This choice was influenced by the two following considerations:
-
maximum structural response is recorded when a system is excited close to its natural
frequencies;
-
for the assumed control theory, maximum efficiency is obtained controlling modes with
the maximum acoustic efficiency. From previous studies (Naticchia and Carbonari,
2006), it is possible to establish that they are coincident with the glass panel’s natural
frequencies, with particular reference to (3,1) and (1,3) modes.
For experimental measurements the same apparatus described in paragraph 6.2 was
employed, with exception of PXI platform, replaced by the National Instruments
Acquisition Card depicted in Fig. 16-a.
a)
b)
c)
Fig. 16. National Instruments acquisition card mod. NI USB6009 (a), Wave Generator
Hameg Instruments mod. Hm 8030-3 (b) and E-610.00 PI amplifier employed for
experimental measures (c).
a)
b)
Fig. 17. Functioning scheme of the performed tests (a), Experimental apparatus installed in
the Advanced Robotics Laboratory of DIIGA of the Polytechnic University of Marche (b).
Differently from the modal analysis, the harmonic analyses were directly performed on the
prototype equipped with the Device Kit. The test functioning scheme is represented in Fig.
An Active Technology for Improving the Sound Transmission Loss of Glazed Facades
245
17-a: harmonic signals exciting the prototype were generated by an analogue Wave
Generator (Fig. 16-b) and sent to the Device Kit, passing through the amplifier depicted in
Fig. 16-c. The measurements were carried out moving the accelerometer from one point to
another of the seventy-seven point grid defined on the glass panel; signals coming from the
accelerometer were collected with NI acquisition card and elaborated, with the application
of opportune filtering executed using appropriate software. Applying the harmonic motion
equation:
()
2
max
max
f2
a
W
π
= (19)
at every point it was possible to compute displacements along the main axis and along the
axis passing through the actuator: displacements diagrams are represented in paragraph 7.3,
where they will be used to validate the finite element model.
7. Numeric analysis
7.1 The modal and harmonic analyses performed on the finite element model
The finite element theory was employed for building the numerical model of a window
subject to acoustic simulations for the evaluation of the real effectiveness of the technology
suggested.
The same characteristics of the experimental prototype, in terms of geometry, material
properties and boundary conditions, were reproduced in the finite element model. To this
purpose, two different models were implemented in ANSYS 8.0
TM
environment: the first
one represents a rectangular (1.40 x 1.00)
m large glass plate, simply supported along the
whole board (Fig. 18-a). In order to reach a high accuracy level, the plate was subdivided
into square shaped finite elements of 0.02
m per side. The following parameters for glass
material were inputted:
-
elasticity Modulus E= 6.9 x 10
10
Pa;
-
Poisson Coefficient ν=0.23;
-
density ρ=2457 Kg/m³.
The second model was realized, adding to the first a (0.02x0.02x0.02)
m sized parallelepiped
volume to simulate the Device Kit (Fig. 18-b). In the positioning of the volume on the glass
plate the same conditions as the experimental tests were respected and steel-like
characteristics were assigned to it:
-
elasticity Modulus E= 2.1·10
5
MPa;
-
Poisson Coefficient ν=0.33;
-
density ρ=22158 Kg/m³ (density value was computed according to the real weight of
the Device Kit).
The nomenclature of the glass natural modes was chosen according to the number of
troughs along the major and secondary axes of the plate respectively.
Modal analyses were performed on both models and the results were compared, confirming
that the presence of the Device Kit cannot be neglected when realizing a proper finite
element model: in fact, the comparison of the model forms revealed deviation between the
two models, increasing for frequencies higher than 100 Hz. Diagrams and natural
frequencies values recorded for the Device Kit equipped model are represented in Fig. 19.
Robotics and Automation in Construction
246
a)
b)
Fig. 18. Finite elements model of the glass panel (a), Finite elements model of the glass
panel with the Device Kit (b).
According to the results of the modal analysis, harmonic analysis was performed
exclusively on the Device Kit equipped pane model. To this aim a point force was applied
on the Device Kit volume, with an intensity of 0.17
N (the same value recorded by the load
cell during experimental tests) at the two different frequencies of 81 Hz and 142 Hz. Results
will be discussed in the following paragraph.
Fig. 19. Modal shapes and the corresponding natural frequencies of the Device Kit equipped
model.
7.3 The validation of the finite element model
Reliability of the finite element model was demonstrated through the comparison between
the experimental and the numerical results. First of all, the results of the modal analysis
were compared, revealing a good agreement between the values of natural frequencies for
the experimental and the finite elements model: actually, a maximum percentage error of 3%
was recorded.
Device Kit
An Active Technology for Improving the Sound Transmission Loss of Glazed Facades
247
Subsequently, diagrams relative to displacements recorded for the numerical and
experimental model, due to the harmonic analysis at 81 and 142 Hz were superimposed, as
represented in Fig. 20.
It can be noticed that there is a good superposition between the two models: in fact a
maximum percentage difference of about 4,5% at 81 Hz frequency and of about 15% at 141
Hz frequency were registered, with an average difference of about 10%. According to these
acceptable deviations, also ascribable to local effects not contemplated by the numerical
model, it was considered reliable and was used for performing the acoustic simulations.
Fig. 20. Comparison between displacements diagrams for experimental and numerical
harmonic analysis.
7.4 The evaluation of sound transmission loss improvements due to the ASAC
system
For an acoustic evaluation of the suggested technology, the finite element model, developed
in ANSYS 8.0
TM
environment, was imported in LMS VIRTUAL LAB
TM
environment which
is another finite element software, containing two dedicated sections named
noise and
vibration
and acoustics (the first section was used to perform modal analysis and the second
for the acoustic evaluations). Simulations were carried out in order to have numerical results
concerning the real effectiveness of the suggested ASAC control system.
It is well-known that one of the most recurring and irritating noise sources is represented by
urban traffic, especially connected with heavy vehicles, such as lorries. A research have
demonstrated that a lorry, travelling a low distance and at a speed of 70 Km/h produces a
noise level equal to 85 dB (Fig. 2), within a range of frequencies in which the dominant one
can be identified at 140 Hz, corresponding to the glass panel’s natural vibration mode (1,3).
According to these assumptions, a test room measuring (2.40x2.50x2.80)
m was developed
for simulations, including within one of the walls, the validated glass panel (please refer to
Fig. 21-a).
In previous research activities simulations have been led to evaluate achievable noise level
reduction by the application of the ASAC technique, without considering the influence
ascribable to the presence of a stiffener or a stiffening mass for the correct functioning of the
Robotics and Automation in Construction
248
actuator. In the above case, a reduction of about 15 dB in the disturbance pressure noise was
estimated (Naticchia & Carbonari, 2006). Results of simulations presented in this paragraph
instead, can be considered more realistic, as it also takes into account the presence of the
stiffener. The developed test room was analyzed in two different configurations:
1.
anechoic room: every wall of the room was made up of totally absorbent panels;
2.
reverberant room: acoustic properties were associated to every wall of a typical building
material like plaster for the ceiling, wallpaper for vertical walls and carpet for the floor.
In both cases, the disturbing wave incident on the glazed panel was assimilated to a uniform
constant pressure on the panel equal to 0,3556 Pa, applied at the frequency of 140 Hz: this
condition seems to be realistic, considering the distance that usually separates the windows
of a building from the street, source of the noise. The acoustic pressure level within the room
was evaluated for the following conditions:
1.
acting disturbance;
2.
acting actuator;
3.
simultaneous acting of disturbance and actuator.
The results of the simulations are represented in Fig. 21-b with coloured diagrams relative to
the anechoic room and to the reverberant room, with reference to the acoustic pressure
recorded on the walls of the room with and without the application of the proposed ASAC
system: the numerical values of the recorded pressure levels for both cases are synthesized
in Tab. 5.
a)
b)
Fig. 21. The test room model used for the acoustic simulations in LMS
TM
environment (a),
diagrams of the noise level recorded in the anechoic room (left side) and in a real room
(right side) with and without the application of ASAC system(b).
According to these results, the first observation that can be derived is that, even if the
reduction achievable in the disturbance pressure level is greater in the case of the anechoic
room than it is in the reverberant room, as would be expected, nevertheless in the real case,
there is a sensitive drop of about 10 dB in the noise level transmitted within the room.
Besides this, it can be stated that the presence of the stiffener cannot be omitted for a real
acoustic evaluation of the technology suggested.
An Active Technology for Improving the Sound Transmission Loss of Glazed Facades
249
Average interior noise level recorded with the acoustic simulations (dB)
Reverberant Room Anechoic Room
Disturbance (0,3556 Pa;140Hz) 76,7 61,6
Disturbance + Acting Actuator 67,4 49,4
Maximum recorded decrease 9,3 12,2
Tab. 5. Final results of the acoustic simulations performed in LMS Virtual Lab
TM
environment
8. Conclusions
In these pages it was demonstrated that the Active Structural Acoustic Control can be
successfully applied in the building field, in order to provide a major improvement in glass
panels’ sound transmission loss in the low frequencies range: the employment of just one
actuator causes a sensitive drop in the noise transmitted from the exterior to the interior,
allowing the achievement of the restrictive requirements imposed by European and Italian
standards. At the same time, initial considerations were presented in order to investigate
the feasibility of a technological solution based on the active control of vibrations.
In order to prepare this technology for use in buildings, further efforts should be directed to
facing the following two different aspects:
1.
experiments using more than one actuator, to control some of the most efficient modes
should be carried out, in order to determine the effects due to the interaction of
different actuators and then to evaluate the final noise drop transmitted from the
exterior to the interior;
2.
simulations and laboratory experiments should be directed to develop a technological
solution allowing the proper integration of the Active Structural Acoustic Control
system with a glazed panel’s structural frame.
In addition, the same technique could be adopted for applications on other specialized
products such as light opaque building partition walls, railway and traffic noise shielding,
temporary environmental noise barriers or even real-time controlled reflecting panels for the
acoustic adjustment of concert halls
9. References
Antonini, P., Ippoliti, G., Longhi, S., (2006), Learning control of mobile robots using a
multiprocessor system,
Control Engineering Practice, vol. 14, pp. 1279-1295, ISSN:
0967-0661.
Armesto, L., Ippoliti , G., Longhi, S., Tornero, J., (In press June 2008), An asynchronous
multi-rate approach to probabilistic self-localisation and mapping.
Ieee Robotics And
Automation Magazine
. ISSN: 1070-9932.
Robotics and Automation in Construction
250
Bao, C. and Pan, J., (1997), Experimental study of different approaches for active control of
sound transmission through double walls,
Journal of the Acoustical Society of America,
vol. 102(3), pp. 1664-1670.
Baumann, W. T., Ho, F. S., Robertshaw, H. H., (1992), Active structural acoustic control of
broadband disturbances,
Journal of the Acoustic Society of America, 92(4).
Baumann, W. T., Saunders, W. R., Robertshaw, H. H., (1991), Active suppression of acoustic
radiation from impulsively excited structures,
Journal of the Acoustic Society of
America
, 90(6).
Burdisso, R.A. and Fuller, C.R., (1994), Design of active structural acoustic control systems
by eigenproperty assignment,
Journal of the Acoustical Society of America, Vol. 96, No.
3, pp. 1582-1591.
Carbonari, A. and Spadoni, S., (2007), An Active technology to increase sound transmission
loss of glazed facades,
Proceedings of ARTEC Conference “The Building Envelope – a
complex design”
, pp. 199-206, ISBN 978-88-6055-223-5, Ancona, November 2007,
Alinea, Firenze
Castellini, P., Paone, N., Tomasini, E. P., (1996), The Laser Doppler Vibrometer as an
Instrument for Non-intrusive Diagnostic of Works of Art: Application to Fresco
Paintings,
Optics and Lasers in Engineering, Vol. 25, pp. 227-246, Elsevier Science
Ltd., Northern-Ireland.
Castellini, P., Revel, G. M., Tomasini, E.P., (1998), Laser Doppler Vibrometry: a Review of
Advances and Applications,
The Shock and Vibration Digest, vol. 30(6), pp. 443-456,
Sage Science Press, Thousand-Oaks, CA
Chaplin, G.B.B. and Smith, R.A., (1976), Active Methods of Cancelling Repetitive Vibrations,
U.K. Patent 1,971,7176.
Clark, R.L. and Fuller, C.R., (1992), Optimal placement of piezoelectric actuators and
polyvinylidene fluoride error sensors in active structural acoustic control
approaches,
Journal of the Acoustical Society of America, Vol. 92, No. 3, pp. 1521-
1533.
Clark, R.L., Fuller, C.R., Wicks, A., (1991), Characterization of multiple piezoelectric
actuators for structural excitation,
Journal of the Acoustical Society of America, Vol. 90,
No. 1, pp. 346-357.
Conover, W.B., (1955), Recent contributions to transformer audible noise control,
AIEE
Transactions, Applications and Industry
, Vol. 74, Part D, pp. 77-86.
Cunnefare, K. A., (1991), The minimum multimodal radiation efficiency of baffled finite
beams,
Journal of the Acoustic Society of America, 90(5).
Dimitriadis, E.K., Fuller, C. R., Rogers, C.A., (1991), Piezoelectric actuators for distributed
vibration excitation of thin plates,
American Society of Mechanical Engineers Journal of
Vibration and Acoustics
, 113, pp. 100-107.
Fahy, F., (1985),
Sound and structural vibration – radiation, transmission and response, Academic
Press, London - New York – Boston – Sydney – Tokyo – Toronto, par. 4.3.
Fuller, C. R., Elliott, S. J., Nelson, P. A., (1997),
Active Control of Vibration, 2nd Edition,
Academic Press, San Diego-London- Boston-New York, par. 2.10 – 8.4 – 8.5.
An Active Technology for Improving the Sound Transmission Loss of Glazed Facades
251
Hall, D. E., (1987), Basic Acoustics, John Wiley and sons, New York – Chichester – Brisbane –
Toronto – Singapore, pp. 122-124.
Harris, C.M., (1984),
Handbook of Acoustical Measurements and Noise Control, 3rd edition,
McGraw Hill, New York.
Harris, C.M., (1994)
Noise Control in buildings, McGraw Hill ed., New York.
IMAGINE, (2003), EC Project funded Technical Report WP 1.1: “Source modeling of road
vehicles” , IMAGINE -
Improved Methods for Assessment of the Generic Impact of Noise
in the Environment.
Kido, K., (1975), Reduction of Noise by use of Additional Sound Sources,
Proceedings of Inter-
Noise 75
, Sendai, Japan, pp. 647-650.
Kaiser, O. E., Pietrzko, S. J., Morari, M., (2003), Feedback control of sound transmission
through a double glazed window,
Journal of Sound and Vibration, vol. 263, pp. 775-
795.
Lueg, P., (1936), Process of silencing sound oscillations,
US Patent No. 2,043,416.
Meirovitch, L., Baruh, H. Öz, H., (1983), A comparison of control techniques for large
flexible systems,
Journal of Guidance, Control, and Dynamics, 6(4), 302-310.
Naticchia, B. and Carbonari, A., (2007): Feasibility analysis of an active technology to
improve acoustic comfort in buildings,
Building and Environment, Vol. 42, Issue 7,pp
2785-2796.
Naticchia, B. and Carbonari, A., (2006), First numerical and experimental results on active
controlled glazed facades,
Proceedings of the 23
rd
ISARC Conference, ISBN:4-9902717-
1-8, Tokyo, October 2006
Nelson, P. A. and Elliott, S. J., (1995),
Active Control of Sound, Academic Press Limited,
London. 3rd printing.
Olson, H.L., and May, E.G., (1953), Electronic sound absorber
, Journal of the Acoustical Society
of America
, Vol. 25, No. 6, pp. 1130-1136.
Pan, J., Snyder, S. D., Hansen, C. H., Fuller, C., R., (1992), Active control of far-field sound
radiated by a rectangular panel – A general analysis,
Journal of the Acoustic Society of
America
, 91(4).
Roussos L. A., (1985),
Noise transmission loss of a rectangular plate in an infinite baffle, NASA,
TR 2398, Washington, DC.
Ruckman, C. E. and Fuller, C. R. (1995), Optimizing actuator locations in active noise control
systems using subset selection
, Journal of Sound and Vibration, 186(3), 395 - 406.
Spagnolo, R. (2001),
Manuale di acustica, UTET Libreria editions.
Timoshenko, S, Woinolowsky-Krieger,
Theory Of Plates And Shells, Mcgraw-Hill, 1959
Wang, B., Burdisso, R.A., and Fuller, C.R., (1994), Optimal placement of piezoelectric
actuators for active structural acoustic control,
Journal of Intelligent Material Systems
and Structures
, Vol. 5, Jan., pp. 67-77.
Yang, D., and Fuller, C.R., (1995), Numerical simulation of active control of interior noise in
a business jet with point force actuators - optimization of transducers,
Proceedings
of Inter-noise 95
.
Robotics and Automation in Construction
252
Zhu, H., Rajamani, R., Stelson, K. A., (2004), Active control of glass panels for reduction of
sound transmission through windows,
Mechatronics, vol. 14, pp. 805-819.
16
Development of Adaptive Construction
Structure by Variable Geometry Truss
Fumihiro Inoue
Technical Research Institute, Obayashi Corporation
Japan
1. Introduction
Recent years have seen an increasing variety of attractive structures and building with
movable functions worldwide (Ishii, 1995). Typical examples are bridges that open to allow
ships to pass, revolving restaurants on tops of buildings, sliding roofs of baseball and soccer
dome stadiums, and artistic monuments. When we focus on the moving behaviour of these
structures, they simply move on rails or turn around a hinge, but do not change in structural
shape. That is, their behaviours are not flexible, but monotonous according to a decided
patern. However, in the near future, it may become possible to devise structures with a
lively motion, freedom as well as intelligence. In particular, they will respond to voice
commands with instant and adaptive shape change harmonising with their environment.
One mechanism that enables more complicated movement is the Variable Geometry Truss,
we call VGT in the chapter. The VGT is a very simple truss structure composed of
extendable members, fixed members and hinges, as shown in Fig.1. By controlling the
lengths of the extendable members, it is possible to create various truss shapes. The VGT
was originally developed as a movable actuator for a spread-type universe construction in
space, and it was equipped with a small motor to perform various tasks (Natori & Miura,
1994). Thus, it is considered to be a useful structural tool in various fields as a redundant
intelligent structure.
Fig. 1. Basic Mechanism of VGT and Its Shape Change
An example of the shape changes of a simple beam that combines two-dimensional VGTs is
shown in Fig.2. When extendable members are extended simultaneously, the truss beam
changes like a spring stretching from (a) to (b). When extendable members are extended
Robotics and Automation in Construction
254
alternately, the truss beam changes to a circular shape (c). Moreover, when they are
extended optionally and their lengths are controlled, the truss beam can be changed into any
intended shape (d). Based on the shape change of such a basic beam, the feasibility of the
shape change in an actual building is examined.
Fig. 2. Transformation of Beam Shape Using VGT
The purpose of this study was to apply VGT tevhnology to ground construction structure
and to examine the development of the element technique and its applicability to moveable
structures and building by numerical and experimental analysis. In this chapter, the basic
characteristics and anlysis of VGT mechanism and two practical examples of adaptive
construction structure using VGT are introduced. One example is a unique proposition of
the elementary design of a semi-empirical dome with an adaptive roof (Inoue &Kurita,
2003), and the other is a new develpment of a cantilever-type movable monument exhibited
at the 2005 International Expo in Aichi Japan (Inoue & Kurita, 2006). From thses examples,
the attraction and efficiency of VGT mechanism are varified in details.
2. Characteristics and analysis of VGT mechanism
2.1 Shape analysis of VGT mechanism
In the shape analysis of a VGT mechanism, direct kinematics and inverse kinematics
analyses are generally used. For the former, the shape is solved by kinematics analysis, and
for the latter; numerical analysis is needed because the shape creates a very highly
redundant structure.
2.1.1 Direct motion analysis
The structural units of the two-dimensional VGTs and the whole structure are shown in Fig
3. Each VGT unit is composed of two sets of fixed member and extensible actuators. Then,
the whole of the structure can replace a robot manipulator combining two fixed members in
series. The tip of the x, y co-ordinates of the structure combined with n (n > 2) VGT sets is
Development of Adaptive Construction Structure by Variable Geometry Truss
255
given by equations (1) and (2) using each hinge angle θ
j
.The length of the extendable
member is easily found in giving θ
j
and the shape of structure can be uniquely fixed
(1)
(2)
Fig. 3. Two- dimensional VGT Unit and Analysis Model
2.1.2 Inverse motion analysis
It is quite difficult to control the extensible length of each VGT to change it to the intended
structural shape. In considering the temporal change of the whole of the structure, equation
(3) is obtained.
(3)
Where, J indicates the Jacobean Matrix (2 × n). In this case, an inverse matrix isn't
necessarily decided because J is not a regular system in n≠2. Here, it finds θ by numerical
simulation from q using the pseudoinvesre matrix J
#
shown by equation (4)
(4)
2.2 Dynamic analysis of VGT mechanism
To actually design a structure using VGTs, a motion dynamic analysis must be carried out.
This is the external force acting on the structure and the torque power for its shape change.
Robotics and Automation in Construction
256
In the analysis, a model replacing the VGT with a multi-joint manipulator and with a
onedimensional tree shape structure was proposed. Using Kane’s method and Lagrange’s
method, the final dynamical equation is as showing the equation (5).
(5)
where M is the inertia matrix, h(q, q) is the vector of q centrifugal force and Coriolis force, c(
q ) is the vector of external force as gravity and τ is the vector of driving torque. By solving
the equation (5), the motion of the whole structure can be described.
2.3 Typical structures changes using VGT mechanism
Two basic structures changes of the cantilecer type and arch type is introduced by numerical
simulation.
2.3.1 Cantilever structure
Cantilever structure is supported at a single position and a top of the structure is
unrestrained from external force. The movement of the structure is thought to be that of a
multi-joint robot arms. Fig.4 shows the shape changes of the cantilever structure solved by
inverse kinematics. Specifying a top position moving as vector q, the length of each
extensible member is found from equation (3) and the shape of the structure can be fixed at
any time. It is easy to create several shapes.
Fig. 4. Shape Change of Cantilever Structure Applying VGT Mechanism
2.3.2 Arch structure
In the arch structure, the two edges of the structure are supported at each hinge. It is very
difficult to determine the shape of the structure because these edges are absolutely suited at
the hinge position. Fig. 5-(a) shows the shape variations of the arch structure like a big wave
change with the lengths of upper side members fixed. In this case, by slightly changing the
length of a lower side member near the edge, the lengths of the lower side members are
Development of Adaptive Construction Structure by Variable Geometry Truss
257
respectively analyzed by numerical simulation to correspond to the end of the structure in
the hinge position. Similarly, Fig. 5-(b) shows volume changes with the extensible members
sat on both lower and upper sides. A variable shape structure could be simulated
numerically by inverse analysis, although both edges were fixed. In a simulation of volume
change, as the lengths of the upper and lower chord members were changed, a flexible
member was needed for external finishing (Inoue, 2007).
Fig. 5. Shape Change of Arch Structure Applying VGT Mechanism
2.4 Proposition of practical examples using VGT mechanism
The VGT can be used for stress control of a structure in addition to shape control. Thus, it
has a wide application. The following are some possible application examples:
1. Facility equipment and temporary structures with moving parts:
Variable-shaped work gondolas for building walls and flexible roofs in music halls to
suit stage contents.
2. Shape control of the structural dome described in paragraph 3 and the pavilion
changing the roof shape according to inner environment conditions.
3. Artistic moveable monuments equipped with artificial intelligence harmonizing with
the surrounding environment in paragraph 4.
4. Actuators that control the stress and vibration of structure.