Báo cáo y học: " Acid-base balance and hydration status following consumption of mineral-based alkaline bottled water" ppt
Bạn đang xem bản rút gọn của tài liệu. Xem và tải ngay bản đầy đủ của tài liệu tại đây (621.34 KB, 12 trang )
RESEARC H ARTIC LE Open Access
Acid-base balance and hydration status following
consumption of mineral-based alkaline bottled
water
Daniel P Heil
Abstract
Background: The present study sought to determine whether the consum ption of a mineral-rich alkalizing (AK)
bottled water could improve both acid-base balance and hydration status in young healthy adults under free-living
conditions. The AK water contains a naturally high mineral content along with Alka-PlexLiquid, a dissolved
supplement that increases the mineral content and gives the water an alkalizing pH of 10.0.
Methods: Thirty-eight subjects were matched by gender and self-reported physical activity (SRPA, hrs/week) and
then split into Control (12 women, 7 men; Mean +/- SD: 23 +/- 2 yrs; 7.2 +/- 3.6 hrs/week SRPA) and Experimental
(13 women, 6 men; 22 +/- 2 yrs; 6.4 +/ - 4.0 hrs/week SRPA) groups. The Control group consumed non-mineralized
placebo bottled water over a 4-week period while the Experimental group consumed the placebo water during
the 1st and 4th weeks and the AK water during the middle 2-week treatment period. Fingertip blood and 24-hour
urine samples were collected three times each week for subsequent measures of blood and urine osmolality and
pH, as well as total urine volume. Dependent variables were analyzed using multivariate repeated meas ures ANOVA
with post-hoc focused on evaluating changes over time within Control and Experimental groups (alpha = 0.05).
Results: There were no significant changes in any of the dependent variables for the Control group. The
Experimental group, however, showed significant increases in both the blood and urine pH (6.23 to 7.07 and 7.52
to 7.69, respectively), a decreased blood and increased urine osmolality, and a decreased urine output (2.51 to 2.05
L/day), all during the second wee k of the treatment period (P < 0.05). Further, these changes reversed for the
Experimental group once subjects switched to the placebo water during the 4th week.
Conclusions: Consumption of AK water was associated with improved acid-base balance (i.e., an alkalization of the
blood and urine) and hydration status when consumed under free-living conditions. In contrast, subjects who
consumed the placebo bottled water showed no changes over the same period of time. These results indicate
that the habitual consumption of AK water may be a valuable nutritional vector for influencing both acid-base
balance and hydration status in healthy adults.
Background
Acid-base equilibrium within the body is tightly main-
tained through the interaction of three complementary
mechanisms: Blood and tissue buffering systems (e.g.,
bicarbonate), the diffusion of carbon dioxide from the
blood to the lungs via respiration, and the excretion of
hydrogen ions from the blood to the u rine by the kid-
neys. At any given time, acid-ba se balance is collectively
influenced by cellular metabolism (e.g., ex ercise), dietary
intake, as well as disease states known to influence
either acid production (e.g., diabetic ketoacidosis) or
excretion (e.g., renal failure). Chronic low-grade meta-
bolic acidosis, a condition associated with “the Western
diet” (i.e., high dietary intake of cheese, meats, and pro-
cessed grains with relativel y low intake of fruits and
vegetables) has been linked with indicators of poor
health or health risk such as an increased association
with cardiometabolic risk factors [1], increased risk for
the development of osteoporosis [2], loss of lean body
Correspondence:
Movement Science/Human Performance Laboratory, Department of Health &
Human Development, H&PE Complex, Hoseaus Rm 121, Montana State
University, Bozeman, MT USA
Heil Journal of the International Society of Sports Nutrition 2010, 7:29
/>© 2010 Heil; licen see BioMed Central Ltd. This is an Open Access article distributed under the terms of the Creative Commons
Attribution License (http://c reativecommons.org/licenses/by/2.0), which p ermits unrestricted use, distribution, and reproduction in
any med ium, provided the original work is properly cited.
mass in older adults [3], as well an increased risk for
sudden death from myocardial infarction [4,5].
Given the evidence linking more acidic diets with
increased risk for the development of chronic disease
states, there is growing interest in using alkaline-based
dietary interventions to reverse these associations. Sev-
eral researchers have suggested, for instance, that
mineral waters, especially those with high concentra-
tions of calcium and bicarbonate, can impact acid-base
balance [6] and contribute to the prevention of bone
loss [7]. In fact, Burckhardt [7] has suggested that the
purposeful consumption of mineral water represe nts
one of the most practical means for increasing the nutri-
tional alkali load to the body.
Recently, a highly mineralized glacier water, bottled
together with a proprietary blend of mineral-based
ingredients called Alka-PlexLiquid™ (Akali®; Glacier
Water Compnay, LLC; Auburn, WA USA), was shown
to rehydrate cyclists faster following a dehydrating bout
of cycling exercise when compared with drinking non-
mineralized bottled water [8]. This supplemented
bot tled wat er (hereafter referred to as AK) not only has
a naturally high content of calcium, but the Alka-PlexLi-
quid™ supplement is purported to enhance both intracel-
lular and extracellular buffering capacity as well as
alkalizing the water to a pH of 10. This combination of
high calcium content, a buffering agent, and alkalization
maybefunctionallysimilartothemineralwaters
described by Burckhardt [7] which suggests that bottled
AK water could serve as a means for improving the
body’s nutritional alkali load with regular consumption.
Recently, i n fact, two studies have shown that the con-
sumption of alkalizing nutrition supplements can ha ve
significant alkalizing effects on the body’s acid-base bal-
ance using surrogate markers of urine and blood pH
[9,10]. It is possible that the regular consumption of AK
bottled water could have a similar influence on markers
of acid-base balance, though this premise has not yet
been evaluated in a controlled manner.
Given the previously demonstrated ability of AK water
to rehydrate faster following a dehydrating bout of exer-
cise, as well as the AK’s potential influence as a dietary
influence on acid-base balance, the present study was
undertaken to systematically evaluate changes in both
hydration and acid-base balance following chronic con-
sumption of AK water in young healthy adults. Specifi-
cally, it was hypothesized that urine and blood pH, both
common surrogate markers of whole body acid-base
balance [11], would systematically increase as a result of
daily consumption of the alkaline AK water. In addition,
it was also hypothesized that the same chronic con-
sumption of AK water could positively influence com-
mon markers of hydration status under free-living
conditions. Thus, the potential influence of AK water on
markers of both acid-base balance and hydration status
were evaluated under free-living conditions with conco-
mitant measures of both dietary intake and physical
activity habits measured as potential covariates.
Methods
Subjects
College-aged volunteers (18-30 years) were recruited to
participate in a multi-week evaluation involvi ng the
habitual consumption of bottled AK water under free-
living conditions. Subjects read and signed an informed
consent docume nt approved by the Montana State Uni-
versity (MSU) Institutio nal Review Bo ard (IRB) prior to
testing. Subjects also completed a Health History Ques-
tionnaire that was used to screen out those with known
chronic diseases or conditions known to influence acid
production or excretion by the body. A self-reported
physical activity (SRPA) questionnaire was administered
prior to data c ollection to d etermine habitual levels of
exercise, daily activities, or occupational-related activities
that were performed at a moderate intensity or higher (i.
e., ≥3 METS). Subjects were asked to maintain consis-
tent weekly behaviors with respect to physical activity
habits and dietary intake. In addition, subjects were
asked to avoid the consumption of nutrition supple-
ments with the exception of those that were take n on a
daily basis (e.g., daily multivitamin). Data collection and
sample processing, as well as subject meetings, all
occurred in the Movement Science/Human Performance
Lab on the MSU campus.
Research Design and General Procedures
Prior to beginning a 4-week Testing Phase, subjects par-
ticipated in a 3-day Pilot Phase during the preceding
week with all subjects moving through both phases
simultaneously. The 3-day Pilot Phase provided the
opportunity to familiarize subjects with the require-
ments for data collection including the collection of
bottled drinking water from the lab, the collection of
24-hour urine samples, the collection of early morning
fingertip blood samples, the monitoring of free-living
physical activity with a wrist-worn monitor, and the use
of a diet diary. T he goal of the Pilot Phase was to help
ensure that subjects had enough training to effectively
assist with their own data collection (e.g., 24-hour urine
collection) during the Testing Phase.
Beginning the following Monday, the Testing Phase
required four weeks of continuous data collection
(Table 1). All subjects were assigned to drink non-
mineralized bottled water (i.e., the placebo water) for
the first (pre-treatment period) and fourth weeks (post-
treatment period) of the Testing Phase to establish pr e
and post intervention baseline measures. For the second
and third weeks of the Testing Phase (treatment period),
Heil Journal of the International Society of Sports Nutrition 2010, 7:29
/>Page 2 of 12
however, the subject pool was split into two groups
matched for SRPA and gender: The Control and Experi-
mental groups. While the Control group continued to
drink the same placebo water during the treatment per-
iod, the Experiment al group drank the AK bottled
water. Only the lead investigator was aware of which
subjects were assigned to the Control and Experimental
groups until t he study’s completion (i.e. Blind, Placebo-
Controlled design).
The daily data collection schedule was identical for
each week of the Testing Phase (Table 2). Each day of
the work week (Monday - Friday), as well as one day of
the following weekend, subjects arrived at the lab early
in the morning (6:30-8:30 AM) to provide a fingertip
bloo d sample, or drop off their 24-hour urine collection
containers, or both. Subjects were given the option of
collecting their third weekly 24-hour urine sample on
either day of the weekend that best allowed for such
collection. This particul ar sch edule was chosen to allow
for the measurement of changes in both blood and
urine pH and osmolality as each week progressed, as
well as to accommodate the busy schedules of the stu-
dent-volunteers. Additionally, body height and mass
were measured in the lab while clothed but without
shoes, jackets, or watches and jewelry during the first
and fourth weeks of the Testing Phase to the nearest 0.1
cm and 0.1 kg using a Health-o-Meter beam scale (Con-
tinental Scale Corp., Bridgeview, IL)
The daily lab visits also provided the opportunity for
subjects to collect enough bottled water for their daily
drinking needs. The placebo and AK water was provided
to subjects in non-labeled water storage drums which
had been filled in advance by the investigator. Subjects
were individually assigned to draw their daily water
needs from an assigned drum into color-coded non-
labeled 1-liter plastic water storage bottles. Each subjec t
was given as many 1-liter bottles as necessary to keep
up with their daily water intake needs. Once emptied,
subjects returned their 1-liter bottles to the lab the next
day for refilling. The color-coding of these 1-liter bottles
allowed the investigator to verify that subjects were
drawing water from the correctly assigned water storage
drum.
Fingertip Blood and 24-Hour Urine Collections
Subjects collected three 24-hour urine samples each
week of the T esting Phase. A 24-hour sample was
defined as the first urination following the morning’s
first void and all additional voids until and including the
following morning’s first void. Subjects were provided as
many sterile 1- liter collection containers as needed for a
24-hour collection. Subjects were asked to store the
urine containers during the day in their home refrigera-
tor (approximately 4-8°C) until their r eturn to the lab
the next morning following the first void morning col-
lection. Once at the lab, each subject’ s labeled contain-
ers were emptied into a sterile oversized mixing
container and then measured for total urine volume
using a one liter graduated cylinder to the hundredth of
a liter. Prio r to discarding the 24-hour sample, two 1.5-
ml sterile sample vials were filled with urine and stored
within a freezer (-18°C) until such time that all the sam-
ples could be thawed for the measurement of pH and
osmolality. Each day’s collection of urine samples were
typically thawed within 48-72 hours following the initial
freezer storage. Sampl es were al lowed to t haw to room
temperature (23°C) prior to the measurement of both
pH and osmolality before returning to the freezer for
storage.
Finger tip blood samples were collected using standard
fingertip lancing and collection procedures into two
Table 1 Four-week Testing Phase timeline for the consumption of bottled waters by Control and Experimental groups
Week Treatment Period Control Group Water Consumed Experimental Group Water Consumed
1 Pre-Treatment Placebo Water Placebo Water
2 Treatment Placebo Water AK Water
3 Treatment Placebo Water AK Water
4 Post-Treatment Placebo Water Placebo Water
Note: Placebo water was Aquafina while AK water was Akali®.
Table 2 Weekly blood and urine collection and water pickup schedule during the 4-week Testing Phase
Scheduled Event Monday Tuesday Wednesday Thursday Friday Saturday/Sunday
Fingertip Blood M1 M2 M3
24-Hour Urine M1 M2 M3
Bottled Water Pickup AM Pickup AM Pickup AM Pickup AM Pickup AM Pickup AM Pickup
Note: M1-M3 refer to consecutive measurements #1 - #3 each week for both fingertip blood and 24-hour urine samples.
Heil Journal of the International Society of Sports Nutrition 2010, 7:29
/>Page 3 of 12
75 μl heparinized capillary tubes for an approximate col-
lection volume of 75-100 μls. The contents of both
capillary tubes were then emptied into a single 1.5-ml
sample vial, labeled, and then stored in a lab refrigerator
(4°C). The samples collected from each day were evalu-
ated for both pH and osmolality 6-10 hours later that
same day after warming to room temperature (23°C).
The combination of the heparinized capillary tubes and
refrigeration were sufficient to keep these small whole
blood samples from coagulating prior to pH and osmol-
ality measurements within the timeframe described.
7-Day Physical Activity (PA) Assessment
Due to the time-intensive nature of the PA monitoring
and diet diary analyses, the 7-day assessments were per-
formed a t otal of thre e times over the 4-week Testing
Phase instead of the entire four weeks. The first and
third 7-day recordings of b oth types of data occurred
Monday through Sunday for the entire pre- and post-
treatment periods, respectively, while the second
recordings occurred Wednesday through Tuesday in the
middle of the treatment period.
Habitual free-living PA was evaluated using accelero-
metry-based activity monitors, or AMs, worn on the
wrist using locking plastic wristbands (Wristband Speci-
alty Products, Deerfield Beach, FL USA). Once locked
onto the wrist with the wristband, the A M remained on
the wrist for seven consecutive days until it was
removed on t he morning of the eighth day. A total of
40 AMs, all of which were calibrated by t he manufac-
turer prior to testing, were randomly assigned to partici-
pants with participants us ing the same monitor for all
three measurement periods. These data were used to
determine the stability of the subjects’ habitual free-
living PA over the course of the Testing Phase.
The stability of dietary intake across the three mea-
surement periods was evaluated on the basis of 7-day
diet diaries. Subjects were pro vided a diet log book for
each weekly assessment that included a sample one-d ay
record, as well as figures illustrating common portion
sizes. Once completed, the diet records were entered
into Nutritionist Pro™ Diet Analysis software (Axxya
Systems, Stafford, TX USA) for an evaluation of average
daily macronutrient and micronutrient content, as well
as average daily caloric intake. These data were also
used to compute an estimate of the nutritionally-
induced acid load on the body from the average intake
of protein (Pro, g/day), phosphorus (P, mg/day), potas-
sium (K, mg/day), calcium (Ca, mg/day), and magne-
sium (Mg, mg/day) by computing the potential renal
acid load (PRAL) [12,13].
Finally, the diet diaries were also used to record self-
report water co nsumption (SRWC, L/day) for the pla-
cebo and AK bottled waters provided by the lab to the
nearest 0.1 liter. Bottled water consumption was
recorded and analyzed separately from the diet diary
analyses described above.
Bottled Water Tested
The AK water consumed by the Experimental group
(Akali®; Glacier Water Company, LLC; Auburn, WA
USA) contains several naturally occurring trace minerals
(silica, calcium, potassium, magnesium, selenium) in
amounts ranging from 0.1-23.0 mg/L. When compared
with public water sources, this mineral content is rela-
tively high, though it is not uncommon for unfiltered
glacier water melt. Indeed, AK water is one of several
product lines from the same company which has sole
bottling rights to the runoff from the Carbon Glacier on
Mt. Rainier, WA. In addition to the se natural minerals,
AK water also contains an unknown amount of Alka-
PlexLiquid™, a proprietary blend of mineral-based alka-
lizing agents said to be the active ingredient responsible
for the water’s unusually high pH of 10.0, as well as the
previously reported enhanced rate of absorption and
retention of water in the body [8].
The placebo water used for this study was Aquafina
(PepsiCo Inc., Purchase, NY USA), a bottled water
brand that is commonly available throughout the U.S.
The bottlers of Aquafina use numerous public water
sources across the U.S. and a trademarked purification
process called HydRO-7™ that is said to remove all mea-
sureable traces of any particles that can influence water
taste, including naturally occurring minerals. In fact,
according to the Aquafina label, this purification process
results in water that contains no significant minerals or
electrolytes whatsoever. Thus, this particular bottled
water is well suited to serve as a placebo for the present
study.
Both placebo and AK bottled waters were shipped
directly to the testing lab from their respective bottling
facilities in previously unopened bottles. The contents of
these bottles were emptied directly into the water sto-
rage drums used daily by the participating subjects as
described previously. Using freshly opened bottles of
water and the measurement procedures described
below, the placebo and AK waters were measured at
respective pH values of 7.0 and 10.0, while the osmolal-
ity for both waters was zero mOsm/kg. As a reference, a
sample of distilled water had a pH of 7.0 and osmolality
of zero mOsm/kg.
Instrumentation
Osmolality and pH
Each urine and fingertip blood sample was evaluated for
osmolality using the Model 3320 Micro-Osmometer
(Advanced Instruments, Inc., Norwood, MA USA) to
thenearestwholeunitinmOsm/kgH
2
0. The osm-
ometer was calibrated daily using standards of 50 to
Heil Journal of the International Society of Sports Nutrition 2010, 7:29
/>Page 4 of 12
2000 mOsm/kg as suggested by the manufacturer. In
addition, this p articular osmometer required only 20 μl
to provide a valid measurement, which includes the
measurements of whole blood, with an accuracy of ± 2
mOsm/kg within the 0-400 mOsm/kg range. The pH
for the same urine and fingertip blood samples were
determined using a Sentrol LanceFET pH Probe and
Argus hand-held ISFET Ph meter (Topac Inc., Cohasset,
MA USA). The pH probe had a range of 0-14 and a
reported accuracy of ± 0.01 units while requiring only
20 μl for a valid measurement. The pH probe was cali-
brated prior to each run of measurements using two-
point calibration routine with 4.0 and 7.0 pH standards
provided by the manufacturer.
Physical Activity Monitors (AMs) and Data Processing
Algorithm
The operating mechanism for the AM used for this
study (Actical Monitor; Mini Mitter Company, Inc.,
Bend, OR USA) will be described briefly since it has
been described in detail previously [14]. The AM is the
size of a small wristwatch (2.8 × 2.7 × 1.0 cm
3
), light
weight (0.017 kg), water resistant, utilizes a single “mul-
tidi rectional” accelerometer to quant ify motion, and has
over five weeks of continuous data storage capacity
using one-minute recording epochs. The raw AM data
are stored in units of cou nts/min where a count is pro-
portional to the magnitude and duration of accelerations
during the user-specified epoch. When activity monitor-
ing is complete, the raw AM data are downloaded to a
computer using an external reader unit and a serial port
connecti on as an ASCII formatted file. A custom Visual
Basic (Version 6.0) computer program then transforms
the minute-by-minute AM data into units of activity
energy expenditure (AEE, kcals/kg/min) u sing a pre-
viously validated 2R algorithm [14] and post-processing
methods [15,16] previously validated for wrist-worn
monitoring in adults. For the present study, AEE was
defined as the relative energy expenditure to perform a
task above resting metab olism. Each subject’s computed
AEE data were then summarized into a time-based
moderate-to-vigoro us PA variable by sum ming the cor-
responding one-minute epochs greater than or equal to
a moderate intensity cut point of 0.0310 kcals/kg/min
[14]. This c ut-point is the equivalent of the 3 MET cut
point commonly used to define the lower boundary of
moderate intensity i n adults [17] . This processing rou-
tine was repeat ed with each ASCII formatted AM file to
compute the 7-day average daily PA (mins/day) for each
of the three periods within the Testing Phase.
Statistical Analyses
Dependent variables for which there was only one value
per measurement period (daily PA, SRWC, and all of
the diet diary variables) were evaluated using two-factor
multivariate repeated measures ANOVA and planned
contrasts for post-hoc comparisons within the Control
and Experimental group means. Thus, the analytical
strategy was to identify changes in the dependent var i-
ables within the groups rather than between groups. All
other dependent variables (blood and urine osmolality
and pH, as well as 24-hour urine volume) were evalu-
ated with a simil ar two-factor multivaria te repeated
measures ANOVA model, but Dunnett’s test was used
for post-hoc comparisons within the Control and
Experimental group means. Dunnett’s test compares the
dependent variable means to a control, or reference
condition. In the current study, no one mea sure could
truly serve as a reference, so the mean of the pre-treat-
ment values for each subject and each dependent vari-
able was computed for use as this reference value. All
ANOVA and post-hoc tests were performed at the 0.05
alpha level.
Results
A total of 45 subjects were initially enrolled at the
beginning of the Pilot Phase, but only 40 remained by
the end the pre-treatment period of the Testing Phase.
Four of the five subjects who dropped out did so of
their own volition citing the time demand of the study,
while the fifth subject dropped out of school and moved
away from area. The remaining 40 subjects were evenly
matched by gender and SRPA before assignment into
the Control and Experimental groups. During third
week of the Testing Phase, a sixth subject from the
Control group dropped out due to unexpected out-of-
town travel. Finally, the data from a seventh subject in
the Experimental group was removed from the data
pool prior to data analyses due to lack of consistent
compliance with the study protocol. The demographic
summary statistics for the remaining 38 subjects are
provided in Table 3. Note that t he Control and Exp eri-
mental groups remained evenly balanced with 19 sub-
jects each and nearly equal in numbers of male and
female participants. While measures of body mass are
shown only for the pre-treatment period (Table 3),
these measures did not differ significantly from body
mass measured during the post-treatment period.
Daily PA, Water Consumption, and Diet Diaries
The Control and Experimental groups self-reported
drinking similar amounts of the placebo and treatment
water, respectively, provided by the study investigator
(Table 4). For example, self-reported water consumption
(SRWC) averaged 2.2-2.5 L/day for the Control group
across all three test periods, while the Experimental
group averaged 2.2-2.4 L/day. Daily PA, as determined
with the wrist-worn physical activity monitors, was high-
est during the pre-treatment phase for both Control
Heil Journal of the International Society of Sports Nutrition 2010, 7:29
/>Page 5 of 12
(Mean ± SE: 85 ± 8 mins/day) and Experimental (85 ± 6
mins/day)groups,andlowestforduringthetreatment
phase (78 ± 8 and 70 ± 8 mins/day, respectively). None
of the differences in SRWC or daily PA across test peri-
ods were significant within test groups (P > 0.20).
Results from the diet diaries were also evaluated for
changes in total caloric intake, macronutrient intake
(protein, fat, and carbohydrate), mineral content (phos-
phorus, potassium, calcium, magnesium, sodium), as
well as the number of food exchange equivalents for the
consumption of fruits, vegetables, meat, starches, fat,
and milk products. There were no significant changes
for any these variables for either Control or Ex perimen-
tal groups across the three test periods (P > 0.10). In
addition, the computation of average daily PRAL for the
Control group did not change significantly between pre-
treatment (20.5 ± 4.0 mEq/day), treatment (26.6 ± 6.4
mEq/day), and post-treatment (21.6 ± 5.0 mEq/day)
phases (P = 0.29). Similarly, PRAL computations for the
Experimental group did not change significantly across
the same test periods (22.3 ± 5.6, 20.0 ± 5.0, and 32.2 ±
15.0 mEq/day, respectively) (P = 0.66).
Blood and Urine Variables
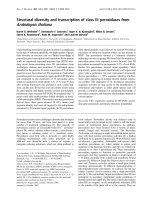
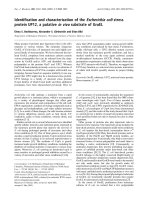
Daily urine output during the pre-treatment period
averaged (Mean ± SE) 2.16 ± 0.24 and 2.67 ± 0.29 L/day
for the Control and Experimental groups, respectivel y.
Each subject’ s 24-hour urine output values were
adjusted to change scores (i.e., 24-hour urine output
minus output for first measurement) and where plotted
in Figure 1. While urine output for the Co ntrol group
did not change significantly over the course of the
study, output for the Experimental group began decreas-
ing by the sixth and seventh measurements (i.e., end of
the first treatment week) with the last two treatment
period collections being significantly lower (-0.44 to
-0.46 L/day) than the reference value of zero L/day (P <
0.05).
Prior to the evaluation of osmolality and pH for the
urine samples, both Control and Experimental groups
Table 3 Summary of demographic data for study participants (Mean ± SD (Range))
Group Age (years) Body Height (cms) Body Mass (kg) †BMI (kg/m
2
) ‡SRPA (hrs/wk)
Control
Women
(n = 12)
23 ± 3
(19 - 26)
169.1 ± 8.0
(153.3 - 185.3)
68.5 ± 7.3
(56.5 - 79.7)
23.9 ± 1.9
(21.5 - 28.6)
6.7 ± 4.6
(0 - 15.0)
Men
(n = 7)
22 ± 1
(21 - 24)
182.2 ± 8.3
(175.3 - 199.6)
87.5 ± 7.5
(72.8 - 95.5)
26.4 ± 2.8
(22.7 - 31.1)
7.9 ± 2.7
(4.0 - 11.5)
Experimental
Women
(n = 13)
21 ± 2
(18 - 23)
168.3 ± 6.9
(161.0 - 182.2)
64.4 ± 8.8
(51.0 - 86.9)
22.7 ± 2.1
(19.3 - 26.5)
6.1 ±4.3
(0 - 15.0)
Men
(n = 6)
24 ± 3
(21 - 28)
178.5 ± 5.6
(172.6 - 186.5)
80.8 ± 7.1
(70.8 - 91.2)
25.4 ± 2.8
(21.5 - 28.3)
6.8 ± 3.5
(2.8 - 11.3)
† BMI (Body mass index) = [(body mass, kg)/(body height, m)
2
]
‡ SRPA = Self-reported physical activity in hours per week.
Table 4 Water consumption and physical activity for study participants reported as Mean ± SE (Range)
Group Pre-Treatment Period Treatment Period Post-Treatment Period
†SRWC (L/day) ‡Daily PA (mins/day) SRWC (L/day) Daily PA (mins/day) SRWC (L/day) Daily PA (mins/day)
Control
Women
(n = 12)
2.5 ± 0.2
(1.7 - 4.8)
82 ± 9
(20 - 153)
2.4 ± 0.3
(1.2 - 5.0)
77 ± 12
(16 - 173)
2.2 ± 0.2
(1.3 - 4.7)
83 ± 12
(27 - 156)
Men
(n = 7)
2.4 ± 0.4
(1.2 - 4.2)
92 ± 5
(78 - 109)
2.2 ± 0.4
(1.0 - 3.8)
82 ± 11
(60 - 135)
2.3 ± 0.5
(1.0 - 3.8)
74 ± 10
(45 - 106)
Entire Group
(n = 19)
2.5 ± 0.2
(1.2 - 4.8)
85 ± 8
(20 - 153)
2.4 ± 0.3
(1.0 - 5.0)
78 ± 8
(16 - 173)
2.2 ± 0.3
(1.0 - 4.7)
80 ± 8
(27 - 156)
Experimental
Women
(n = 13)
2.0 ± 0.2
(1.0 - 4.1)
74 ± 9
(12 - 128)
1.9 ± 0.2
(1.0 - 4.0)
58 ± 6
(29 - 93)
1.7 ± 0.2
(1.0 - 3.0)
74 ± 10
(40 - 166)
Men
(n = 6)
3.1 ± 0.2
(2.1 - 4.0)
105 ± 15
(41 - 170)
2.8 ± 0.5
(1.1 - 5.8)
91 ± 15
(15 - 127)
3.4 ± 0.4
(2.0 - 5.8)
92 ± 16
(47 - 145)
Entire Group
(n = 19)
2.4 ± 0.2
(1.0 - 4.1)
85 ± 6
(12 - 170)
2.2 ± 0.2
(1.0 - 5.8)
70 ± 8
(15 - 127)
2.3 ± 0.2
(1.0 - 5.8)
81 ± 8
(40 - 166)
† SRWC = self-reported water consumption as recorded within food diaries.
‡ Daily PA = daily physical activity as determined with wrist-worn physical activity monitors.
Heil Journal of the International Society of Sports Nutrition 2010, 7:29
/>Page 6 of 12
were split into “low” and “high” subgroups using each
group’ s respective m edian values f or daily PA, SRWC,
and average PRAL. These subgroups were used as a
basis for reevaluating the urine measures since each of
these variables can independently influence urine osmol-
ality and pH. Summary statistics for PA, SRWC, and
average PRAL for the resulting subgroups are provided
in Table 5. A complete summary of urine osmolality
results are provided in Tables 6 and 7 for Control and
Experimental groups, respectively. There were no signifi-
cant changes in urine osmolality for the Control group
over the entire Testing Phase, regardless of whether the
entire group or subgroups were evaluated. Urine osmol-
ality for urine samples collected in the second week of
the treatment period for the Experimental group, how-
ever, were significantly higher than the pre-treatment
reference value. The subgroup analyses also indicated
that urine osmolality tended to be significantly higher at
the end of the treatment period for Experimental sub-
jects within the “ high” daily PA, “ low” SRWC, and
“high” PRAL subgroups. Tables 8 and 9 show that the
trends for changes in urine pH paralleled those dis-
cussed for urine osmolality. Specifically, there were no
significant changes in urine pH across all measurements
for the Control gro up which includes the daily PA,
SRWC, and PRAL subgroup analyses (Table 8). In con-
trast, when considering the Experimental group urine
measures (Table 9), pH increased progressively and sig-
nificantly throughout the treatment period by approxi-
mately 0.3 to 0.8 units. This same trend was evident
throughout the “lo w” and “high” Experimental subgroup
analyses as well with the largest pH increases (+0.5 to
+1.2 units) observed for the “high ” daily PA, “ high”
SRWC, and “ high” PRAL subgroups. Interestingly,
observed changes in daily urine output, osmolality, and
pH for the Experimental group all returned to pre-treat-
ment levels during the post-treatment period.
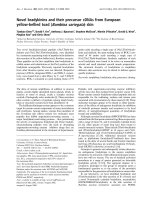
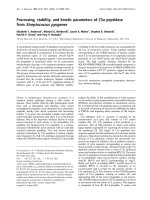
Fingertip blood osmolality and pH measurements for
both Control and Experimental groups are shown in
Figures 2 and 3, respectively. While blood osmolality
showed no significant changes for Control group, blood
osmolality progressively decreased from the start to the
end of the treatment period with the last two measures
significantly lower than the pre-treatment reference
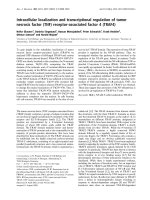
value. The Control group’s blood pH also showed no
significant changes while the Experimental group’ s
bloodincreasedsignificantlyby0.15-0.17unitsbythe
second week of the treatment period. Similar to the
observations described for the urine measures, blood
osmolality and pH both returned to pre-treatment levels
during the post-treatment period.
Discussion
This study was designed to ev aluate the influence of
mineralized alkaline bottled water (i.e., AK water) on
markers of both acid-base balance and hydration status.
In particular, these measurements were performed
under free-living condit ions, meaning that there was no
purposeful attempt to control i ndividual differences in
Figure 1 Changes in 24-hour urine output (L/day) across the
three study periods. Changes are shown relative to the very first
collection (i.e., urine measurement 1, or M1). Individual values were
calculated as a difference between the measured value at each of
the 12 measurements and the measured value at M1. Values
marked with an asterisk (*) differed significantly from the M1
reference value of zero liters (P < 0.05). Short dashed lines represent
one-side SE bars.
Table 5 Summary statistics of sub-group analysis variables reported as Mean ± SD (Range)
Grouping Variables Control Group (n = 19) Experimental Group (n = 19)
“Low” (n = 9) “High” (n = 10) “Low” (n = 9) “High” (n = 10)
†Daily PA (mins/day) 41.2 ± 14.7
(15.0 - 63.0)
96.6 ± 19.9
(68.0 - 127.0)
51.3 ± SD
(16.0 - 73.0)
102.7 ± 32.6
(75.0 - 173.0)
‡SRWC (L/day) 1.4 ± 0.3
(1.0 - 1.9)
3.1 ± 1.1
(2.0 - 5.6)
1.4 ± 0.23
(1.0 - 1.7)
2.95 ± 0.84
(1.8 - 4.7)
§PRAL (mg/day) 5.72 ± 9.40
(-8.30 - 23.9)
45.30 ± 25.85
(24.60 - 114.90)
3.28 ± 11.8
(-22.2 - 15.0)
35.05 ± 17.3
(18.4 - 74.0)
† SRWC = self-reported water consumption as recorded within food diaries.
‡ Daily PA = daily physical activity as determined with wrist-worn physical activity monitors.
§ PRAL = potential renal acid load as computed from diet diary evaluations.
Heil Journal of the International Society of Sports Nutrition 2010, 7:29
/>Page 7 of 12
daily PA, dietary intake, or even daily water consump-
tion. As such, the design of this study should allow for
the results to be more generalizable to the habitual con-
sumption of bottled water than would results from a
laboratory controlled study.
Influence on Acid-Base Balance
When compared with the consumption of the placebo
bottled water, habitual consumption of AK water in the
present study was associated with an increase in bo th
urine (Table 7) and blood (Figure 3) pH while measures
of both daily PA (Table 4) and dietary composition
remain ed stabile. Previous researc h by Welch et al. [11]
demonstrated that urinary pH f rom 24-hour collection
samples could funct ion as an effective surrogate marker
for changes in acid-ba se balance when evaluating differ-
ences i n dietary intake. König et al [10] used this infor-
mation as a premise for determining that consumption
of a mineral-rich supplement significantly increased
both urine (5.94 to 6.57) and blood pH (7.40 to 7.41).
Similarly, Berardi et al. [9] showed that urinary pH
increased from 6.07 to 6.21 and 6.27 following one and
two weeks of ingestion, respectively, of a plant-based
supplement. The observations from these studies [9,10]
are consistent with the changes in urine (6.23 t o 7.07)
and blood pH (7.52 to 7.69) observed by the present
Table 6 Urine Osmolality for the Control group with daily PA, SRWC, and PRAL subgroup analyses (Mean (SE))
Control Condition Pre-Treatment Period Treatment Period Post-Treatment Period
M1 M2 M3 M4 M5 M6 M7 M8 M9 M10 M11 M12
All Subjects 495 424 466 450 439 470 419 448 430 480 488 425
(n = 19) (52) (42) (54) (51) (55) (42) (41) (42) (50) (54) (47) (43)
Low PA
(n = 9)
509
(64)
478
(67)
483
(69)
512
(76)
515
(70)
418
(76)
461
(80)
465
(78)
445
(81)
493
(77)
468
(79)
479
(50)
High PA
(n = 10)
483
(66)
375
(56)
451
(57)
394
(40)
370
(41)
516
(60)
382
(36)
370
(35)
416
(50)
461
(68)
506
(57)
467
(68)
Low SRWC
(n = 9)
538
(66)
499
(55)
538
(69)
502
(60)
469
(67)
506
(71)
426
(37)
430
(36)
470
(67)
515
(61)
483
(54)
433
(52)
High SRWC
(n = 10)
456
(69)
356
(56)
402
(72)
403
(69)
412
(70)
437
(50)
413
(72)
410
(70)
394
(58)
446
(69)
493
(77)
419
(69)
Low PRAL
(n = 9)
466
(64)
444
(72)
495
(69)
452
(75)
457
(76)
455
(77)
398
(44)
410
(44)
441
780)
493
(74)
468
(63)
380
(59)
High PRAL
(n = 10)
521
(66)
406
(49)
440
(68)
448
(72)
423
(72)
480
(60)
438
(69)
435
(60)
442
(80)
466
(69)
506
(71)
466
(62)
Note: There were a total of twelve 24-hour urine collections labeled in the table as M1-M12, respectively. Mean osmolality values were compared directly with
respective mean Pre-Treatment reference value which were averages of all M1-M3 values within the condition and subject group being evaluated. These Pre-
Treatment reference values were as follows: 462 (all Control subjects), 490 (low PA), 436 (high PA), 525 (low SRWC), 405 (high SRWC), 468 (low PRAL), and456
mOsm/kg (high PRAL). There were no significant differences detected for any of the evaluations.
Table 7 Urine Osmolality for the Experimental group with daily PA, SRWC, and PRAL subgroup analyses (Mean (SE))
Experimental Condition Pre-Treatment Period Treatment Period Post-Treatment Period
M1 M2 M3 M4 M5 M6 M7 M8 M9 M10 M11 M12
All Subjects 373 367 387 375 343 396 † 435 † 440 † 445 376 358 360
(n = 19) (28) (39) (47) (32) (40) (42) (41) (44) (40) (38) (31) (35)
Low PA
(n = 9)
372
(45)
390
(68)
409
(73)
403
(52)
368
(79)
379
(80)
444
(87)
451
(87)
417
(82)
426
(64)
383
(49)
420
(70)
High PA
(n = 10)
374
(36)
346
(45)
368
(63)
350
(41)
330
(56)
412
(51)
427
(48)
430
(50)
† 473
(45)
330
(42)
335
(40)
340
(45)
Low SRWC
(n = 9)
418
(39)
477
(58)
505
(79)
467
(41)
460
(43)
504
(47)
† 574
(46)
† 581
(45)
† 562
(46)
441
(59)
414
(41)
480
(70)
High SRWC
(n = 10)
333
(37)
268
(28)
281
(28)
292
(31)
238
(36)
299
(29)
310
(42)
315
(43)
332
(45)
318
(44)
308
(41)
354
(36)
Low PRAL
(n = 9)
355
(44)
342
(61)
450
(65)
343
(38)
336
(40)
362
(45)
412
(49)
419
(50)
376
(50)
345
(46)
351
(49)
413
(65)
High PRAL
(n = 10)
390
(36)
389
(51)
331
(46)
404
(51)
349
(42)
427
(44)
456
(48)
† 460
(45)
† 470
(45)
404
(61)
365
(41)
4141
(39)
Note: There were a total of twelve 24-hour urine collections labeled in the table as M1-M12, respectively.
† Mean osmolality value differed significantly (P < 0.05) from respective mean Pre-Treatment reference value which was an average of all M1-M3 values within
the condition and subject group being evaluated. These Pre-Treatment reference values were as follows: 376 (all Experimental subjects), 390 (low PA), 363 (high
PA), 467 (low SRWC), 294 (high SRWC), 382 (low PRAL), and 370 mOsm/kg (high PRAL).
Heil Journal of the International Society of Sports Nutrition 2010, 7:29
/>Page 8 of 12
study for the Experimental group. Thus, the habitual
consumption of AK water under free-living conditions
had a similar influence on urinary and blood pH as has
been shown to occur with nutrition supplements specifi-
cally designed to impact the body’s acid-base balance.
The above observations, however, are not without lim-
itations as the onset and magnitude of the urine alkali-
zati on within the Experimental group was influenced by
daily PA, SRWC, and computed dietary PRAL (Table 9).
Specifically, urine pH tended to increase sooner within
the treatment period and to a higher pH level for those
who habitually engaged in more physical activity, self-
reported drinking more AK water, as well as those who
regularly reported higher nutritionally-induced acid
loads (Table 9). Thus, the actual impact of consuming
the AK water’s mineral-based alkalizing agents on urine
pH may be dose dependent. This observation would cer-
tainly explain the differences in urinary pH between
“low” and “ high” levels of AK water consumption and
dailyPA,butastudythatpreciselycontrolsAKwater
intake is needed to support the speculation of a dose-
response relationship.
It is interesting to note that the blood pH values
reported for this study are somewhat higher than the
7.35-7.45 range typically ascribed as the ideal range for
blood pH. It is likely that the measurement procedures
Table 8 Urine pH for the Control group with daily PA, SRWC, and PRAL subgroup analyses (Mean (SE))
Control Condition Pre-Treatment Period Treatment Period Post-Treatment Period
M1 M2 M3 M4 M5 M6 M7 M8 M9 M10 M11 M12
All Subjects 6.01 6.11 6.13 6.13 6.20 6.15 6.01 6.01 6.00 6.08 5.86 6.20
(n = 19) (0.11) (0.09) (0.08) (0.10) (0.11) (0.06) (0.07) (0.07) (0.08) (0.09) (0.08) 0.08)
Low PA
(n = 9)
5.95
(0.21)
5.93
(0.11)
6.00
(0.14)
6.07
(0.16)
6.12
(0.17)
6.11
(0.09)
5.86
(0.07)
5.86
(0.07)
5.91
(0.11)
6.02
(0.14)
5.99
(0.12)
6.11
(0.12)
High PA
(n = 10)
6.05
(0.11)
6.20
(0.10)
6.24
(0.10)
6.19
(0.13)
6.36
(0.12)
6.19
(0.09)
6.14
(0.12)
6.14
(0.12)
6.05
(0.12)
6.14
(0.12)
6.02
(0.08)
6.28
(0.11)
Low SRWC
(n = 9)
6.21
(0.18)
6.28
(0.13)
6.17
(0.17)
6.13
(0.15)
6.17
(0.13)
6.29
(0.14)
5.85
(0.14)
5.85
(0.14)
5.99
(0.12)
6.25
(0.12)
6.16
(0.16)
6.37
(0.14)
High SRWC
(n = 10)
6.30
(0.18)
6.15
(0.10)
6.14
(0.09)
6.18
(0.14)
6.31
(0.15)
6.18
(0.14)
6.25
(0.15)
6.25
(0.15)
6.19
(0.13)
6.15
(0.11)
5.94
(0.13)
6.10
(0.11)
Low PRAL
(n = 9)
6.06
(0.22)
6.11
(0.16)
6.22
(0.15)
6.22
(0.17)
6.23
(0.17)
6.23
(0.11)
5.92
(0.11)
5.92
(0.11)
5.92
(0.13)
5.98
(0.16)
5.87
(0.15)
6.16
(0.14)
High PRAL
(n = 10)
5.96
(0.10)
6.11
(0.09)
6.04
(0.09)
6.06
(0.11)
6.36
(0.36)
6.08
(0.07)
6.08
(0.10)
6.08
(0.10)
6.04
(0.10)
6.18
(0.08)
5.86
(0.09)
6.24
(0.09)
Note: There were a total of twelve 24-hour urine collections labeled in the table as M1-M12, respectively. Mean pH values were compared directly with respective
mean Pre-Treatment reference value whi ch were averages of all M1-M3 values within the condition and subject group being evaluated. These Pre-Treatment
reference values were as follows: 6.08 (all Control subjects), 5.96 (low PA), 6.16 (high PA), 6.22 (low SRWC), 6.20 (hi gh SRWC), 6.13 (low PRAL), and 6.04 (high
PRAL).
Table 9 Urine pH for the Experimental group with daily PA, SRWC, and PRAL subgroup analyses (Mean (SE))
Experimental Condition Pre-Treatment Period Treatment Period Post-Treatment Period
M1 M2 M3 M4 M5 M6 M7 M8 M9 M10 M11 M12
All Subjects 6.28 6.20 6.22 6.25 † 6.51 † 6.57 † 7.00 † 7.00 † 7.07 6.23 6.17 6.21
(n = 19) (0.11) (0.11) (0.10) (0.10) (0.09) (0.10) (0.12) (0.11) (0.08) (0.07) (0.10) (0.09)
Low PA
(n = 9)
6.34
(0.16)
6.40
(0.18)
6.32
(0.12)
6.32
(0.12)
6.54
(0.13)
6.63
(0.12)
† 6.88
(0.12)
† 6.89
(0.13)
† 6.94
(0.08)
6.34
(0.11)
6.24
(0.17)
6.33
(0.17)
High PA
(n = 10)
6.23
(0.15)
6.02
(0.12)
6.11
(0.14)
6.04
(0.09)
6.48
(0.11)
† 6.67
(0.13)
† 7.15
(0.13)
† 7.12
(0.13)
† 7.10
(0.13)
6.13
(0.12)
6.11
(0.12)
6.11
(0.12)
Low SRWC
(n = 9)
6.17
(0.09)
6.26
(0.14)
6.33
(0.09)
6.21
(0.10)
6.30
(0.08)
6.29
(0.12)
6.34
(0.11)
6.54
(0.11)
† 6.60
(0.11)
6.16
(0.11)
6.11
(0.09)
6.09
(0.08)
High SRWC
(n = 10)
5.91
(0.16)
5.96
(0.18)
6.00
(0.16)
6.29
(0.17)
† 6.57
(0.17)
† 6.78
(0.11)
† 7.21
(0.12)
† 7.14
(0.14)
† 7.25
(0.08)
6.07
(0.16)
5.88
(0.15)
6.27
(0.12)
Low PRAL
(n = 9)
6.56
(0.15)
6.40
(0.16)
6.46
(0.12)
6.41
(0.13)
6.50
(0.11)
6.50
(0.14)
† 6.79
(0.20)
† 6.88
(0.20)
† 6.89
(0.14)
6.40
(0.10)
6.32
(0.15)
6.37
(0.14)
High PRAL
(n = 10)
6.04
(0.11)
6.02
(0.13)
5.99
(0.15)
6.19
(0.15)
† 6.63
(0.14)
† 6.65
(0.14)
† 7.15
(0.13)
† 7.18
(0.13)
† 7.24
(0.07)
6.07
(0.12)
6.04
(0.12)
6.07
(0.08)
Note: There were a total of twelve 24-hour urine collections labeled in the table as M1-M12, respectively.
† Mean pH value differed significantly (P < 0.05) from respective mean Pre-Treatment reference value which was an average of all M1-M3 values within the
condition and subject group being evaluated. These Pre-Treatment reference values were as follows: 6.23 (all Experimental subjects), 6.35 (low PA), 6.12 (high
PA), 6.33 (low SRWC), 5.96 (high SRWC), 6.47 (low PRAL), and 6.02 (high PRAL).
Heil Journal of the International Society of Sports Nutrition 2010, 7:29
/>Page 9 of 12
used (i.e., fingertip samples collected in heparinized
capillary tubes and refrigerator stored for 6-10 hrs)
allowed the samples to slightly increase pH prior to the
actual measurement of pH. However, since this effect
would have been the same for both Control and Experi-
mental subjects, it is presumed that this effect was simi-
lar for all samples. Thus, while the blood pH values are
slightly elevated for both Control and Experimental
groups, the significant change in blood pH demon-
strated by the Experimental group is likely a real effect
of consuming AK water.
Influence on Hydration Status
Cons umption of AK water following a dehydrating bout
of cycling exerc ise has previously been shown to rehy-
drate cyclists faster a nd more completely than the con-
sumption of placebo bottled water (i.e., Aquafina) [8].
Following the consumption of AK water, the cyclists
demonstrated less total urine output, their urine was
more concentrated (higher specific gravity), and total
blood protein concentration was lower, all of which are
expected observations for improved hydration status [8].
Even though the present study was performed under
free-living conditions, the Experimental group demon-
strated an increased urine concentration (osmolality;
Table 7), a decreased total urine output (Figure 1), as
well as a decreased blood osmolality (Figure 2) by the
end of the treatment period. These changes suggest that
while SRWC was relatively stabile across measurement
periods (Table 4), a relatively greater proportion of the
AK water consumed during the treatment phase was
being retaine d within the cardiovascular system. Indeed,
the cyclist hydration study described above [8] reported
that water retention at the end of a 3-hour recovery per-
iod was 79.2 ± 3.9% when subjects drank AK water ver-
sus 62.5 ± 5.4% when drinking the placebo (P < 0.05).
Thus, the present study has shown that the habitual
consumption of mineralized bottled water can actually
improve indicators of hydration status over non-minera-
lized bottled water under free-living conditions that is
consistent with lab-controlled study results.
Similar to what was described for changes in acid-base
balance above, however, the onset of these observations
did not begin with the immediate consumption of AK
water. In fact, changes in total urine output, urine
osmolality, and blood osmolality did not appear to begin
changing until the end of the first week of consuming
AK water, with significant changes always occurring at
the end of the second week of consumption. Unfortu-
nately, the present study was de signed to observe possi-
ble changes in acid-base balance and hydration status
rather than decipher mechanistic causes. However, it is
possible to speculat e on some contributing causes given
that the AK water manufact urer lists only three major
naturally occurring minerals on the bottle label (Cal-
cium at 2.8 mg/L, Silica at 16.0 mg/L, and Potassium at
23.0 mg/L) as well as the proprietary blend of mineral-
based alkalizing supplement called Alka-PlexLiquid™.
According to the manufacturer, Alka-PlexLiquid™ is a
freely dissolvable form of a patented blend of mineral-
based alkalizing ingredients called Alka-P lex™ granules.
These granules are packaged in tablet form and sold as
one of several types of nutrition and sports performance
supplements and has been granted New Dietary Ingredi-
ent (NDI) recognition by the Food and Drug Adminis-
tration (FDA). According to the Alka-Plex™ product
Figure 2 Changes in fingertip blood osmolality across the three
study periods. Blood osmolality values correspond each of twelve (i.
e., M1-M12) fingertip collections. Values marked with an asterisk (*)
differed significantly from the M1 reference values of 335 and 352
mOsm/kg for the Control and Experimental groups, respectively (P <
0.05). Short dashed lines represent one-side SE bars.
Figure 3 Changes in fingertip blood pH across the three study
periods. Blood pH values correspond each of twelve (i.e., M1-M12)
fingertip collections. Values marked with an asterisk (*) differed
significantly from the M1 reference values of 7.53 and 7.52 for the
Control and Experimental groups, respectively (P < 0.05). Short
dashed lines represent one-side SE bars.
Heil Journal of the International Society of Sports Nutrition 2010, 7:29
/>Page 10 of 12
labels, as well as literature made available by the manu-
facturer, Alk a-Plex™-based products contain a consider-
able amount of calcium carbonate, potassium hydroxide,
magnesium hydroxide, and potassium chloride. Since all
of these compounds will freely disassociate in a water
solution, there will be an unusually high concentration
of the same minerals already present in AK’ s glacier
water (calcium, potassium, magnesium), as well as the
alkaline half of these compounds (e.g., hydroxide ion, or
OH
-
, from potassium hydroxide). Though the exact
amounts of these Alka-Plex™-based compounds within
the Alka-PlexLiquid™ formula are not known, these
compounds are likely the driving force behind the
observations in the p resent study. It is possible, for
example, that the continual presence of a dietary alkaliz-
ing agent absorbed dire ctly into the blood could even-
tually shift blood pH upward while having the greatest
impact on urinary pH for those consuming relatively
acidic diets. In fact, urinary pH was influenced the most
for those in the Experimental group with the highest
PRAL values (Table 9). It is also possible that the influx
of additional minerals absorbed into the blood from the
AK water contributed to a greater retention of water
within the cardiovascular system. This hypothesis could
explain why urine output for the Experimental group
increased during the post-treatment period following
the shift from consuming AK water to the placebo
water. Clearly, to understand the cause behind the
observations fro m the present study, more work o n
tracking concentration changes of these key minerals in
both the blood and urine should occur.
Study Implications
The results from this study suggest that the regular con-
sumption of mineral-rich bottled water with the Alka-
PlexLiquid™ supplement can have measureable influ-
ences on markers for acid-base balanc e and hy dration
status when consumed under free-living conditions.
Since most studies evaluating nutritional influences on
acid-base status are either large-scale epidemiological
studies [11], or studies where dietary or supplement
intake is tightly controlled [10], the present study is
relatively unique. The self-regulation of water consump-
tion by subjects in the present study, however, also
make it somewhat more difficult to definitively state
how much AK water should be consumed to realize
similar observations. Regardless, the present study
results suggest that the influence of drinking AK water
requires either an exposure period (i.e., ≥1 week) or a
minimal volume of AK water consumption before the
effects can be detected significantly in the blood and
urine. While the minimal volume consumed to detect
changes in pH or hydration status is likely to be influ-
enced by diet and daily PA, an estimate can be
computed based upon the results discussed thus far. For
example, if it is assumed that AK water is being con-
sumed at an average rate of 2.3 L/day (an average of
rates from Table 4), and that at least a week of regular
consumption is required for hydration and/or pH influ-
ence is detectable, then the minimal consumption
required under free-living conditions is approximately
16 L (i.e., 2.3 L/day × 7 days = 16.1 L) in young healthy
adults. However, the “high” SRWC Experimental sub-
group (SRWC = 3.0 L/day; Table 4) showed significantly
increased urine pH by only the second urine measure-
ment during the treatment period, which translates to a
minimal consumption rate of approximately 9 L over
three days rather than 16 L over seven days. These com-
putations are for illustration purposes to highlight the
fact that the “dose” of AK water consumption needed to
elicit a particular blood or urine “response” should be
evaluated more precisely in future studies.
Low-grade metabolic acidosis is generally considered
to be a predisposing risk factor for the development of
several c hronic conditions [1-4]. While it has been sug-
gested that the alkalizing influence of dietary interven-
tions and supplements can be an important countering
influence [7], the present study was not designed to
determine whether the consumption of AK water could
improve these disease conditions or not. However, given
that the influences on blood and urine pH were consis-
tent with the hypothesized changes, that the changes
reversed during the post-treatment period, and that the
Control group showed no changes over the same time
period, it is reasonable to suggest that the consumption
of AK water could be utilized in a clinical trial where
those with a specific chronic disease or condition are
targeted.
Conclusions
The consumption of the mineral-rich bottled water with
the Alka-PlexLiquid™ supplement (Akali®, or AK water)
was associated with improved acid-base balance (i.e., an
alkalization of the blood and urine) and hydration status
when consumed under free-living conditions. In con-
trast, subjects who consumed the placebo bottled water
showed no changes over the same period of time. These
results indicate that the habitual consumption of AK
water may be a valuable nutritional ve ctor for influen-
cing both acid-base balance and hydration status in
healthy adults.
Acknowledgements
The author would like to acknowledge the assistance of Dr. John Seifert, as
well as graduate students Sarah Willis, Bjorn Bakken, Katelyn Taylor, and
Edward Davilla for their assistance with data collection and processing.
Funding for this study was provided by The Glacier Water Company, LLC
(Auborn, WA USA).
Heil Journal of the International Society of Sports Nutrition 2010, 7:29
/>Page 11 of 12
Authors’ contributions
The author of this study is solely responsible for the study design, subject
recruitment and health screening, data analysis, and manuscript preparation.
Competing interests
The author declares that they have no competing interests.
Received: 5 June 2010 Accepted: 13 September 2010
Published: 13 September 2010
References
1. Murakami K, Sasaki S, Takahashi Y, Uenishi K: Association between dietary
acid-base load and cardiometabolic risk factors in young Japanese
women. Br J Nut 2008, 100:642-651.
2. Wynn E, Lanham-New SA, Krieg M, Whittamore DR, Burckhardt P: Low
estimates of dietary acid load are positively associated with bone
ultrasound in women older than 75 years of age with a lifetime fracture.
J Nutr 2008, 138:1349-1354.
3. Dawson-Hughes B, Harris SS, Ceglia L: Alkaline diets favor lean tissue
mass in older adults. Am J Clin Nutr 2008, 87:662-665.
4. Rubenowitz E, Axelsson G, Rylander R: Magnesium and calcium in
drinking water and death from acute myocardial infarction. Am J
Epidemiol 1996, 143(5):456-462.
5. Rubenowotz E, Molin I, Axelsson G, Rylander R: Magnesium in drinking
water in relation to morbidity and mortality from acute myocardial
infarction. Epi 2000, 11:416-421.
6. Rylander R: Drinking water constituents and disease. J Nutr 2008,
423S-425S.
7. Burckhardt P: The effect of the alkali load of mineral water on bone
metabolism: Interventional studies. J Nutr 2008, 138:435S-437S.
8. Heil DP, Seifert J: Influence of bottled water on rehydration following a
dehydrating bout of cycling exercise. J Int Soc Sports Nut 2009.
9. Berardi JM, Logan AC, venket Rao A: Plant based dietary supplement
increases urinary pH. J Int Soc Sports Nut 2008.
10. König D, Muser K, Dickhuth HH, Berg A, Deibert P: Effect of a supplement
rich in alkaline minerals on acid-base balance in humans. Nut J 2009.
11. Welch AA, Mulligan A, Bingham SA, Khaw K: Urine pH is an indicator of
dietary acid-base load, fruit and vegetables and meat intakes: results
from the European Prospective Investigation into Cancer and Nutrition
(EPIC)-Norfolk population study. Br J Nut 2008, 99:1335-1343.
12. Remer T, Dimitriou T, Manz F: Dietary potential renal acid load and renal
net acid excretion in healthy, free-living children and adolescents. Am J
Clin Nutr 2003, 77(5):1255-1260.
13. Remer T, Manz F: Potential renal acid load of foods and its influence on
urine pH. J Am Diet Assoc 1995, 95:791-757.
14. Heil DP: Predicting activity energy expenditure using the Actical® activity
monitor. Res Q Exer Sport 2006, 77(1):64-80.
15. Heil DP, Bennett GG, Bond KS, Webster MD, Wolin KY: Influence of activity
monitor location and bout duration on free-living physical activity. Res Q
Exerc Sport 2009, 80(3):424-433.
16. Heil DP, Hymel AM, Martin CK:
Predicting free-living energy expenditure
with hip and wrist accelerometry versus doubly labeled water [abstract].
Med Sci Sport Exerc 2009, 41(5):S531.
17. Haskell WL, Lee I, Pate RR, Powell KE, Blair SN, Franklin BA, Macera CA,
Heath GW, Thompson PD, Bauman A: Physical activity and public health:
Updated recommendation for adults from the American college of
Sports medicine and the American Heart Association. Med Sci Sports
Exerc 2007, 39(8):1423-1434.
doi:10.1186/1550-2783-7-29
Cite this article as: Heil: Acid-base balance and hydration status
following consumption of mineral-based alkaline bottled water. Journal
of the International Society of Sports Nutrition 2010 7:29.
Submit your next manuscript to BioMed Central
and take full advantage of:
• Convenient online submission
• Thorough peer review
• No space constraints or color figure charges
• Immediate publication on acceptance
• Inclusion in PubMed, CAS, Scopus and Google Scholar
• Research which is freely available for redistribution
Submit your manuscript at
www.biomedcentral.com/submit
Heil Journal of the International Society of Sports Nutrition 2010, 7:29
/>Page 12 of 12