Báo cáo y học: " The effects of low and high glycemic index foods on exercise performance and beta-endorphin responses" pdf
Bạn đang xem bản rút gọn của tài liệu. Xem và tải ngay bản đầy đủ của tài liệu tại đây (392.72 KB, 11 trang )
RESEARCH ARTIC LE Open Access
The effects of low and high glycemic index foods
on exercise performance and beta-endorphin
responses
Athanasios Z Jamurtas
1,2*
, Trifon Tofas
1,2
, Ioannis Fatouros
2,3
, Michalis G Nikolaidis
1,2
, Vassilis Paschalis
1,2
,
Christina Yfanti
1,2
, Stefanos Raptis
4
and Yiannis Koutedakis
1,2,5
Abstract
Τhe aim of this study was to examine the effects of the consumption of foods of various glycemic index values on
performance, b-endorphin leve ls and substrate (fat and carbohydrate) utilization during prolonged exercise. Eight
untrained healthy males underwent, in a randomized counterbalanced design, three experimental conditions under
which they received carbohydrates (1.5 gr. kg
-1
of body weight) of low glycemic index (LGI), high glycemic index
(HGI) or placebo. Food was administered 30 min prior to exercise. Subjects cycled for 60 min at an intensity
corresponding to 65% of VO
2
max, which was increased to 90% of VO
2max
, then they cycled until exhaustion and
the time to exhaustion was recorded. Blood was collected prior to food consumption, 15 min prior to exercise, 0,
20, 40, and 60 min into exercise as well as at exhaustion. Blood was analyzed for b-endorphin, glucose, insulin, and
lactate. The mean time to exhaustion did not differ between the three conditions (LGI = 3.2 ± 0.9 min; HGI = 2.9 ±
0.9 min; placebo = 2.7 ± 0.7 min). There was a significant interaction in glucose and insulin response (P < 0.05)
with HGI exhibiting higher values before exercise. b-endorphin increased significantly (P < 0.05) at the end of
exercise without, however, a significant interacti on between the three conditions. Rate of perceived exertion, heart
rate, ventilation, lactate, respiratory quotient and substrate oxidation rate did not differ between the three
conditions. The present study indicates that ingestion of foods of different glycemic index 30 min prior to one
hour cycling exercise does not result in significant changes in exercise performance, b-endorphin levels as well as
carbohydrate and fat oxidation during exercise.
Keywords: Glucose, insulin, opioids, training, food
Background
Carboh ydrate ingestion prior to exercise has been shown
to affect metabolic r esponses and performance [1]. It is
suggested that carbohydrate feeding prior to exercise pro-
vides additional supplies for oxidation, results in increased
muscle glucose uptake and reduced liver glucose output
during exercise [2] and the enhanced blood glucose avail-
ability may preserve muscle glycogen stores [3].
b-endorphin is one of the peptides that has been sug -
gested to play a role in glucose metabolism at rest [4,5]
and during exercise [6-9]. b-endorphin is an opioid pep-
tide representing the C-terminal 31 amino acid residue
fragment of pro-opiomelanocortin. Data indicates that
stress is a potent inducer of b-endorphin release and it
is well known that exercise of sufficient intensity and
duration elevates its c irculating concentrations [10-13].
The fact that both central and peripheral b-endorphin
levels appear to change under hyperglycemic or hypo-
glycemi c conditions suggests that endorphins are imp li-
cated in the regulation of glucose h omeostasis [4,13].
Specifically, b-endorphin infusion attenuated glucose
decline during prolonged exercise [6,7,9,14,15], a result
that was accompanied by marked changes in glucoregu-
latory hormones such as insulin and glucagon wherea s
opiate blockade produced opposite results [6,14,15].
Thus, there is enough data to support that b-endorphin
could be affected by differences in blood glucose
* Correspondence:
1
University of Thessaly, Department of Physical Education and Sport Science,
Karies, 42100, Trikala, Greece
Full list of author information is available at the end of the article
Jamurtas et al. Journal of the International Society of Sports Nutrition 2011, 8:15
/>© 2011 Jamurtas et al; licen see BioMed Central Ltd. This is an Open Access article distributed under the terms of the Creative
Commons Attribution Licen se (http://creativecommon s.org/licenses/b y/2.0), w hich permits unrestricted use, distribution, and
reproduction in any medium, provided the original work is properly cited.
availability as the ones produced by the consumption of
different glycemic index (GI) foods.
Glycemic index ranks foods according to their effect on
blood glucose levels compared to a reference food [16].
There are several studies that examined the effects of
foods of various GI values prior to exercise with inconsis-
tent results being reported in regards to performance
[17-20] and carbohydrate utilization during exercise
[17,19]. Exercise performance has been positively affected
by low glycemic index (LGI) food [17] and remained
unaffected by high glycemic index (HGI) food [1 8,19].
Even though there is inconsistency regarding the benefits
of the ingestion of foods of varying GI on exercise perfor-
mance, several findings indicate that ingestion of LGI
foods may be more suitable over HGI consumption prior
to prolonged exercise because they enhance carbohydrate
availability during exercise [21,22].
However, the mechanisms responsible for the
enhanced carbohydrate availability during exercise fol-
lowing LGI food ingestion are still speculative in nature.
Several hormonal changes take place that modulate
nutrient availability to the working muscle during exer-
cise. Clearly, insulin, catecholamines and glucagon are
the most important hormones that influence the break-
down and supply of nutrients to the muscle [23]. A
decrease in insulin and an increase in catecholamines
result in a higher lipolytic rate and oxidation of lipids
avoiding episodes of hypoglycemia. Elevation of b-
endorphin levels resulted in attenuation of blood glucose
decline during prolonged exercise [9] which could be
partly attributed to a higher gluconeogenic rate [8].
Therefore, the aim of this study was to examine the
effects of the consumption of foods of various GI values
on performance, b-endorphin levels and nutrient utiliza-
tion during prolonged exercise.
Methods
Subjects
Eight untrained healthy males volunteers (age: 22.8 ± 3.6
yrs; height: 174.1 ± 4.2 cm; body mass: 75.1 ± 5.2 kg;
body fat: 10.6 ± 3.4%; VO
2max
:45.9±6.4ml·Kg
-1
min
-1
)
participated in this study. Inclusion criteria were
absence of clinical signs or symptoms of chr onic disease
as determined by physical examination and laboratory
analyses and absence of prescribed medication. All sub-
jects were informed about the nature of the study, the
associated risks and benefits and they signed an
informed consent form. Procedures were in accordance
with the Helsinki declaration of 1975 and the Institu-
tional Review Board approved the study.
Experimental design
VO
2max
assessment. Each subject performed an incre-
mental cycling test on a cycle ergometer (Monark,
Vansbro, Sweden) to determine VO
2max
. The incremen-
tal cycling test to exhaustion and the accompanying gas-
collection procedures have been described in detail pre-
viously [24]. Briefly, each subject started pedalling at 60
revolutions per minute (rpm) with no additional work-
load for 150 s. Work rate was then added incrementally
every 60 s with the intent of reaching the subject’s max-
imal exercise capacity within 6 to 12 min. VO
2max
was
determined when three of the following four criteria
were met: (i) volitional fatigue or inability to maintain
60 rpm, (ii) a < 2 mL
.
kg
-1.
min
-1
increase in VO
2
with an
increase in work rate, (iii) a respiratory exchange ratio ≥
1.10, and (iv) a HR within 10 bpm of the theoretical
maximum HR (220 - age).
The results of the initial maximal test were used to
determine the exercise intensity that corresponded to
65% of each subject’ sVO
2max
. Gas analyzer was cali-
brated immediately befor e each subject’stest.Peakoxy-
gen consumption (VO
2
) was determined as the h ighest
20-s average value of VO
2
observed over the last 60 s of
exercise.
Food consumption and exercise trial. Each subject
undertook three trials in a randomized counterbalance
order with each trial separated by a period of 7 days.
Subjects were asked to refrain from strenuous physical
activities and maintain their customary dietary intake
for 72 h prior to the testing days. To minimize the var-
iation in glycogen levels the subjects maintained a con-
stant diet (6-8 g. kg
-1
body weight of carbohydrate
intake) and training schedule [25]. On the days of the
main trials, subjects arrived at the laboratory at 08:00
AM, after a 10-h overnight fast. Upon arrival each sub-
ject rested quietly for at least 10 min and then an
indwelling catheter was inserted in a forearm vein for
blood sampling. On each occasion, after collection of
the baseline data, one of the following test meals was
consumed 30 min before exercise: a) 1.5 g of carbohy-
drates. kg
-1
body mass from an HGI food (white bread
with strawberry jam having a glycemic index = 70), b)
1.5 g of carbohydrates. kg
-1
body mass from an LGI
food (dried apricots having a glycemic index = 30), c)
300 ml of water alone (control). In order to prec lude
differences in hydration status prior to submaximal
exercise participants ingested 300 ml of water prior to
exercise in the two GI trials also.
Sub jects had 5 min to eat the meal and rested for the
next 30 min before they commenced cycling. The dura-
tion of submaximal exercise was 1 h at 65% VO
2max
.
After the 1-h of cycling, the resistance increased to 90%
VO
2max
, and the subjects exercised until they could no
longer maintain the designated cadence (60 rpm). We
assumed that 1-h of exercise at submaximal exercise
intensity after the ingestion of different glycemic index
foods will result in different muscle glycogen levels. This
Jamurtas et al. Journal of the International Society of Sports Nutrition 2011, 8:15
/>Page 2 of 11
in turn could have an effect on performance when a
subsequent short and intense period of exercise would
follow. Therefore, the reason for incr easing the intensity
to 90% of VO
2max
was to exhaust subjects in a fast way.
This model o f assessing performance has been used in
previous work that was concluded in our lab [26]. Exer-
cise time to exhaustion (from the increase of the resis-
tance to inability to maintain the cadence) was recorded
to the nearest second. Time to exhaustion at 90%
VO
2max
was reproducible in preliminary trials [coeffi-
cient of variation (CV) 6.2 ± 0.7%].
During exercise, one-minute expired air samples were
collected every 10 min, and each subject drank at least
250 ml of water per 30 min to ensure adequate hydra-
tion status [27]. From VCO
2
and VO
2
(L
.
min
-1
)total
carbohydrate and fat oxidation rates (g
.
min
-1
) were cal-
culated for the 1-h submaximal exercise bout using pub-
lished stoichiometric equations [28]. Heart rate was
monitored continuously during exercise by short-range
telemetry (Sports Test er PE 3000, Polar Electro, Kem-
pele, Finland). During all trials, subjective ratings of per-
ceived exertion (RPE) were obtained every 10 min by
using the modified Borg scale [29]. All trials were con-
ducted under conditions of similar temperature (23 ± 1°
C) and relative humidity (50-60%).
Blood collection and biochemical assays
All blood samples were drawn from a three-way valve
inserted into the end of a catheter. Blood samples (10
ml) were drawn from a forearm vein before the meal, at
15 and 30 min after the meal, every 20 min during exer-
cise (20, 40 and 60 min) and at exhaustion. Blood was
allowed to clot at room temperature for 20 min and
centrifuged at 1500 × g for 10 min. The serum layer was
removed and frozen at -70°C in multiple aliquots for
later analysis. A ll variables w ere analyzed in duplicates.
Plasma glucose concentration was determined spectro-
photometrically (Hitachi UV 2001) with commercially
available kits (Spinreact, Santa Coloma, Spain). b-En dor-
phin and insulin were assayed by radioimmunoassay
method. Blood lactate concentration was determined
spectrophotometrically (Dr Lange LP 20, Be rlin, Ger-
many). Haematocrit was measured by microcentrifuga-
tion and haemoglobin was measured using a kit from
Spinreact (Santa Coloma, Spain). Post exercise plasma
volume changes were computed on the basis of haema-
tocrit and haemoglobin as previously described [30]. CV
for glucose, insulin, b-endorphin and lactate were 5.3%,
4.9%, 4.8% and 2.1%, respectively.
Dietary analysis
To control for the effect of previous diet on the out-
come measures of the study and establish that partici-
pants had similar levels of macronutrient intak e under
the three conditions, they were asked to record their
diet for three days preceding each trial and repeat this
diet before the second and third exercise condition.
Each subject had been provided with a wr itten set of
guidelines for monitoring dietary consumption and a
record sheet for recording food intake. Diet records
were analyzed usin g the nutritional analysis system
Science Fit Diet 200A (Sciencefit, Greece) and the
results of the analysis are presented in Table 1.
Statistical analyses
The distribution of all dependent variables was exam-
ined by Shapiro-Wilk test and was found not to differ
significantly from normal. Data are presented as mean ±
SEM. Two-way ANOVA (trial × time) with repeated
measurements on both factors were used to analyze the
assessed parameters. If a significant interaction was
obtained, pairwise comparisons were performed through
simple contrasts and simple main effects analysis. One
way ANOVA was used to analyze time to exhaustion,
carbohydrate and fat oxidation rates.
Results
Exercise performance
The average exercise intensity during the 1-h submaxi-
mal cycling for the control, LGI, and HGI trials were
64.9 ± 2.4%, 64.7 ± 1.9% and 65.0 ± 2.1% of VO
2max
,
respectively and was not different between trials. Indivi-
dual responses and mean values of time to exhaustion
of the three trials after the 1-h cycling are presented in
Figure 1A and 1B, respectively. Mean values of time to
exhaustion did not differ between the three trials.
RPE, heart rate and ventilation
There was no significant main effect of trial or time by
trial interaction for RPE (Figure 2A). However, there
was a significant main effect of time (P < 0.001, h
2
=
.98, observed power = 1.00). RPE levels increased signifi-
cantly at 20 min and remained significantly elevated
until exhaustion for all trials. There were no significant
differences at rest between the three trials for heart rate
(Control = 68.0 ± 2.6 bpm, LGI = 66.3 ± 4.2 bpm, HGI
= 66.5 ± 3.4 bpm). There was no significant main effect
of trial or time by trial interaction for heart rate (Figure
2B) and ventilation (Figure 2C). However, there was a
Table 1 3-day dietary analysis recall (mean ± SD)
Control LGI HGI
Energy (kcal) 3559 ± 177 3627 ± 153 3721 ± 393
Carbohydrates (% energy) 51.1 ± 1.3 51.8 ± 1.1 52.4 ± 1.3
Fat (% energy) 33.3 ± 1.4 32.1 ± 1.1 31.6 ± 2.0
Protein (% energy) 15.6 ± 1.0 16.1 ± 1.6 16.0 ± 1.1
No significant differences were detected in any variable between control
group, low glycemic index (LGI) group and high glycemic index (HGI) group.
Jamurtas et al. Journal of the International Society of Sports Nutrition 2011, 8:15
/>Page 3 of 11
significant main effect of time for heart rate (P < 0 .001,
h
2
= .97, observed power = 1.00), and ventilation (P <
0.001, h
2
=.98,observedpower=1.00).Pairwisecom-
parisons revealed significant differences between the 10
min and exhaustion time points for all trials for heart
rate and ventilation.
Substrate oxidation
There was no significant main effect of trial or time by
trial interaction for respiratory quotient (RQ; Figure
3A). However, there was a significant main effect of
time (P <0.001,h
2
= .97, observed power = 1.00). RQ
appeared significantly elevated only at exhaustion with
no significant difference between the three trials. Carbo-
hydrateandfatoxidationrates(Figure3B)wasnotdif-
ferent between the three trials during exercise.
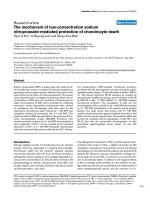
Lactate, glucose and insulin
There was no significant main effect of trial or time by
trial interaction for lactate (Figure 4A). However, there
was a significant main effect of time (P < 0.001, h
2
=
.92, observed power = 1.00). Lactate levels increased sig-
nificantly at 20 min of exercise and remained signifi-
cantly elevated until exhaustion for all trials.
Plasma glucose levels (Figure 4B) showed significant
differences for time (P < 0.001, h
2
= .75, observed
power = 1.00) and for trial by time interaction (P <
0.01, h
2
=.60,observedpower=.90).Plasmaglucose
levels were significantly higher in HGI at 15 and 30 min
after the ingestion of the meal compared with those of
LGI and control. After 20 min of exercise plasma glu-
cose levels fell to pre-exercise levels and remained
unchanged until the end of exercise. No significant dif-
ferences were noted between the control and LGI trials
in glucose levels.
Plasma insulin levels (Figure 4C) showed significant
differences for time (P < 0.001, h
2
= .85, observed
power = 1.00) and for trial by time interaction (P <
0.001, h
2
= .79, observed power = 1.00). Plasma insulin
levels increased significantly above baseline values 15
and 30 min after the HGI and LGI meals. However, the
rise was smaller after the LGI meal compared with the
rise after the HGI mea l. That increase was significantly
different compared to the plasma insulin levels of con-
trol trial at the respective time points. By 20 min of
exercise insulin levels had significantly decreased in
both HGI and LGI trials. However, at th is time point
plasma insulin levels were significantly higher in HGI
compared to control trial. No significant differences
were noted between the three trials at 60 min and at
exhaustion.
b-Endorphin
There was no significant main effect of trial or time by
trial interaction for b-endorphin (Figure 5). However,
there was a significant main effect of time (P <0.05,h
2
= .86, observed power = 1.00). b-Endorphin increased
significantly at the end of the exercise and that response
was evidenced in all three trials.
Discussion
The present study indicates that ingestion of foods of
different GI values 30 min prior to exhaustive cycling
exercise does not result in significant changes in exer-
cise performance. Furthermore, consumption of carbo-
hydrates of LGI and HGI does not alter b-endorphin
levels during exercise and does not result in significant
changes in carbohydrate and fat oxidation rate during
exercise.
Ingestion of carbohydrates prior to exercise resulted in
an increase in glucose and insulin (Figure 4A and 4B). It
is well known that when blood glucose increases the
pancreatic beta cells increase their output of insulin in
order to facilitate glucose uptake by the tissues. In our
study an initial increase of glucose was observed and
then plateaued whereas insulin continued to increas e up
to 30 minutes following the ingestion of foods. The
same glucose and insulin response prior to exercise was
Figure 1 Time to exhaustion (in dividual responses, A and
mean values, B) after the ingestion of LGI, HGI and control
meals (mean ± SEM). LGI: Low Glycemic Index; HGI: High Glycemic
Index.
Jamurtas et al. Journal of the International Society of Sports Nutrition 2011, 8:15
/>Page 4 of 11
A
B
C
Figure 2 RPE, heart rate and ventilation responses during exercise after the ingestion of LGI, HGI and control meal (mean ± SEM). LGI:
Low Glycemic Index; HGI: High Glycemic Index.
a
Significantly different from 10 for the HGI group (P < 0.05),
b
Significantly different from 10 for
the LGI group (P < 0.05),
c
Significantly different from 10 for the control group (P < 0.05).
Jamurtas et al. Journal of the International Society of Sports Nutrition 2011, 8:15
/>Page 5 of 11
A
B
Figure 3 Respiratory quotient and substrate oxidation rate during exercise after the ingestion of LGI, HGI and control meal (mean ±
SEM). LGI: Low Glycemic Index; HGI: High Glycemic Index.
a
Significantly different from 10 for the HGI group (P < 0.05),
b
Significantly different
from 10 for the LGI group (P < 0.05),
c
Significantly different from 10 for the control group (P < 0.05).
Jamurtas et al. Journal of the International Society of Sports Nutrition 2011, 8:15
/>Page 6 of 11
A
B
C
Figure 4 Lactate, glucose and insulin responses during exercise after the ingestion of LGI, HGI and control me al (mean ± SEM). LGI:
Low Glycemic Index; HGI: High Glycemic Index.
a
Significantly different from the first time point for the HGI group (P < 0.05),
b
Significantly
different from the first time point for the LGI group (P < 0.05),
c
Significantly different from the first time point for the control group (P < 0.05);
d
significantly different between HGI and control group at the same time point (P < 0.05).
Jamurtas et al. Journal of the International Society of Sports Nutrition 2011, 8:15
/>Page 7 of 11
seen in De Marco et al. study when the same amount of
carbohydrates was ingested [17]. This response of glu-
cose and insulin is common since the initial increase in
glucose constitutes the main stimulus for the delayed
insulin increase.
Several studies attempted to alter the carbohydrate
composition of a meal prior to exercise in an effort to
improve performance. A number of those studies show
no improvement in exercise performance [19,22,31-33].
Febbraio et al. [19] utilized a similar design with the one
employed in this study and found no significant differ-
ences in exercise performance. Subjects received low
and high glycemic foods (1.0 g. kg
-1
of body weight) 30
min prior to a 120-min submaximal exercise bou t that
was followed by a 30 min time trial. Total work per-
formed during the time trial was similar between the
LGI, the HGI and the control condition. These results
were evident despite the fact that carbohydrate oxida-
tion was greater during the HGI condition. No signifi-
cant differences in exercise performance were noted in
two other studies by the same group [ 31,32] when sub-
jects received LGI and HGI foods (1.0 g. kg
-1
of body
mass) 45 min prior to submaximal exercise that was fol-
lowed again by a time trial. Although differences in glu-
cose and insulin levels were reported following
consumption of the LGI and HGI prior to exercise,
there were no apparent differences in the blood metabo-
lites during the steady state exercise. Thomas et al. [33]
used four meals with different glycemic index foods (30,
36, 73 and 100) that each provided 1.0 g. kg
-1
of body
weight. The meal was consumed 1 h prior to cycling to
exhaustion at 65-70% of VO
2max
. The results showed no
significant differences in time to exhaustion between
trials. No enhancement in exercise performance was
found when low and high glycemic index foods were
provided 3 h prior to exercise even though there was a
relative shift in substrate utilization from carbohydrate
to fat following the LGI meal [22]. As far as exercise
performance is concerned, results from the present
studycoincidewiththoseofearlier reports suggesting
that although pre-exercise GI manipulation affects pre-
exercise glucose and insulin levels, it does not presum-
ably influence the rate of muscle glycogen utilization or
exercise performance. Differences in glucose levels and
Figure 5 b-Endorphin responses during exercise after the ingestion of LGI, HGI and control meal (mean ± SEM).LGI:LowGlycemic
Index; HGI: High Glycemic Index.
a
Significantly different from -30 for the HGI group (P < 0.05),
b
Significantly different from -30 for the LGI group
(P < 0.05),
c
Significantly different from -30 for the control group (P < 0.05).
Jamurtas et al. Journal of the International Society of Sports Nutrition 2011, 8:15
/>Page 8 of 11
carbohydrate and fat oxidation during steady state exer-
cise could influence exercise perform ance during a sub-
sequent short and intense exercise. Evidence indicates
that increasing fat oxidation leads to sparing of glycogen
[34] and spared glycogen or higher blood glucose levels
towards the end of exercise could be used to allow for
high-intensity exercise to be continued for a longer time
affecting exercise performance. In a recent study where
low and high GI foods were consumed 15 minutes prior
to exercise LGI food resulted in higher glucose levels at
the end of exercise and performance was greater com-
pared to a HGI food and a placebo condition [35]. How-
ever, it has to be noted that the subjects in this study
were not professional athletes and an abrupt increase in
the exercise intensity following a steady state exercise
could not be ab le to reveal performance and metabolic
responses accurately. This is a limitation of the present
study and further research should explore performance,
metabolic and b-endorphin responses in well-trained
athletes with a different time trial design (i.e. continues
exercise at a submaximal intensity).
On the other hand, there are several studies that
examined the effects of different GI foods, at different
times prior to exercise, on exercise performance and
substrate metabolism that suggest an improvement of
exercise performance following LGI food consumption
prior to exercise [17,36-40]. Thomas et al. [36] were
amongst the first ones that expressed interest in the role
of GI in sports nutrition. In their study, participants
under four different conditions received three foods of
different GI and water. E ach meal provided 1.0 g. kg
-1
of body weight and was given 60 min prior to cycling to
exhaustion at 65-67% VO
2max
. A significant 20 min pro-
longed workout was performed after consumption of
the LGI foods that was accompanied by more stable glu-
cose levels and higher free fatty acid concent ration dur-
ing exercise. De Marco et al. [17] also showed a 59%
increase in time to exhaustion after a 2-h submaximal
bout in a LGI trial compared with a HGI trial accompa-
nied by a relative hyperglycemia and lower RPE and RQ
[17]. Moore et al. [38] administered low and high GI
foods 45 min prior to a 40 km cycling trial and f ound a
significantly improved performance following the LGI
trial. Higher glucose levels at the end with no differ-
ences in carbohydrate and fat oxidation rates were
noted between the two trials. In the study of Little et al.
[37], improved performance also appeared following the
consumption of LGI and HGI foods (1.3 g. kg
-1
of body
weight) after the end of a simulated soccer game [37].
Finally, consumption of HGI food (1.0 g. kg
-1
of body
weight) resulted in a 12.8% increase in time to exhaus-
tion compared to a placebo trial [20]. Discrepancies
seen in the results reported by the aforementioned stu-
dies may be attributed to differences in meals’ time of
ingestion, amounts of foods (per kilogram of body
weight) or methods of assessment of exercise
performance.
In order to provide the same hydration status prior to
each exercise trial subjects ingested the same amount of
water (300 ml). However, the subjects during the GI
trials ingested more volume (300 ml + GI meal) as com-
pared to the control trial (300 ml). Eventhough the dif-
ferent ingested volume could affect gastric emptying and
subsequently the m etabolic responses this seems unli-
kelysincenoneofthemetabolic variables assessed in
the control trial were changed prior to exercise. How-
ever, the different ingested volume between the control
and the GI trials could have an effect during exercise
and this is something that needs further attention in
future investigations.
Previous research indicates a role of b-endorphin in
metabolism and fatigue perception during exercise. For
example, Fatouros et al. [4] manipulated the carbohy-
drate intake of rats and found a higher concentration of
b-endorphin in plasma and hypothalamus indicating
that this peptide is affected by nutritional factors at per-
ipheral and central level. Fur thermore, manipulating the
levels of peripheral b-endorphin by infusion of this
opioid resulted in significant changes in glucose levels
and pancreatic hormones during exercise further indi-
cating that b-endorphin has effects on carbohydrate
metabolism [6,7,9]. Therefore, it was worth examining
whether intake of carbohydrates of different quality (as
far as glucose response is concerned) will result in dif-
ferent responses in b-endorphin at rest and/or during
exercise. The results from the present study indicate
that ingestion of different GI foods does not result in
different b-endorphin levels at rest and during exercise.
b-endorphin is rapidly responding to an intense bout of
exercise [41]. It was hypothesized that differences in GI
foods would affect metabolism leading to different gly-
cogen levels allowing for higher work output. More
intense work, in turn, could lead to different beta endor-
phin responses. This hypothesis was rejected since no
differences in performance or beta endorph in levels
were observed.
One reason for the inability to observe significant dif-
ferences in b-endorphin at rest following the consump-
tion of GI foo ds could be related to the amount of
carbohydrate consumed. Subjects received carbohydrates
equivalent to 1.5 g. kg
-1
of body weight and it seems
that this amount of carbohydrates is not enough to alter
the response of the pituitary and hypothalamus in the
release of b-endorphin. Only one other study examined
theresponseofb-endorphin to carbohydrate and fat
meals and found similar results with this study since b-
endorphin response changed in the obese but not in
individuals of normal weight [5]. b-Endorphin did not
Jamurtas et al. Journal of the International Society of Sports Nutrition 2011, 8:15
/>Page 9 of 11
increase signifi cantly until at the exha ustion time point.
The inability of b-endorphin to increase during submax-
imal exercise could be related to the exercise intensity
[10]. Previous research indicates tha t b-endorphin con-
tributes to the modulation of pain perception and fati-
gue during exercise [42]. The results from this study
revealed no differences in RPE and b-endorphin levels
between the t hree trials contradicting the results from
the aforementioned study.
Conclusion
In conclusion, ingestion of different GI foods of the
same quantity did not result in differences in exercise
performance or b-endorphin responses at rest and dur-
ing exercise. Future studies should look into the effects
of altering the amount of ingested GI foods and the
time of ingestion on b-endorphin responses at rest and
during exerc ise. Finally , increasing the number of par ti-
cipants and te sting trained subjects or athletes are addi-
tional factors that should be taken into consideration
prior to designing similar studies.
Author details
1
University of Thessaly, Department of Physical Education and Sport Science,
Karies, 42100, Trikala, Greece.
2
Institute of Human Performance and
Rehabilitation, Centre for Research and Technology - Thessaly, Greece.
3
University of Thrace, Department of Physical Education and Sport Science,
69100, Komotini Greece.
4
Semmelweis University, Budapest, Hungary.
5
University of Wolverhampton, School of Sports, Performing Arts and Leisure,
Gorway Road, Walsall, WS1 3BD, UK.
Authors’ contributions
AZJ conceived of the study, collected and analysed data, and wrote the
manuscript. TT collected and analysed data. IF participated in the design of
the study, analysed data and reviewed the manuscript. MGN analysed data
and performed the statistical analysis. VP analysed data and reviewed the
manuscript. CY collected and analysed data. SR analysed data. YK reviewed
the manuscript. All authors reviewed and approved the manuscript.
Competing interests
The authors declare that they have no competing interests.
Received: 15 December 2010 Accepted: 20 October 2011
Published: 20 October 2011
References
1. Hargreaves M: Pre-exercise nutritional strategies: effects on metabolism
and performance. Can J Appl Physiol 2001, 26:S64-70.
2. Marmy-Conus N, Fabris S, Proietto J, Hargreaves M: Preexercise glucose
ingestion and glucose kinetics during exercise. J Appl Physiol 1996,
81:853-857.
3. Tsintzas K, Williams C: Human muscle glycogen metabolism during
exercise. Effect of carbohydrate supplementation. Sports Med 1998,
25:7-23.
4. Fatouros J, Goldfarb AH, Jamurtas AZ: Low carbohydrate diet induces
changes in central and peripheral beta-endorphins. Nutrition Research
1995, 15:, 1683-1694.
5. Zelissen PM, Koppeschaar HP, Thijssen JH, Erkelens DW: Beta-endorphin
and insulin/glucose responses to different meals in obesity. Horm Res
1991, 36:32-35.
6. Angelopoulos TJ, Robertson RJ, Goss FL, Utter A: Insulin and glucagon
immunoreactivity during high intensity exercise under opiate blockade.
Eur J Appl Physiol 1997, 75:132-135.
7. Fatouros IG, Goldfarb AH, Jamurtas AZ, Angelopoulos TJ, Gao J: Beta-
endorphin infusion alters pancreatic hormone and glucose levels during
exercise in rats. Eur J Appl Physiol Occup Physiol 1997, 76:203-208.
8. Jamurtas AZ, Goldfarb AH, Chung SC, Hegde S, Marino C, Fatouros IG: Beta-
endorphin infusion during exercise in rats does not alter hepatic or
muscle glycogen. J Sports Sci 2001, 19:931-935.
9. Jamurtas AZ, Goldfarb AH, Chung SC, Hegde S, Marino C: Beta-endorphin
infusion during exercise in rats: blood metabolic effects. Med Sci Sports
Exerc 2000, 32:1570-1575.
10. Goldfarb AH, Hatfield BD, Armstrong D: Plasma beta-endorphin
concentration: response to intensity and duration of exercise. Med Sci
Sports Exerc 1990, 22:241-4.
11. Goldfarb AH, Hatfield BD, Potts J, Armstrong D: Beta-endorphin time
course response to intensity of exercise: effect of training status. Int J
Sports Med 1991, 12:264-268.
12. Goldfarb AH, Hatfield BD, Sforzo GA, Flynn MG: Serum beta-endorphin
levels during a graded exercise test to exhaustion. Med Sci Sports Exerc
1987, 19:78-82.
13. Goldfarb AH, Jamurtas AZ: Beta-endorphin response to exercise: an
update. Sports Med 1997, 24:8-16.
14. Angelopoulos TJ, Denys BG, Weikart C, Dasilva SG, Michael TJ, Robertson RJ:
Endogenous opioids may modulate catecholamine secretion during
high intensity exercise. Eur J Appl Physiol 1995, 70:195-1999.
15. Hickey MS, Trappe SW, Blostein AC, Edwards BA, Goodpaster B, Grain BW:
Opioid antagonism alters blood glucose homeostasis during exercise in
humans. J
Appl Physiol 1994, 76:2452-60.
16. Jenkins DJ, Wolever TM, Taylor RH, Barker H, Fielden H, Baldwin JM,
Bowling AC, Newman HC, Jenkins AL, Goff DV: Glycemic index of foods: a
physiological basis for carbohydrate exchange. Am J Clin Nutr 1981,
34:362-366.
17. DeMarco HM, Sucher KP, Cisar CJ, Butterfield GE: Pre-exercise carbohydrate
meals: application of glycemic index. Med Sci Sports Exerc 1999,
31:164-170.
18. Earnest CP, Lancaster SL, Rasmussen CJ, Kerksick CM, Lucia A,
Greenwood MC, Almada AL, Cowan PA, Kreider RB: Low vs. high glycemic
index carbohydrate gel ingestion during simulated 64-km cycling time
trial performance. J Strength Cond Res 2004, 18:466-472.
19. Febbraio MA, Keenan J, Angus DJ, Campbell SE, Garnham AP: Preexercise
carbohydrate ingestion, glucose kinetics, and muscle glycogen use:
effect of the glycemic index. J Appl Physiol 2000, 89:1845-1851.
20. Tokmakidis SP, Karamanolis IA: Effects of carbohydrate ingestion 15 min
before exercise on endurance running capacity. Appl Physiol Nutr Metab
2008, 33:441-449.
21. Siu PM, Wong SH: Use of the glycemic index: effects on feeding patterns
and exercise performance. J Physiol Anthropol Appl Human Sci 2004,
23:1-6.
22. Wee SL, Williams C, Gray S, Horabin J: Influence of high and low glycemic
index meals on endurance running capacity. Med Sci Sports Exerc 1999,
31:393-399.
23. Kindermann W, Schnabel A, Schmitt WM, Biro G, Cassens J, Weber F:
Catecholamines, growth hormone, cortisol, insulin, and sex hormones in
anaerobic and aerobic exercise. Eur J Appl Physiol Occup Physiol 1982,
49:389-399.
24. Lundgren R, Maier L, Rose C, Balkissoon R, Newman L: Indirect and Direct
Gas Exchange at Maximum Exercise in Beryllium Sensitization and
Disease. Chest 2001, 120:1702-1708.
25. Coyle EF, Coggan AR, Hemmert MK, Ivy JL: Muscle glycogen utilization
during prolonged strenuous exercise when fed carbohydrate. J Appl
Physiol 1986, 61:165-172.
26. Kalafati M, Jamurtas AZ, Nikolaidis MG, Paschalis V, Theodorou AA,
Sakellariou GK, Koutedakis Y, Kouretas D: Ergogenic and antioxidant
effects of spirulina supplementation in humans. Med Sci Sports Exerc
2010, 42:142-151.
27. Maughan RJ, Goodburn R, Griffin J, Irani M, Kirwan JP, Leiper JB,
MacLaren DP, McLatchie G, Tsintsas K, Williams C: Fluid replacement in
sport and exercise– a consensus statement. Br J Sports Med 1993, 27:34-35.
28. Jeukendrup AE, Wallis GA: Measurement of substrate oxidation during
exercise by means of gas exchange measurements. Int J Sports Med 2005,
1:S28-37.
29.
Borg G: Simple rating methods for estimation of perceived exertion. In
Physical Work and Effort. Edited by: G. Borg. New York; 1975:39-46.
Jamurtas et al. Journal of the International Society of Sports Nutrition 2011, 8:15
/>Page 10 of 11
30. Dill DB, Costill DL: Calculation of percentage changes in volumes of
blood, plasma, and red cells in dehydration. J Appl Physiol 1974,
37:247-248.
31. Febbraio MA, Stewart KL: CHO feeding before prolonged exercise: effect
of glycemic index on muscle glycogenolysis and exercise performance. J
Appl Physiol 1996, 81:1115-1120.
32. Sparks MJ, Selig SS, Febbraio MA: Pre-exercise carbohydrate ingestion:
effect of the glycemic index on endurance exercise performance. Med
Sci Sports Exerc 1998, 30:844-849.
33. Thomas DE, Brotherhood JR, Miller JB: Plasma glucose levels after
prolonged strenuous exercise correlate inversely with glycemic response
to food consumed before exercise. Int J Sport Nutr 1994, 4:361-373.
34. Frayn K: Metabolic Regulation: A Human Perspective. Oxford, UK, Wiley-
Blackwell; 2003, 213-52.
35. Karamanolis IA, Laparidis KS, Volaklis KA, Douda HT, Tokmakidis SP: The
Effects of Pre-Exercise Glycemic Index Food on Running Capacity. Int J
Sports Med 2011, 32:666-671.
36. Thomas DE, Brotherhood JR, Brand JC: Carbohydrate feeding before
exercise: effect of glycemic index. Int J Sports Med 1991, 12:180-186.
37. Little JP, Chilibeck PD, Ciona D, Vandenberg A, Zello GA: The effects of
low- and high-glycemic index foods on high-intensity intermittent
exercise. Int J Sports Physiol Perform 2009, 4:367-380.
38. Moore LJ, Midgley AW, Thomas G, Thurlow S, McNaughton LR: The effects
of low- and high-glycemic index meals on time trial performance. Int J
Sports Physiol Perform 2009, 4:331-344.
39. Moore LJ, Midgley AW, Thurlow S, Thomas G, Mc Naughton LR: Effect of
the glycaemic index of a pre-exercise meal on metabolism and cycling
time trial performance. J Sci Med Sport 2010, 13:182-188.
40. Wong SH, Siu PM, Chen YJ, Lok A, Morris J, Lam CW: Effect of Glycemic
Index of Pre-exercise Carbohydrate Meals on Running Performance. Eur J
Sport Sci 2008, 8:23-33.
41. Brooks S, Burrin J, Cheetham ME, Hall GM, Yeo T, Williams C: The responses
of the catecholamines and beta-endorphin to brief maximal exercise in
man. Eur J Appl Physiol Occup Physiol 1988, 57:230-234.
42. Salomon P, Mazurek W: Levels of B-endorphin in patients with silent
myocardial ischemia. Pol Arch Med Wewn 1994, 91:446-450.
doi:10.1186/1550-2783-8-15
Cite this article as: Jamurtas et al.: The effects of low and high glycemic
index foods on exercise performance and beta-endorphin responses.
Journal of the International Society of Sports Nutrition 2011 8:15.
Submit your next manuscript to BioMed Central
and take full advantage of:
• Convenient online submission
• Thorough peer review
• No space constraints or color figure charges
• Immediate publication on acceptance
• Inclusion in PubMed, CAS, Scopus and Google Scholar
• Research which is freely available for redistribution
Submit your manuscript at
www.biomedcentral.com/submit
Jamurtas et al. Journal of the International Society of Sports Nutrition 2011, 8:15
/>Page 11 of 11