báo cáo khoa học:" Challenges in comparing the quality of life of older people between ethnic groups, and the implications for national well-being indicators: a secondary analysis of two cross-sectional surveys" ppsx
Bạn đang xem bản rút gọn của tài liệu. Xem và tải ngay bản đầy đủ của tài liệu tại đây (398.25 KB, 15 trang )
Health and Quality of Life
Outcomes
This Provisional PDF corresponds to the article as it appeared upon acceptance. Fully formatted
PDF and full text (HTML) versions will be made available soon.
Challenges in comparing the quality of life of older people between ethnic
groups, and the implications for national well-being indicators: a secondary
analysis of two cross-sectional surveys
Health and Quality of Life Outcomes 2011, 9:109
doi:10.1186/1477-7525-9-109
Robert L Grant ()
Ann Bowling ()
ISSN
Article type
1477-7525
Short report
Submission date
23 June 2011
Acceptance date
5 December 2011
Publication date
5 December 2011
Article URL
/>
This peer-reviewed article was published immediately upon acceptance. It can be downloaded,
printed and distributed freely for any purposes (see copyright notice below).
Articles in HQLO are listed in PubMed and archived at PubMed Central.
For information about publishing your research in HQLO or any BioMed Central journal, go to
/>For information about other BioMed Central publications go to
/>
© 2011 Grant and Bowling ; licensee BioMed Central Ltd.
This is an open access article distributed under the terms of the Creative Commons Attribution License ( />which permits unrestricted use, distribution, and reproduction in any medium, provided the original work is properly cited.
Challenges in comparing the quality of life of older people between ethnic groups, and the
implications for national well-being indicators: a secondary analysis of two cross-sectional surveys
Robert L Grant*1, Ann Bowling1
* Corresponding author
1
Faculty of Health and Social Care Sciences, Kingston University and St George’s, University of
London, United Kingdom.
Email addresses:
RLG:
AB:
Address for correspondence:
Robert Grant
Faculty of Health and Social Care Sciences
Kingston University and St George’s University of London
Cranmer Terrace
London
SW17 0RE
United Kingdom
Abstract:
Background:
The current international interest in well-being indicators among governmental agencies means that
many quality of life scales are potential components of such national indicator sets. Measuring wellbeing in minority groups is complex and challenging. Scales are available that have been validated in
specific parts of the population, such as older people. However, validation among combinations of
minority groups, such as older adults of ethnic minority backgrounds, is lacking.
Findings:
We pooled data from two surveys of older adults in Great Britain: one conducted among White
British people, and one among four ethnic minority groups. Quality of life was measured by the
Older People’s Quality of Life (OPQOL); Control, Autonomy, Self-realisation, Pleasure (CASP-19); and
World Health Organization Quality of Life scale for older people (WHOQOL-OLD). We found
differences, some significant, between groups in terms of self-reported importance of various
aspects of quality of life. A regression model of each total quality of life scale revealed greater
unexplained variability in the White British group than the others. Principal components analysis
within each ethnic group’s data showed considerable differences in the correlation structures.
Conclusions:
There are differences between ethnic groups that are consistent across the three scales and are not
explained by a battery of predictor variables. If scales such as these are used to compare quality of
life between ethnic groups, or equivalently between geographical regions, the different results in
each group are liable to bias any comparison which could lead to inequitable policy decisions.
Keywords:
Older people, ethnicity, quality of life, socio-economic status, well-being.
Introduction:
Policy makers world-wide are increasingly interested in promoting and measuring societal wellbeing, which is a dynamic, multi-faceted concept with social and psychological dimensions,
overlapping with measures of quality of life (QOL) [1-3]. A great deal of the well-being of any nation
will be determined by physical and mental health and existing QOL scales are being examined as
potential well-being indicators. The aim of incorporating well-being measures into governmental
policy is hopefully to stimulate improvements over time and to promote equity, as defined most
recently by ongoing work in the United Kingdom and Europe [4-5]. The well-being of minority and
marginalised groups, whose members are typically disadvantaged, will be key to success, but
creating a set of indicators that is valid for such groups is a considerable challenge. Official statistics
struggle to include accurate information on “hard to reach” groups, often relying on assumptions
and extrapolation. Bajekal and colleagues reported differences between ethnic groups in seven
facets of QOL among older people in a national survey in England and Wales [6]. It is unknown
whether such variations are attributable to differences in priorities or true underlying QOL. Most
measures have been developed largely by experts with some lay input, although more recently
developed QOL scales have used a grounded approach incorporating participants’ priorities [7].
Aims:
In this paper, we investigate the challenges in applying QOL scales to different ethnic groups. We
have considered three QOL measures which are specifically validated for older people and sought to
answer three questions:
•
Do ethnic groups differ in the importance they allocate to different aspects of well-being?
•
Are differences in self-reported importance associated with QOL, is this affected by
individuals' characteristics, and does this differ between ethnic groups?
•
Does the pattern of variability between individuals, measured by correlations among the
QOL questions, differ between ethnic groups or age bands?
Data sources:
We analysed data from two surveys of community-dwelling older people in England, one among
White British people and one among ethnic minorities. In each of these surveys, three quality of life
measures were collected (OPQOL, CASP and WHOQOL-OLD [7]), along with covariates and subjective
importance of seven aspects of well-being. The surveys were the ONS Omnibus (n=555 white British
participants over age 65, 16 from other ethnic groups were set aside), and Ethnibus (ethnic minority
doorstep survey stratified by electoral ward on the basis of Census data: n=152 Indian, 117 Pakistani,
86 Caribbean, 45 Chinese, all aged over 60) [8]. Both were based on home interviews with trained
interviewers during 2007-8. For this reason, data were rarely missing: 931/955 had complete data
for OPQOL, 942 for CASP and 905 for WHOQOL-OLD. Original data were compiled and processed in
SPSS software; analyses for this paper were carried out in Stata version 11.
Findings:
Self-reported importance of topics:
Participants’ self-reported importance ratings for each of seven aspects of well-being (health, social,
independence, home, psychological, financial, leisure) were collected by the categories “less
important”, “important” and “very important”. We considered proportional odds models for ordinal
data but found the proportionality assumption very unlikely based on graphs of cumulative log-odds,
and so the ratings were dichotomised into less important vs. (important or very important). Using
mixed-effects logistic regression (which adjusts for unexplained variation between individuals),
adjusting for age (negative correlation for all topics) and household size (positive correlation for all
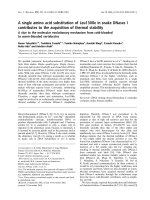
topics), we found that ethnic groups differed in the reported importance [Figure 1]. The largest
differences are between White British participants (almost all of whom rate all the topics as
important) and the others, though the Chinese participants returned significantly higher importance
in some topics. Adjusting for the covariates inflated ethnic differences, which is likely to be because
ethnic minorities were on average younger and living in larger households.
Association between importance and quality of life:
Importance was compared with OPQOL sub-scale scores through rank correlations because the
topics relate directly to the sub-scales. Greater importance of topics is correlated with higher OPQOL
scores in the health (rho=0.40), social (rho=0.48), independence (rho=0.60), home (rho=0.46) and
psychological (rho=0.42) sub-scales. The others were weaker: financial (rho=0.13) and leisure
(rho=0.24). Some of this correlation may be mediated by cultural differences or socio-economic
status.
Linear regression models were constructed for each of the QOL total scores (OPQOL, CASP and
WHOQOL-OLD), incorporating survey oversampling by inverse probability weighting (for each
combination of ethnic group and region). Assumptions were examined graphically. An assumption
about including mixed race British-Caribbean numbers from the 2001 UK Census within the sampling
frame for “Caribbean” participants was tested by sensitivity analysis, and found not to affect results.
Geographical region, age, ethnic group, housing tenure and some of the importance ratings were
significant predictors of total QOL scores. Predictors were very similar for the three scales [Table 1],
though the weaker effect of ethnicity on the CASP scores may arise because this scale was not tested
in ethnic minority groups (in the British context) [7]. Where interactions are seen between ethnicity
and another predictor, this is never solely attributable to White British vs. all others, so in none of
the analyses can this mask a methodological difference between the Omnibus and Ethnibus surveys.
Gender, first language, marital status and the number of adults living in the household were also
considered but were not significant predictors of any of the QOL scales. Socio-economic status
cannot be included fully in the regression because there are different measures in the two surveys,
but we have used housing tenure as a proxy. Rank correlations within each survey's data suggest
that socio-economic status is weakly positively correlated with all three measures in Omnibus, but
not associated with any of the measures in Ethnibus. Whether this is due to ethnicity or an artefact
of the particular social class measure is debatable.
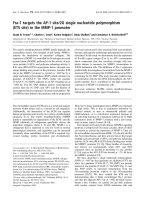
Quality of life differs markedly between ethnic groups, even after adjusting for the predictors listed
above. The standard deviations of the QOL scores differ between ethnic groups, and the models do
not account for all of this, leading to heteroscedasticity in all three models (unexplained variation
increases with higher predicted quality of life). This could arise because of the relative homogeneity
of the individuals’ characteristics in the white British group. This suggests that there are differences
between the ethnic groups that we cannot fully explain. [Figure 2] The weak correlation with socioeconomic status suggests that obtaining a better measure will not solve the problem alone.
Patterns of variability within each ethnic group and age band:
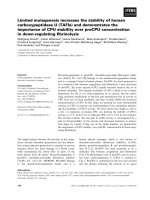
Principal components analyses were conducted on individual OPQOL questions for different ethnic
groups and in 5-year age bands, and the resulting ideal ethnicity-specific summary weights were
compared [9]. Differences in these weights suggest that individuals in different groups differ in
subtle ways that cannot be fully captured in a single composite measure [Figure 3].
Conclusions:
We have seen that our data do not provide simple solutions to the problem of making fair
comparisons between ethnic groups. Regional comparisons will similarly be affected because of
differing population characteristics. There are two main limitations. Firstly, we cannot fully adjust for
socio-economic status, which is known to be difficult to measure in retired people [10]. We have
used housing tenure as a proxy because of its availability in the data but we recognise that it is a
coarse indicator. Secondly, we cannot rule out differences between ethnic groups arising from
differences between the two surveys. There were only 16 people in Omnibus who did not regard
themselves as White British, not enough to allow us to test this by comparing them with Ethnibus.
The Ethnibus participants were younger on average than the Omnibus, but we have adjusted for age
in our analyses.
The differences seen between ethnic groups could as plausibly arise from cultural norms,
expectations or semantics, as from community structures and economic disadvantage, but
regardless of the reason, the fact that inter-group differences can be distorted is enough to raise
concern. The WHOQOL-OLD scale was developed by modifying a generic QOL scale for adults and
tested by a series of convenience samples internationally, which may explain its detection of fewer
differences between ethnic groups compared to OPQOL. Before any QOL scale can be used as a wellbeing measure, it would need to be developed or tested in a variety of socio-cultural groups in the
population, not simply analysed by groups to assess differences. The potential exists for policy
informed by well-being statistics inadvertently to increase inequity or assign resources inefficiently
because of over-simplification. As we have seen problems in comparing ethnic minorities' wellbeing, we can also expect problems in other minority and marginalised groups such as older people,
children, recent immigrants, mental health service users, those whose first language is not English,
those living in institutional care, homeless people and disabled people including communication
difficulties.
List of abbreviations:
CASP-19: Control, Autonomy, Satisfaction, Pleasure scale, OPQOL: Older People’s Quality of Life
scale, QOL: quality of life, WHOQOL-OLD: World Health Organization Quality of Life scale for older
people.
Competing interests:
Both authors declare that they have no competing interests.
Authors’ contributions:
Both authors contributed to writing, RG carried out secondary data analysis and AB was responsible
for data collection and processing. Both authors have read and approved the final manuscript.
References:
1.
2.
3.
4.
5.
6.
7.
8.
9.
10.
Lawton, M.P., Environment and other determinants of well-being in older people.
Gerontologist, 1983. 23: p. 349-357.
World Health Organisation, Active ageing: a policy framework. 2002: Geneva.
Bowling, A., Ageing well: quality of life in old age. 2005, Maidenhead: Open University Press.
Office for National Statistics. Measuring national wellbeing. 2010; Available from:
/>New Economics Foundation. Measuring well-being in Europe. 2011; Available from:
/>Bajekal, M., et al., Ethnic differences in influences on quality of life at older ages: a
quantitative analysis. Ageing and society, 2004. 24: p. 709-728.
Bowling, A., The psychometric properties of the Older People's Quality Of Life questionnaire,
compared with the CASP-19 and the WHOQOL-OLD. Current Gerontology and Geriatrics
Research, 2009. 2009(298950).
Bowling, A., Perceptions of active ageing in Britain: divergences between minority ethnic and
whole population samples. Age and Ageing, 2009. 38(6).
Streiner, D. and G. Norman, Health measurement scales: a practical guide to their
development and use (3rd edition). 2003: Oxford University Press.
Grundy, E. and G. Holt, The socioeconomic status of older adults: how should we measure it
in studies of health inequalities. Journal of Epidemiology and Community Health, 2001. 55: p.
895-904.
Figure legends:
Figure 1: Differences by ethnicity in perceived importance of different aspects of well-being (bars are
95% confidence intervals)
Figure 2: The best statistical model does not explain enough of the variability in the white British
participants
Figure 3: Weights from ethnicity-specific principal components analyses differ notably as seen in this
heatmap; age-specific differences are smaller. High weights (at the red end of the spectrum) indicate
OPQOL questions on which individuals differ more, and hence the questions contribute strongly to
an optimum summary score for that group.
Table 1: Linear regression coefficients (Region and ethnicity had significant interactions predicting
OPQOL and CASP. Importance of leisure aspects and ethnicity had significant interactions predicting
OPQOL and CASP. Importance of social aspects and ethnicity had significant interactions predicting
CASP and WHOQOL-OLD.)
Predictor
Ethnic group:
Region:
Social aspects:
Home
aspects:
OPQOL
Coefficient
p-value
(95% CI)
White British (baseline)
Indian
-11.1
<0.001
(-13.5, -8.7)
Pakistani
-9.9
<0.001
(-12.5, -7.3)
Caribbean
-6.1
<0.001
(-8.8, -3.4)
Chinese
-2.5
0.12
(-5.5, 0.6)
London (baseline)
Midlands
4.7
<0.001
(2.6, 6.8)
South
5.5
<0.001
(3.4, 7.7)
North
2.8
0.01
(0.7, 4.8)
Wales /
3.5
0.002
Scotland
(1.3, 5.8)
“very important” (baseline)
“important”
-3.5
<0.001
(-4.5, -2.5)
“not
-8.6
<0.001
important”
(-10.0, -7.2)
“very important” (baseline)
“important”
Tenancy:
Age (years):
-2.3
(-3.1, -1.5)
“not
-5.4
important”
(-6.5, -4.4)
“very important” (baseline)
<0.001
“important”
Leisure
aspects:
<0.001
“important”
Psychological
aspects:
-2.7
(-3.6, -1.8)
“not
-10.9
important”
(-12.6, -9.1)
“very important” (baseline)
<0.001
-3.8
(-4.7, -2.8)
“not
-9.2
important”
(-10.6, -7.8)
Owned (baseline)
Rented
-6.3
(-7.2, -5.5)
Free
-2.9
(-4.7, -1.1)
<0.001
<0.001
<0.001
<0.001
0.002
Not significant
CASP-19
Coefficient
p-value
(95% CI)
WHOQOL-OLD
Coefficient
p(95% CI)
value
3.8
(2.2, 5.4)
-0.1
(-1.8, 1.7)
0.7
(-1.0, 2.5)
4.5
(2.0, 6.9)
<0.001
-9.3
(-10.6, -8.1)
-8.0
(-9.6, -6.4)
-9.4
(-10.5, -8.2)
-3.2
(-4.9, -1.4)
2.1
(1.0, 3.3)
3.2
(2.0, 4.3)
1.6
(0.4, 2.7)
2.4
(1.1, 3.7)
<0.001
-2.1
(-2.7, -1.6)
-5.0
(-6.1, -4.0)
<0.001
-0.3
(-0.9, 0.2)
-4.1
(-5.2, -3.0)
0.25
-0.6
(-1.1, -0.1)
-2.2
(-3.0, -1.4)
0.02
-2.0
(-2.5, -1.4)
-6.9
(-7.8, -6.1)
<0.001
-2.1
(-2.6, -1.5)
-1.9
(-3.0, -0.9)
-0.08
(-0.11, -0.04)
<0.001
0.95
0.79
<0.001
<0.001
<0.001
<0.001
<0.001
Not significant
<0.001
0.01
<0.001
<0.001
<0.001
-4.9
(-5.7, -4.0)
-10.3
(-11.7, -8.9)
<0.001
-1.6
(-2.3, -0.8)
-4.7
(-6.0, -3.4)
<0.001
<0.001
<0.001
Not significant
<0.001
<0.001
<0.001
<0.001
-0.2
(-1.0, 0.6)
-4.4
(-5.7, -3.2)
0.57
-5.4
(-6.3, -4.6)
-4.1
(-5.3, -3.0)
<0.001
<0.001
<0.001
Not significant
Figure 1
Figure 2
Figure 3