báo cáo khoa học:" Health-related quality of life and self-related health in patients with type 2 diabetes: Effects of group-based rehabilitation versus individual counselling" docx
Bạn đang xem bản rút gọn của tài liệu. Xem và tải ngay bản đầy đủ của tài liệu tại đây (192.09 KB, 21 trang )
This Provisional PDF corresponds to the article as it appeared upon acceptance. Fully formatted
PDF and full text (HTML) versions will be made available soon.
Health-related quality of life and self-related health in patients with type 2
diabetes: Effects of group-based rehabilitation versus individual counselling
Health and Quality of Life Outcomes 2011, 9:110 doi:10.1186/1477-7525-9-110
Eva S Vadstrup ()
Anne Frolich ()
Hans Perrild ()
Eva Borg ()
Michael Roder ()
ISSN 1477-7525
Article type Research
Submission date 14 June 2011
Acceptance date 7 December 2011
Publication date 7 December 2011
Article URL />This peer-reviewed article was published immediately upon acceptance. It can be downloaded,
printed and distributed freely for any purposes (see copyright notice below).
Articles in HQLO are listed in PubMed and archived at PubMed Central.
For information about publishing your research in HQLO or any BioMed Central journal, go to
/>For information about other BioMed Central publications go to
/>Health and Quality of Life
Outcomes
© 2011 Vadstrup et al. ; licensee BioMed Central Ltd.
This is an open access article distributed under the terms of the Creative Commons Attribution License ( />which permits unrestricted use, distribution, and reproduction in any medium, provided the original work is properly cited.
Health-related quality of life and self-related health in patients
with type 2 diabetes: Effects of group-based rehabilitation
versus individual counselling
Eva S.Vadstrup
1§
, Anne Frølich
2
, Hans Perrild
1
, Eva Borg
3
& Michael Røder
1,4
1
Department of Endocrinology and Gastroenterology, Bispebjerg University Hospital, Copenhagen,
Denmark
2
Department of Integrated Healthcare, Bispebjerg University Hospital, Copenhagen, Denmark
3
Health Care Centre Østerbro, Copenhagen, Denmark
4
Department of Cardiology and Endocrinology, Hillerød University Hospital, Hillerød, Denmark
§
Corresponding author
Email addresses:
ESV:
AF:
HP:
EB:
MR:
1
Abstract
Background
Type 2 diabetes can seriously affect patients’ health-related quality of life and their self-rated
health. Most often, evaluation of diabetes interventions assess effects on glycemic control with little
consideration of quality of life. The aim of the current study was to study the effectiveness of
group-based rehabilitation versus individual counselling on health-related quality of life (HRQOL)
and self-rated health in type 2 diabetes patients.
Methods
We randomised 143 type 2 diabetes patients to either a six-month multidisciplinary group-based
rehabilitation programme including patient education, supervised exercise and a cooking-course or
a six-month individual counselling programme. HRQOL was measured by Medical Outcomes
Study Short Form 36-item Health Survey (SF-36) and self-rated health was measured by Diabetes
Symptom Checklist – Revised (DCS-R).
Results
In both groups, the lowest estimated mean scores of the SF36 questionnaire at baseline were
“vitality” and “general health”. There were no significant differences in the change of any item
between the two groups after the six-month intervention period. However, vitality-score increased
5.2 points (p=0.12) within the rehabilitation group and 5.6 points (p=0.03) points among individual
counselling participants.
In both groups, the highest estimated mean scores of the DSC-R questionnaire at baseline were
“Fatigue” and “Hyperglycaemia”. Hyperglycaemic and hypoglycaemic distress decreased
significantly after individual counselling than after group-based rehabilitation (difference -0.3
points, p=0.04). No between-group differences occurred for any other items. However, fatigue
distress decreased 0.40 points within the rehabilitation group (p=0.01) and 0.34 points within the
individual counselling group (p<0.01). In the rehabilitation group cardiovascular distress decreased
0.25 points (p=0.01).
Conclusions
2
A group-based rehabilitation programme did not improve health-related quality of life and self-rated
health more than an individual counselling programme. In fact, the individual group experienced a
significant relief in hyper- and hypoglycaemic distress compared with the rehabilitation group.
However, the positive findings of several items in both groups indicate that lifestyle intervention is
an important part of the management of type 2 diabetes patients.
3
Background
Type 2 diabetes can seriously affect patients’ health-related quality of life and their self-rated
health. People with diabetes experience a decreased quality of life compared with people with no
chronic illness but a better quality of life than people with most other serious chronic diseases [1].
The presence of two or more diabetes-related complications is associated with worsened quality of
life [2] and lower scores of quality of life is associated with greater severity of complications for
patients with type 2 diabetes [3]. Most often, evaluation of diabetes interventions assess effects on
glycated haemoglobin (HbA
1c
) with little consideration of quality of life [4]. However, there is a
growing interest in the assessment of health-related quality of life (HRQOL) in type 2 diabetes. An
increasing number of type 2 diabetes trials, including studies evaluating diabetes self-management
education, comprise measurements of quality of life [5]. The association between well-being and
glycaemic control have been assessed in several studies. Some studies showed a positive effect on
HRQOL in addition to improved glycaemic control [6-8] whereas others indicated a neutral or
negative effect on HRQOL [9, 10]. It is unknown whether impaired glycaemic control leads to
lower quality of life or lower quality of life leads to impaired glycaemic control.
Group-based educational settings often encourage interaction and interpersonal dynamics and invite
to social modelling compared to individual settings [11]. A small number of studies have compared
the effects of group-based versus individual-based diabetes self-management programmes on
HRQOL, but they found no significant differences between the groups [12, 13]. Since quality of life
is a multivariate phenomenon it has been suggested that evaluation should assess both generic and
diabetes-specific elements of impairment including physical, emotional and social dimensions [14].
The Copenhagen Type 2 Diabetes Rehabilitation Project - a randomised controlled trial – was
designed to study whether a six-month group-based rehabilitation programme improved glycaemic
control in patients with type 2 diabetes compared with an individual counselling programme. The
intervention used an empowerment-based approach and goal setting techniques [15]. Programme
goals were to encourage behaviour changes, teach patients appropriate ways to exercise and
improve nutrition, and strengthen patients’ self-management skills. Previously, we demonstrated
that both the rehabilitation programme and the individual counselling programme resulted in
improved HbA
1c
levels, blood pressure and weight after the six months intervention period.
However, HbA
1c
decreased significantly more after the individual counselling programme [16].
Secondarily we hypothesised that a group-based rehabilitation programme would result in a greater
improvement in HRQOL and self-rated health than an individual counselling programme. The
4
current paper evaluates the change in HRQOL and self-rated health after the six-month intervention
period.
Methods
Study population
A detailed study design of The Copenhagen Type 2 Diabetes Rehabilitation Project have been
published elsewhere [17]. Patients were recruited between August 2006 and February 2008 from
our local outpatient clinic and general practitioners and by posting advertisements in local
newspapers. Key inclusion criteria were: known or newly diagnosed type 2 diabetes, baseline
HbA
1c
value between 6.8% and 10.0%, and ability to read and understand the Danish language. Key
exclusion criteria were age less than 18 years, severe heart, liver or kidney disease, foot ulcers, and
incurable cancer. Patients gave informed consent to participate in the study, which conformed to the
principles of the Declaration of Helsinki, after which a baseline HbA
1c
was drawn. Patients fulfilling
the inclusion criteria were randomised within three weeks stratified by gender and age. A person not
participating in the study created a randomisation list. The investigator randomised and stratified the
patients at the baseline visit using consecutively numbered sealed envelopes marked with gender
(male or female) and age (< 55 years or >= 55 years). Patients were randomised to the group-based
rehabilitation programme (rehabilitation group) at Healthcare Centre Østerbro or to the individual
counselling programme (individual group) at the Diabetes Outpatient Clinic, Bispebjerg University
Hospital. Neither patients nor study personnel were blinded to treatment assignment.
Interventions
The group-based rehabilitation programme, conducted at a primary health care centre, was
founded on evidence-based clinical guidelines [18] and emphasized a multidisciplinary approach.
The programme used empowerment-based principles and goal-setting involving patient
collaboration in order to improve the patients’ knowledge and self-awareness [15]. Before patients
entered the programme they participated in a motivational interview and set personal goals.
Personnel were trained and supervised in the use of the motivational interviewing technique by an
expert psychologist [19].
The programme consisted of an educational component of 90-minutes group sessions held weekly
for a total of six weeks. Sessions were limited to eight patients and were taught by a nurse, a
5
physiotherapist, a podiatrist, and a dietician. The educational curriculum included: the
pathophysiology of diabetes, blood glucose self-monitoring, dietary instructions, the importance of
physical activity, weight loss and smoking cessation, neuropathy, foot examinations, hypertension,
complications, and medications [18]. A 12-week supervised exercise component consisted of 90-
minutes sessions twice a week that included both aerobic and resistance exercise. The sessions were
group-based, but a physiotherapist tailored an individual exercise programme for each patient.
Dietary education included two three-hour group-based cooking classes and one two-hour session in
a local supermarket.
The education, exercise, and dietary interventions could overlap and their sequence could differ
from patient to patient. Goal achievement was evaluated in collaboration with the patients at the end
of the intervention programme and one and three months after programme completion by telephone
contacts.
The individual counselling programme, conducted at the diabetes outpatient clinic at Bispebjerg
University Hospital, was based on the same clinical guidelines and the empowerment approach as
in the primary health care centre [15, 18]. The programme consisted of individual consultations
with a diabetes nurse specialist, a dietician, and a podiatrist over a period of six months. All patients
consulted the same nurse and dietician.
Patients participated in four one-hour sessions of individual counselling with a diabetes nurse
specialist, who had a bachelor’s degree in education and was trained in motivational interviewing
[19]. Using the patients’ own stories patients received personalized information and guidance about
type 2 diabetes, medications, risk factors, and late complications, blood-glucoses self-monitoring,
and increasing physical activity to the recommended level of 30 minutes of daily exercise. Over the
same time period, patients participated in three individual counselling sessions with a dietician who
was also trained in motivational interviewing [18]. At the initial hour-long visit, patients set
personal goals and, in collaboration with the dietician, developed a dietary plan based on
biochemical, anthropometrical and medical records and patients’ motivation and attitudes. The
action plan, progress towards meeting it, and goals were evaluated at the two follow-up visits, each
of which lasted 30 minutes.
6
The endocrinologist or general practitioner caring for patients in both interventions prior to the
study continued to provide diabetes management during and after the intervention; however, they
were not part of the study team.
Measurements
Patients filled in two self-administered questionnaires at baseline and at completion of the
intervention. Patients were briefly provided with instructions on how to answer the questions.
The Medical Outcome Study 36-item Short Form Health Survey (SF-36 version 1.0) is a multi-
purpose, short-form health survey with 36 questions that measure 8 conceptual domains: physical
functioning, physical limitation, bodily pain, general health, vitality, social functioning, emotional
limitation, and mental health [20]. The raw scores in each domain were transformed into 0 to 100
scales by the following calculation: (actual score - lowest possible score)/(possible score range) x
100. A higher score on SF-36 indicates better quality of life. The SF-36 has been proven useful in
surveys of general and specific populations, comparing the relative burden of diseases, and in
differentiating the health improvements produced by a wide range of different treatments [21]. The
questionnaire has been translated into Danish and thoroughly validated in a Danish population [22].
As the SF-36 questionnaire is a generic measure, as opposed to one that targets a specific disease or
treatment group, we included a diabetes specific questionnaire as a supplement. The Diabetes
Symptom Checklist – Revised (DSC-R) is a self-report questionnaire measuring the occurrence and
perceived burden of diabetes-related symptoms [23]. The DSC-R consists of 34 questions grouped
into 8 symptom subscales: hyperglycaemia, hypoglycaemia, psychological cognitive functioning,
psychological fatigue, cardiovascular symptoms, neuropathic pain, neuropathic sensory, and
ophthalmologic functioning. Patients indicate whether they experienced any of the listed symptoms
during the past month. For each symptom experienced, patients indicate the extent to which these
symptoms were burdensome (ranging from “not at all”, coded as 1, to “extremely”, coded as 5). The
eight subscale scores were calculated by summating the item scores, divided by the number of items
of that subscale. A total symptom score was calculated from responses from all item score divided
by 34. A lower score on DSC-R indicates less psychological and physiological distress. The DSC-R
has been described to be valid, reliable and responsive to change and to be the only scale that
7
appears to evaluate physical functioning in type 2 diabetes patients in a broad, comprehensive
manner [24, 25].
If patients skipped a question in the questionnaires the missing value was calculated as an average
of rest of the values in the particular domain or subscale. A detailed description of the recorded
demographic, laboratory, and clinical parameters has previously been published [16].
Statistical analyses
The sample size calculation was based on the primary outcome (HbA
1c
) in the study. Using a target
between-group absolute difference in HbA
1c
of 0.7%, a standard deviation of 1.3%, a power of 0.9,
and a two-sided α of 0.05, we calculated a necessary sample size of 80 patients in each group.
However, due to time and resources constraints, we were able to randomize 70 patients to the
rehabilitation group and 73 patients to the individual group.
All available data were used in the analysis. Since 24 patients did not complete the baseline
questionnaires it was not possible to include them in the intention-to-treat analysis. Hence, an
intention-to-treat analysis was performed including patients lost to follow-up.
Differential changes between the two groups were analysed using a two-way analysis of variance
with adjustment for baseline values in SAS, version 9.1 (Cary, NC). The study statistician
performing the data analyses was blinded to patients’ assignment to the rehabilitation group or
individual group. Statistical significance level was set at p<0.05.
Statement of ethics
The Danish National Committee on Biomedical Research Ethics and the Danish Data Protection
Agency approved the study protocol. ClinicalTrials.gov registration number: NCT00284609.
Results
Of 264 individuals who were screened, 143 met the inclusion criteria and were randomised. The
vast majority of screen failures were due to HbA
1c
below 6.8%. Baseline characteristics of patients
8
in the two groups were comparable (Table 1). Twenty-eight (20%) patients dropped out from the
study (12 from the rehabilitation group and 16 from the individual group) of which six patients
agreed to participate in the six-month follow-up visit. Reasons for dropping out were mainly due to
time constraint and disappointment with the randomisation. The baseline characteristics of the
patients who were missing or lost to follow-up did not differ significantly from the overall baseline
characteristics of patients who completed the interventions, with the single exception that drop-outs
in the individual group had higher weight (114.0 kg versus 95.0 kg, p<0.05) and waist
circumference (120.2 kg versus 106.1 kg, p<0.05) than completers. The proportions of patients
completing both questionnaires are shown in Figure 1.
Adherence to the intervention programmes was judged by session attendance. In the rehabilitation
group, 37 (64%) patients attended at least 18 of 24 exercise sessions, 42 (72%) patients attended at
least five of six education sessions, and 50 (86%) patients attended at least two of three dietary
education sessions. In the individual group, 48 (84%) patients attended at least three of the four
nurse counselling sessions, and 50 (88%) patients attended at least two of the three dietician
counselling sessions.
SF-36
In both groups, the lowest estimated mean scores at baseline were “vitality” and “general health”
(Table 2). There were no significant differences in the change of any item between the two groups
after the 6-months intervention period. However, the mean score of vitality tended to increase
within the rehabilitation group (by 5.2 points, p=0.12) and increased significantly within the
individual group (by 5.6 points, p=0.03). In all other items the increases were small and did not
reach a statistical significant level.
DSC-R
The estimated means of self-rated health from the DSC-R questionnaire at baseline and after the 6-
months intervention period are shown in Table 3. In both groups, the highest estimated mean scores
at baseline were “Fatigue” and “Hyperglycaemia”. After the 6-months intervention period
hyperglycaemic and hypoglycaemic distress were significantly improved in the individual group
compared with the rehabilitation group (difference -0.3 points, p=0.04). There were no differences
9
between the two groups in any of the other symptom scales. However, in each group fatigue distress
significantly improved (by -0.40 points, p=0.01, in the rehabilitation group and by -0.34 points,
p<0.01, in the individual group). In the rehabilitation group cardiovascular distress significantly
decreased by -0.25 points (p=0.01). In the individual group hyperglycaemic distress significantly
decreased by 0.31 points (p=0.02) and hypoglycaemic distress significantly decreased by 0.28
points (p=0.02).
The change in hyperglycaemic distress was significantly correlated to change in HbA
1c
levels
(Spearman rank-correlation coefficient of 0.29, P<0.01) suggesting a lower frequency of
hyperglycaemic symptoms and an improvement in hyperglycaemic distress with lower HbA
1c
levels.
Intention-to-treat analysis
When the analysis was repeated as an intention-to-treat analysis the number of comparisons used
only increased from 107 to 119 and all results on health-related quality of life and self-rated health
remained unchanged.
Discussion
A 6-months group-based rehabilitation programme did not improve HRQOL or self-related health
in type 2 diabetes patients more than after individual counselling. In fact, the individual group
experienced a significant relief in hyper- and hypoglycaemic distress compared with the
rehabilitation group. Both groups reported less fatigue distress and increased vitality after six
months compared with baseline.
At baseline, the most burdensome symptoms in our study population of type 2 diabetes patients
were related to low vitality in the SF-36 questionnaire and fatigue in the DSC-R questionnaire. This
was also found in studies evaluating the questionnaires in both type 2 diabetes patients [8, 23, 26,
27] and in the general population [28]. However, the mean score of several items in the SF-36
questionnaire was lower in our study population compared with the general Danish population but
higher compared with a study population of uncontrolled type 2 diabetes patients [8, 28]. The mean
score of several items in the DSC-R questionnaire was lower in our population compared with
10
newly diagnosed type 2 diabetes patients but higher than a population of insufficient controlled type
2 diabetes on oral therapy [26, 27].
The mean baseline score of the vitality scale (61 point) in the overall study population was lower
than in the general Danish population (69 point) [28]. Although not statically significant, the mean
score of vitality increased by approximately 5 point in both groups after the interventions. A study
by Bjørner et al. interpreted score differences in the SF-36 vitality scale in patients with chronic
conditions [29]. Patients suffering from a condition with a 5-point lower vitality score (compared
with patients without that condition) had significantly increased odds of inability to work (odds
ratio, OR, 1.27), job loss within 1 year (OR 1.13) and hospitalisation within 1 year (OR 1.08).
Patients with diabetes had especially high OR for hospitalisation (OR 1.63). The improvements in
the other SF-36 scales were between 0 and 4 points except for social functioning that deteriorated.
A reasonable argument could be that a 6-months intervention period might not be enough time to
improve social and emotional functioning. However, in the UK Prospective Diabetes Study there
were no significant differences in the average changes of HRQOL over a six-year period between
patients allocated to conventional versus intensive treatment [10]. The baseline SF-36 scores are
relatively high, reflecting a patient population who has relatively good health and functional status.
This in itself might explain the small improvement. Another explanation could be that it is more
difficult to show differences in a generic questionnaire than in a disease specific questionnaire
following education or self-management interventions [30]. Therefore it is important to use a
questionnaire designed for the population of interest.
In the DSC-R questionnaire fatigue distress were improved within both groups after the
interventions. The individual group reported significantly less hyperglycaemic and hypoglycaemic
distress compared with baseline values and compared with the rehabilitation group. The magnitude
of these improvements ranged from 0.28 to 0.40 points which is close to the minimal important
difference ranged from 0.39 to 0.60 point estimated in a psychometric evaluation of the DSC-R
questionnaire [24]. The rehabilitation group reported less cardiovascular distress after the
intervention, which might be a result of the included exercise in the group-based rehabilitation
programme.
We found an improvement in glycaemic control in both intervention groups [16]. As some studies
showed a positive effect on HRQOL outcomes in addition to improved glycaemic control we had
expected to find more significant improvements in HRQOL outcomes in our study [6-8]. In
addition, a meta-analysis comparing didactic educational programmes with self-management
11
educational programmes found that HRQOL improved more following self-management education
[30]. Due to group interaction and interpersonal dynamics in the rehabilitation group we had
expected larger improvements in HRQOL outcomes between the two groups in favour of the
rehabilitation group. However, our results are consistent with other studies assessing the effect of
group-based self-management education programmes on HRQOL founding no difference between
intervention and control groups [12, 13, 31, 32].
The study is limited by the high frequency of non-completers. Even at baseline 17% of the patients
did not complete the questionnaires. The patients were asked to complete the questionnaires at
home after the randomisation and then bring it back to the study personnel on the first day of the
intervention. Most of the lost patients dropped out at the time of randomisation and refused to fill in
the questionnaires and therefore we do not have any baseline values of these patients. Because the
majority of results obtained in both groups were similar, any selection bias is likely to have been
small. In addition, confidence intervals were generally wide (Table 2 and 3) and might indicate an
inadequate sample size and a type 2 error. From the overall baseline characteristics we found that
patients who were missing or lost to follow-up only had higher weight and waist circumference
compared with completers. This suggests
that no-response bias might not be an important factor
influencing the results of the questionnaires. Limitations of our study also include the fact that it
was not possible to identify the effect of each component of the interventions.
The present study was strengthened by the use of both a validated diabetes symptom questionnaire
and a well-established generic quality of life questionnaire. We used a randomised controlled design
to compare the effects on both clinical and self-reported outcomes of two lifestyle intervention
programmes for type 2 diabetes patients. Our study can be regarded as a ‘real life’ trial much
reflecting the clinical care setting and therefore the results are in line with what is possible to obtain
in non-research settings.
Conclusions
This study suggests that a group-based rehabilitation programme is not superior to an individual
counselling programme in changing patients’ HRQOL and self-rated health. This is interesting
taking into account that the personnel resource use in the rehabilitation programme was twice as
much as in the individual programme. However, the positive findings of several items in both
groups indicate that lifestyle intervention is an important part of the management of type 2 diabetes
12
patients. Long-term follow-up results of this study will determine whether or not the improvements
are sustainable.
Abbreviations
HbA
1c
, glycated haemoglobin; HRQOL, health-related quality of life; SF-36, Medical Outcomes
Study Short Form 36-item Health Survey; DSC-R, Diabetes Symptom Checklist – Revised;
Competing interests
The authors have no relevant conflict of interest to disclose.
Authors' contributions
ESV drafted the manuscript. All authors participated in the design of the study and provided input
into the main ideas of this paper. All authors obtained funding for the project. ESV carried out
screening, randomization and examination of the patients, and performed part of the statistical
analysis. All authors read, commented, and approved the final version of the manuscript.
Acknowledgements
The study was supported by grants from the Jascha Foundation, the Research Foundation of
Bispebjerg Hospital, the Copenhagen Capital Region Research Foundation, the National Board of
Health, the Ministry of Health and Prevention, GlaxoSmithKline, Servier Denmark, Department of
Endocrinology at Bispebjerg University Hospital.
We thank laboratory technician Liselotte Spuur for laboratory assistance. We thank the staff at the
healthcare centre and the diabetes outpatient clinic for participating in the study.
References
1. Rubin RR, Peyrot M. Quality of life and diabetes. Diabetes Metab Res Rev 1999;15:205-18.
13
2. Peyrot M, Rubin RR. Levels and risks of depression and anxiety symptomatology among
diabetic adults. Diabetes Care 1997;20:585-90.
3. Jacobson AM, de GM, Samson JA. The evaluation of two measures of quality of life in
patients with type I and type II diabetes. Diabetes Care 1994;17:267-74.
4. Magwood GS, Zapka J, Jenkins C. A review of systematic reviews evaluating diabetes
interventions: focus on quality of life and disparities. Diabetes Educ 2008;34:242-65.
5. Cochran J, Conn VS. Meta-analysis of quality of life outcomes following diabetes self-
management training. Diabetes Educ 2008;34:815-23.
6. Van der Does FE, De Neeling JN, Snoek FJ, et al. Symptoms and well-being in relation to
glycemic control in type II diabetes. Diabetes Care 1996;19:204-10.
7. Testa MA, Simonson DC. Health economic benefits and quality of life during improved
glycemic control in patients with type 2 diabetes mellitus: a randomized, controlled, double-
blind trial. JAMA 1998;280:1490-6.
8. Goddijn PP, Bilo HJ, Feskens EJ, Groeniert KH, van der Zee KI, Meyboom-de JB.
Longitudinal study on glycaemic control and quality of life in patients with Type 2 diabetes
mellitus referred for intensified control. Diabet Med 1999;16:23-30.
9. Weinberger M, Kirkman MS, Samsa GP, et al. The relationship between glycemic control and
health-related quality of life in patients with non-insulin-dependent diabetes mellitus. Med
Care 1994;32:1173-81.
10. Quality of life in type 2 diabetic patients is affected by complications but not by intensive
policies to improve blood glucose or blood pressure control (UKPDS 37). U.K. Prospective
Diabetes Study Group. Diabetes Care 1999;22:1125-36.
11. Mensing CR, Norris SL: Group education in diabetes: effectiveness and implementation.
Diabetes Spectrum 2003;16:96 –103.
12. Rickheim PL, Weaver TW, Flader JL, Kendall DM. Assessment of group versus individual
diabetes education: a randomized study. Diabetes Care 2002;25:269-74.
13. Deakin TA, Cade JE,Williams DDR, Greenwood DC. Empowered patients:better diabetes
control, greater freedom to eat, no weight gain!. Diabetologia. 2003; Vol. 46 Suppl 2:A90
14. Polonsky WH. Emotional and quality-of-life aspects of diabetes management. Curr Diab Rep
2002;2:153-9.
15. Funnell MM, Anderson RM, Arnold MS, et al. Empowerment: An Idea Whose Time Has
Come in Diabetes Education. The Diabetes Educator 1991;17:37-41.
14
16. Vadstrup ES, Frolich A, Perrild H, Borg E, Roder M. Effect of a group-based rehabilitation
programme on glycaemic control and cardiovascular risk factors in type 2 diabetes patients:
The Copenhagen Type 2 Diabetes Rehabilitation Project. Patient Educ Couns (2010),
doi:10.1016/j.pec.2010.06.031.
17. Vadstrup ES, Frolich A, Perrild H, Borg E, Roder M. Lifestyle intervention for type 2 diabetes
patients: trial protocol of The Copenhagen Type 2 Diabetes Rehabilitation Project. BMC
Public Health 2009;9:166.
18. Røjen D, Vibe-Petersen J, Perrild H. Education of patients with type 2 diabetes. Handbook for
healthcare providers. Novo Nordisk A/S, 2005.
19. Miller WR, Rollnick S. Motivational interviewing: Preparing people for change, 2nd Edn.
New York: Guilford Press, 2002.
20. Ware JE, Jr., Sherbourne CD. The MOS 36-item short-form health survey (SF-36). I.
Conceptual framework and item selection. Med Care 1992;30:473-83.
21. McHorney CA, Ware JE, Jr., Lu JF, Sherbourne CD. The MOS 36-item Short-Form Health
Survey (SF-36): III. Tests of data quality, scaling assumptions, and reliability across diverse
patient groups. Med Care 1994;32:40-66.
22. Bjorner JB, Thunedborg K, Kristensen TS, Modvig J, Bech P. The Danish SF-36 Health
Survey: translation and preliminary validity studies. J Clin Epidemiol 1998;51:991-9.
23. Grootenhuis PA, Snoek FJ, Heine RJ, Bouter LM. Development of a type 2 diabetes symptom
checklist: a measure of symptom severity. Diabet Med 1994;11:253-61.
24 Arbuckle RA, Humphrey L, Vardeva K, et al. Psychometric Evaluation of the Diabetes
Symptom Checklist-Revised (DSC-R)-A Measure of Symptom Distress. Value in Health
2009;Early View July.
25. Polonsky WH. Understanding and Assessing Diabetes-Specific Quality of Life. Diabetes
Spectrum 2000;13:36.
26. Vinik AI, Zhang Q. Adding insulin glargine versus rosiglitazone: health-related quality-of-life
impact in type 2 diabetes. Diabetes Care 2007;30:795-800.
27. Adriaanse MC, Dekker JM, Spijkerman AM, et al. Diabetes-related symptoms and negative
mood in participants of a targeted population-screening program for type 2 diabetes: The
Hoorn Screening Study. Qual Life Res 2005;14:1501-9.
28. Bjorner JB, Kreiner S, Ware JE, Damsgaard MT, Bech P. Differential item functioning in the
Danish translation of the SF-36. J Clin Epidemiol 1998;51:1189-202.
15
29. Bjorner JB, Wallenstein GV, Martin MC, et al. Interpreting score differences in the SF-36
Vitality scale: using clinical conditions and functional outcomes to define the minimally
important difference. Curr Med Res Opin 2007;23:731-9.
30. Steed L, Cooke D, Newman S. A systematic review of psychosocial outcomes following
education, self-management and psychological interventions in diabetes mellitus. Patient Educ
Couns 2003;51:5-15.
31. Davies MJ, Heller S, Skinner TC et al. Effectiveness of the diabetes education and self-
management for ongoing and newly diagnosed (DESMOND) programme for people with
newly diagnosed type 2 diabetes: cluster randomised controlled trial. BMJ 2008; March 1; 336
(7642): 491-5.
32. Toobert DJ, Glasgow RE, Strycker LA, Barrera M, Jr., Ritzwoller DP, Weidner G. Long-term
effects of the Mediterranean lifestyle program: a randomized clinical trial for postmenopausal
women with type 2 diabetes. Int J Behav Nutr Phys Act 2007;4:1.
16
Figures
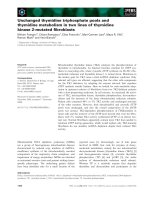
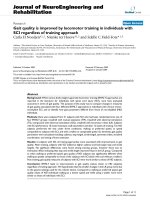
Figure 1 - The study flow shown for HRQOL (Health-related Quality of Life) and self-rated
health assessments.
Of the 264 patients screened 121 was excluded mainly due to too low HbA
1c
. Main reasons for missing data after
randomisation and during the intervention period were dropout due to time constraints and disappointment with
randomisation and lost questionnaires.
17
Tables
Table 1 - Descriptive characteristics of participants at baseline by group
Rehabilitation group
Individual group
N 70 73
Male/Female 41/29 (59/41) 44/29 (60/40)
Age, years 58.5 ±9.0 58.0 ±10.3
Diabetes duration,
years (range)
6.7 (0-37)
6.4 (0-24)
- Newly diagnosed diabetes 14 (20) 12 (15)
HbA
1c
, % 7.9 ±0.8 7.8 ±0.9
Weight, kg 96.2 ±15.2 98.2 ±24.8
Smokers/Ex-smokers 15/27 (21/39) 13/36 (18/49)
No antidiabetic drugs 9 (13) 17 (23)
OAD only 48 (68) 46 (63)
Insulin 13 (19) 10 (14)
Microalbuminuria 9 (13) 14 (19)
Macroalbuminuria 3 (4) 3 (4)
Retinopathy 4 (6) 3 (4)
Peripheral neuropathy 28 (40) 24 (33)
Cardiovascular event 8 (11) 9 (12)
Mean ±SD or N (%). OAD: Oral Antidiabetic Drug. Microalbuminuria was defined as a urine Albumin:Creatinine
Ratio (ACR) ≥ 2.5 - 25 mg/mmol in men and ≥ 3.5 - 25 mg/mmol in women. Macroalbuminuria: ARC > 25 mg/mmol.
Peripheral neuropathy was defined as biothesiometric value > 25 volt. Cardiovascular event: Myocardial infarction,
Coronary revascularization, Angina pectoris or Stroke.
Table 2 - SF-36 outcomes at baseline and after 6 months intervention.
Rehabilitation group
Individual group
Model summary
‡
Baseline
n=58
6 months
n=57
Baseline
n=60
6 months
n=58
(95% CI) P
§
Physical function 78 (19) 83 (18) 83 (20) 87 (15) 1.0 (-4.1 to 6.1) 0.70
Limitation due to
physical problems
72 (35)
78 (34)
73 (37)
78 (34)
-1.5 (-13.5 to 10.6)
0.81
Bodily pain 75 (26) 76 (26) 77 (23) 82 (22) 3.5 (-5.0 to 12.0) 0.42
General health 63 (21) 68 (19) 65 (17) 69 (17) 0.2 (-5.3 to 5.6) 0.96
Vitality 59 (24) 66 (24) 63 (23) 69 (20)
¶
1.5 (-5.6 to 8.6) 0.68
Social functioning 87 (24) 85 (24) 89 (17) 89 (18) 2.4 (-5.2 to 10.0) 0.53
Limitation due to
emotional problems
78 (33)
81 (29)
74 (39)
82 (34)
2.2 (-8.8 to 13.2)
0.69
Mental health 77 (19) 80 (18) 79 (18) 82 (16) 0.9 (-4.5 to 6.2) 0.74
Data are means (SD). Score scale range (0-100). A higher score indicates an improvement.
‡
Difference in the change
(from baseline to 6 months) of each variable between the two groups, when adjusted for baseline values.
§
Significance
of the difference between groups.
¶
Significant (P<0.05) difference from baseline to 6 months within the group.
18
Table 3 - DSC-R outcomes at baseline and after 6 months intervention.
Rehabilitation group
Individual group
Model summary
‡
Baseline
n=58
6 months
n=57
Baseline
n=60
6 months
n=58
(95% CI) P
§
Hyperglycaemia 1.4 (1.3) 1.3 (1.1) 1.5 (1.1) 1.2 (1.1)
¶
-0.33 (-0.65 to -0.02) 0.04
Hypoglycaemia 1.1 (1.1) 1.1 (1.1) 1.0 (1.0) 0.7 (0.8)
¶
-0.30 (-0.60 to -0.01) 0.04
Fatigue 2.1 (1.3) 1.6 (1.2)
¶
1.8 (1.2) 1.5 (1.1)
¶
-0.02 (-0.37 to 0.32) 0.89
Cognitive 1.2 (1.1) 1.1 (1.1) 1.0 (0.9) 0.9 (0.8) -0.12 (-0.36 to 0.12) 0.33
Pain 0.6 (0.9) 0.6 (1.0) 0.4 (0.8) 0.5 (1.0) -0.05 (-0.41 to 0.30) 0.76
Sensory 0.7 (0.7) 0.6 (0.8) 0.5 (0.7) 0.5 (0.9) 0.09 (-0.17 to 0.35) 0.49
Cardiology 0.9 (0.9) 0.6 (0.8)
¶
0.7 (0.7) 0.6 (0.7) 0.13 (-0.09 to 0.35) 0.23
Vision 0.6 (0.7) 0.6 (0.8) 0.5 (0.8) 0.5 (0.9) -0.02 (-0.28 to 0.25) 0.90
Total 1.0 (0.6) 0.9 (0.7) 0.9 (0.6) 0.8 (0.6) -0.04 (-0.21 to 0.13) 0.61
Data are means (SD). Score scale range (0-5). A lower score indicate an improvement.
‡
Difference in the change (from
baseline to 6 months) of each variable between the two groups, when adjusted for baseline values.
§
Significance of the
difference between groups.
¶
Significant (P<0.05) difference from baseline to 6 months within the group.
Randomization
N
= 143
Screening
N
= 264
Exclusion
N
= 121
Rehabilitation gr oup
N = 70
Individual gr oup
N = 73
Baseline
Completed questionnaires
N = 58
Baseline
Completed questionnaires
N = 61
6 months
Completed questionnaires
N = 57
6 months
Completed questionnaires
N = 58
Figure 1