báo cáo khoa học:" Multimorbidity and health-related quality of life in the older population: results from the German KORA-Age study" ppsx
Bạn đang xem bản rút gọn của tài liệu. Xem và tải ngay bản đầy đủ của tài liệu tại đây (337.12 KB, 10 trang )
RESEARC H Open Access
Multimorbidity and health-related quality of life
in the older population: results from the German
KORA-Age study
Matthias Hunger
1*
, Barbara Thorand
2
, Michaela Schunk
1
, Angela Döring
2
, Petra Menn
1
, Annette Peters
2
and
Rolf Holle
1
Abstract
Background: Multimorbidity in the older population is well acknowledged to negatively affect health-related
quality of life (HRQL). Several studies have examined the independent effects of single diseases; however, little
research has focused on interaction between diseases. The purpose of this study was to assess the impact of six
self-reported major conditions and their combinations on HRQL measured by the EQ-5D.
Methods: The EQ-5D was administered in the population-based KORA-Age study of 4,565 Germans aged 65 years
or older. A generalised additive regression model was used to assess the effects of chronic conditions on HRQL
and to account for the nonlinear associations with age and body mass index (BMI). Disease interactions were
identified by a forward variable selection method.
Results: The conditions with the greatest negative impact on the EQ-5D index were the history of a stroke
(regression coefficient -11.3, p < 0.0001) and chronic bronchitis (regression coefficient -8.1, p < 0.0001). Patients
with both diabetes and coronary disorders showed more impaired HRQL than could be expected from their
separate ef fects (coefficient of interaction term -8.1, p < 0.0001). A synergistic effect on HRQL was also found for
the combination of coronary disorders and stroke. The effect of BMI on the mean EQ-5D index was inverse
U-shaped with a maximum at around 24.8 kg/m
2
.
Conclusions: There are important interactions betwe en coronary problems, diabetes mellitus, and the history of a
stroke that negatively affect HRQL in the older German population. Not only high but also low BMI is associated
with impairments in health status.
Background
Multimorbidity, defined as the coexistence of two or
more chronic conditions, is a common phenomenon
among the older population worldwide: two recent
population-based studies indicated that the prevalence
of multimorbidity ranges b etween 40% and 56% in the
general population aged 65 years and older [1,2]. Multi-
morbidity is known to negatively affect health outcomes
including mortality, hospitalisation, and readmission [3].
Health-related quality of life (HRQL) is a health out-
come measure which is increasingly used to assess the
medical effectiveness of interventions and to support
allocation decisions in t he health care sector. Generic
HRQL instruments like the EQ-5D are appropriate for
non-disease-specific analyses and allow comparisons
between patient groups with different medical condi-
tions [4].
Several studie s examined the effect of multimorbidity
on HRQL [5-13], however research has poorly repre-
sented combinati ons of chronic conditions [6]. In parti-
cular, to the best of our knowledge, all studies usin g the
EQ-5D as a measure of HRQL only considered indepen-
dent disease effects [6,7,10-12]. Therefore, it has been
argued that further studies should focus o n identifying
interaction effects between chronic conditions and
account for the impact of specific disease combinations
* Correspondence:
1
Helmholtz Zentrum München, German Research Center for Environmental
Health (GmbH), Institute of Health Economics and Health Care Management,
Ingolstädter Landstr. 1, 85764 Neuherberg, Germany
Full list of author information is available at the end of the article
Hunger et al . Health and Quality of Life Outcomes 2011, 9:53
/>© 2011 Hunger et al; licens ee BioMed C entral Ltd. This is an O pen Access article distributed under the terms of the Creative Commons
Attribution License ( which permits unrestricted use, distribution, and re production in
any medium, provided the original work is properly cited.
[5,7]. Synergistic effects on quality of life measures other
than the EQ-5D have been reported mainly for the com-
bination of diabetes and cardiovascular problems
[8,9,14,15], the combination of respiratory and cardio-
vascular problems [5,9], and the simultaneous presence
of diabetes and hypertension [14,16].
Studies have shown that HRQL is strongly associated
with body mass index (BMI) even after adjusting for
comorbidities [7,17-20]. Many contributions analysing the
relationship between BMI and HRQL incorporated the
effect of BMI either as a li near term, or divided its distribu-
tion in categories according to the classification of
the World Health Organisation (WHO) [21]. The first
approach, however, ignores the fact that association
between BMI and HRQL is usually nonlinear [13,19,20,22],
while in the second approach, grouping different BMI
values into the same category may obscure meaningful dif-
ferences within categories. Both approaches can bias find-
ings since they may conceal the true functional form of the
relationship. Furthermore, concerns have been raised
about whether the WHO classification is appropriate for
use in the older population [23]. In particular, the question
of to what extent not only being overweight but also being
underweight is associated with reduced HRQL has not
been sufficiently investigated in the older population.
The purpose of this study was to clarify how different
chronic conditions and pairs of conditions are associated
with impairments in HRQL measured by the EQ-5D in a
German general population sample of individuals aged
65 years and older. Specifically, we sought to identify and
explore disease combinations which are related to HRQL
over and above the independent contributions of each
condition. Furthermore, we wanted to appropriately
account for the association of age and BMI with HRQL
by using nonparametric regression methods, i.e. without
imposing a prior i constraints on the functional form of
this relationship.
Methods
Data source
The data used for analysis come from the KORA-Age
study, a population-based, longitudinal study focusing
on the research of long-term determinants and conse-
quences of multimorbidity. The study design was based
on the ongoing studies from the KORA research, a plat-
form for population-based surveys and subsequent fol-
low-up studies in the fields of epidemiology, health
economics, and health care research in Germany [24].
The KORA-Age study is a follow-up of all participants
aged65-94oftheMONICA/KORAsurveysS1toS4.
Participants were randomly selected from population
registries from the study region, comprising the city of
Augsburg and its two surrounding counties in Southern
Germany. The four cross-sectional surveys were
conducted between 1984 and 2001, and participation
rates ranged between 79% in S1 and 67% in S4 [25].
Details a bout study design, sampling method and data
collection can be found elsewhere [24-26]. In total,
17,607 people participated in at least o ne of the four
surveys. The KORA-Age study population is restricted
to the subgroup of 9,197 sub jects who were born in
1943 or earlier. 2,734 of these 9,197 individuals had
died, 45 moved abroad or to an unknown location, and
427 refuse d to be contacted for any follow-up. A follow-
up questionnaire for self-completion with questions on
chronic conditions and the EQ-5D was po sted to the
remaining 5,991 eligible people with known addresses
between November 2008 and September 2009. All reci-
pients who did not answer within 4 weeks were sent a
postcard reminder. After another 4 weeks, non-respon-
dents were contacted by telephone and if the person
could be motivated to participate, the questionnaire was
administered via telephone.
In total, data was collected for 4,565 people (response
76.2%), of whom 3,833 returned the questionnaire and
732 (16.0%) were interviewed via telephone.
The KORA-Age study was approved by the Ethics
Committee of the Bavarian Medical Association.
Chronic conditions and sociodemographics
Information on chronic conditions was based on self-
reports. The history of stroke was ascertained by asking
the questions: “Have you ever had a stroke diagnosed by
a physician?” and “ If yes, how many strokes have you
had?” Furthermore, for each stroke, respondents were
asked to report the year of diagnosis. History of myocar-
dial infarction and history of cancer diagnosis were
assessed in the same manner. History of bypass opera-
tion was assessed similarly, but only the year of the first
operation had to be reported. To identify subjects with
diabetes and hypertension, participants were asked if
they had ever been told by a physician that they had
each condition. Following the definition from the WHO,
participants were identified as suffering from chronic
bronchitis if they reported having a cough and sputum
during most days in three consecutive months (two
questions).
Body weigh t was self-reported whereas information on
body height was obtained from measurements per-
formed at the baseline examinations. Fr om these dat a,
BMI was calculated as weight in kg divided by the
squared height in meters. Age and a three-level categori-
cal education variable (primary, secondary and tertiary
education) were also taken from the baseline surveys.
In our regression analyses, all chronic conditions were
considered as binary covariates. Subjects with a myocar-
dial i nfa rction and/or a bypass oper ati on were clas sified
as having coronary disorders [7].
Hunger et al . Health and Quality of Life Outcomes 2011, 9:53
/>Page 2 of 10
EQ-5D
The EQ-5D is a generic measure of HRQL which can be
used for describing and valuing health states. It consists
of a self-reported health state description and a visual
analogue scale (VAS). T he self-reported description
comprises five questions referring to the dimensions
mobility, self-care, usual activities, pain/discomfort and
anxiety/depression . Each dimension has three response
levels (no, moderate, or extreme problems), generating a
total of 243 different health states. These health states
can be transformed into a singl e utility value (EQ-5D
index) using a scoring algorithm which is based on
valuations of repr esentative general population samples.
This study used the European tariff suggested by Grei-
ner et al. [4]. Due to lack of space, our questionnaire
did not include the VAS; however, the EQ-5D index is
calculated independently of the VAS.
Statistical analyses
We conducted multiple regression analyses for the EQ-
5D index to determine the simultaneous effect that
chronic conditions and demographi c variables have on
HRQL in our sample. To account for potential non-
linear associations of age and BMI with the EQ-5D
index, we fitted additive models which are special cases
of generalised additive models (GAMs) where the error
terms are assumed to follow a normal distribution [27].
Our model can be written as
Y
i
= β
0
+ x
T
i
β + f
a
g
e
(age
i
)+f
BMI
(BMI
i
)+ε
i
,
where Y
i
is the response of individual i, f
age
and f
BMI
are
smooth functions, and x
i
T
b is a linear predictor including
the binary and categorical covariates of the model. As in
the linear model, all ε
i
are independently distributed zero-
mean Gaussian variables with variance s
2
.
The smooth functions f
age
and f
BMI
were estimated by
using thin plate regression splines, and smoothing para-
meters were estimated through generalised cross-validation
(GCV) [27]. In the additive model, the effects of the binary
and categorical covariates (i.e., chronic conditions or socio-
demographic variables) are interpreted as in the linear
model while we represent the effect that age and BMI
exert on H RQL by plotting the estimated smooth functions
ˆ
f
age
and
ˆ
f
BMI
. We checked robustness of the estimated
curves by splitting the data into two age- and BMI-
matched subsets an d refitting the r egression model.
First, we fitted a regression model where all available
covariates were included as main effects. We also
included a binary covariate to distinguish between
respondents who returned th e questionnaire and those
who were interviewed by telephone. Second, we assessed
the effects of disease combinations by adding to the
model the significant pairwise interaction terms between
diseases. To identify the significant interactions, we used
a stepwise forward selectionprocedure.Ineachcycle,
the interaction term with the smallest p-value (based on
the corresponding F-test) was included until all disease
interactions in the model were significant at the 1%
level[27,28].Wedecidedtouseasignificancelevelof
1% in order to obtain more stable results: since we con-
sidered 15 pairs of diseases, approximately one interac-
tion term would be expected to be significant at the 5%
level by chance. This effect is lessened if one uses a
stricter significance level.
To as sess the sensitivity of the results to missing data,
we refitted the models to an imputed data set. We used
the Markov Chain Monte Carlo method to impute miss-
ing covariates and the predictive mean matching
method to impute missing values in the EQ-5D index
[29]. W e performed single instead of multiple imputa-
tion due to the relatively low percent age of missing
values and the high computational effort that is asso-
ciated with anal ysing additive models based on multiply
imputed datasets.
Stu dies have found that the same condition may have
a different impact across age and sex groups [11]. To
examine possible interaction effects between age and
specific chronic diseases, we split the data into a subset
of younger (65 - 74 years) and a subset of older (> = 75
years) participants. We refitted the model to these two
subsets and compared the estimated regression coeffi-
cients . In the same way, we examined interaction effects
with sex.
The regression model for the EQ-5D index scores
determines the independent effects that chronic condi-
tions have on overall health. However, as the EQ-5D
index is a weighted summary score of five items repre-
senting differe nt dimensions of health, decreases in the
EQ-5D index score may arise from d ifferent patterns of
impairments across these individual dimens ions. To
examine how the chronic conditions in question affected
the EQ-5D health dimensions, we additionally fitted
logistic generalised additive models for each EQ-5D
item, merging response categories 2 (‘ moderate pro-
blems’)and3(‘ severe problems’) into one category to
form a dichotomous dependent variable. To be consis-
tent with the EQ-5D index model, we report the results
of both main effects and interaction models, which
include the same disease interactions as the EQ-5D
index model. In particular, this approach allows us to
investigate whether the interactions between diseases
found in the EQ-5D index model can mainly be ascribed
to specific dimensions of health.
Data analyses were carried out using the statistical
software R with the add-on packag e mgcv [27,30]. Miss-
ing value imputation was performed using SAS 9.1 (SAS
Institute, Cary, North Carolina, USA).
Hunger et al . Health and Quality of Life Outcomes 2011, 9:53
/>Page 3 of 10
Results
Sample characteristics are presented in Table 1 for the
whole sample as well as stratified by the data collection
method (questionnaire vs. telephone respondents). From
the 4,565 patients in the whole sample, 2,198 (48.1%)
were male. Mean age was 73.9 years (SD 6.23) and the
oldest respondent was 94 years old. Hypertension
(59.2%) and diabetes mellitus (17.5%) were the most
prevalent conditions. Respondents interviewe d by tele-
phoneweremorelikelytobefemale(58.9%vs.50.5%,
p < 0.0001, chi-square test) and on average 2.6 years
older (CI: 2.1 - 3.1). Furthermore, they had more
chronic conditions on average than the questio nnaire
respondents.
The EQ-5D index could not be calculated for 93
(2.0%) respondents due to missing values in at least one
EQ-5D item. Excluding participants with missing data in
the EQ-5D index or in the covariates reduced the final
sample size from 4,565 to 4,412. The 153 (3.35%) indivi-
duals excluded from analyses were on aver age 2.9 (CI:
1.9 - 3.9) years older than the participants with com-
pleteinformationandwereslightlymorelikelytobe
female (p = 0.016, chi-square-test).
The mean EQ-5D index in the sample was 76.3 (SD
18.8) and the observed values covered the entire range
from 3.5 to 97.7. There was a ceiling effect in the data
since 1,285 (29.1%) respondents stated having no pro-
blems in any of the five EQ-5D dimensions and w ere
hence assigned the EQ-5D index value 97.7. Moderate
or severe problems were most frequently reported in the
EQ-5D dimension ‘pain’ (62.5%), followed by ‘ mobility’
(31.3%), ‘anxiety/depression’ (29.2%), ‘usual activities’
(22.5%) and ‘self-care’ (10.1%).
Respondents interviewed by telephone rated their health
on average 8.0 (CI: 6.2 - 9.7) points lower than the ques-
tionnaire respondents (unadjusted for covariates).
Results from the additive regression analyses are
shown in Table 2. In the main effect model, all condi-
tions were associated with significantly decreased EQ-
5D index scores. The most severe impairments were
observed for stroke (-11.3) and chronic bronchi tis (-8.1).
In the interaction model, two disease combinations with
synergistic effects were observed: in the combination of
diabetes mellitus and coronary disorders, bot h condi-
tions alone had no effect on HRQL, but their combina-
tion was associated with significantly reduced EQ-5D
scores. In the combination of coronary disorders and
stroke, the history of a stroke had a negative main effect
on HRQL, and the effect of coro nary disorders alone
was not significant. However, patients suffering from
both conditions were more seriously impaired than
could be expected from the independent effects. In both
regression models, one observed lower mean EQ-5D
scores for females and higher HRQL for respondents
with tertiary education. Telephone interview respon-
dentsreportedonaverage4.5pointslowerEQ-5D
scores than questionnaire respondents.
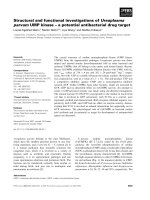
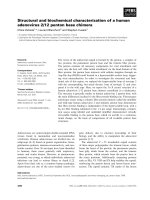
The nonlinear effects of age and BMI on the mean
EQ-5D index are represented by the estimated smooth
functions
ˆ
f
age
and
ˆ
f
BMI
in Figure 1. Since effects were
Table 1 Socio-demographic characteristics and self-reported prevalence of chronic conditions in the study population
Variable All respondents
N = 4,565
Questionnaire respondents
N = 3,833
Telephone respondents
N = 732
Mean age, years (SD) 73.86 (6.23) 73.44 (6.04) 76.03 (6.70)
Male sex, n (%) 2,198 (48.1%) 1,897 (49.5%) 301 (41.1%)
Education, n (%)
Primary 3,328 (70.7%) 2,665 (69.6%) 563 (76.9%)
Secondary 803 (17.6%) 699 (18.2%) 104 (14.2%)
Tertiary 532 (11.7%) 467 (12.2%) 65 (8.9%)
Mean BMI, kg/m
2
(SD) 27.45 (4.44) 27.39 (4.34) 27.76 (4.93)
Diabetes mellitus, n (%) 798 (17.5%) 652 (17.0%) 146 (20.0%)
Chronic bronchitis, n (%) 297 (6.5%) 241 (6.3%) 56 (7.7%)
Hypertension, n (%) 2,700 (59.2%) 2,240 (58.5%) 460 (63.1%)
Coronary event, n (%) 461 (10.1%) 376 (9.8%) 85 (11.6%)
Bypass operation, n (%) 178 (3.9%) 147 (3.8%) 31 (4.2%)
Myocardial infarction (MI), n (%) 395 (8.7%) 325 (8.5%) 70 (9.6%)
Mean time since last MI, years (SD) 10.49 (8.24) 10.69 (8.32) 9.52 (7.82)
Stroke, n (%) 330 (7.2%) 248 (6.5%) 82 (11.2%)
Mean time since last stroke, years (SD) 6.72 (6.57) 6.55 (6.45) 7.27 (6.95)
Cancer, n (%) 608 (13.3%) 511 (13.3%) 97 (13.3%)
Mean time since last diagnosis, years (SD) 8.79 (8.64) 8.58 (8.52) 9.94 (9.26)
SD: standard deviation
Hunger et al . Health and Quality of Life Outcomes 2011, 9:53
/>Page 4 of 10
almost identical in the two regression models, we only
show the curves of the main effect model. The left
curve in Figure 1 expresses a nonlinear age effect with
stable health until 70 years and a dec line in HRQL from
the age of 70. Between 70 and 85 years, HRQL
decreased on average by 14 units. The right curve in
Figure 1 shows that the relationship between BMI and
HRQL was inverse U-shaped with the maximum HRQL
locatedaroundaBMIofabout24.8kg/m
2
.Itindicates
that an increase of the BMI from 24.8 to 35 was
Table 2 Estimated regression coefficients from the additive model
Main effect model (adj. R
2
= 0.171) Model with interaction terms (adj. R
2
= 0.177)
Covariate Estimate 95% confidence limits p-value Estimate 95% confidence limits p-value
Intercept 81.85 80.74 82.96 < 0.0001 81.56 80.44 82.67 < 0.0001
Data collection* Telephone interview -4.49 -5.89 -3.08 <0.0001 -4.55 -5.95 -3.15 <0.0001
Age (years) see Figure 1 <0.0001 not shown <0.0001
BMI (kg/m
2
) see Figure 1 <0.0001 not shown <0.0001
Sex
†
Female -4.06 -5.13 -2.99 <0.0001 -3.96 -5.03 -2.89 <0.0001
Education
‡
Secondary 0.07 -1.29 1.44 0.9151 0.06 -1.30 1.42 0.9332
Tertiary 3.71 2.08 5.34 <0.0001 3.72 2.10 5.35 <0.0001
Diabetes mellitus -2.49 -3.89 -1.10 0.0004 -1.27 -2.77 0.22 0.0946
Coronary event -3.94 -5.67 -2.21 <0.0001 -0.64 -2.73 1.45 0.5462
Stroke -11.25 -13.23 -9.26 <0.0001 -9.44 -11.66 -7.22 <0.0001
Cancer -2.67 -4.16 -1.17 0.0005 -2.79 -4.28 -1.30 0.0002
Chronic bronchitis -8.10 -10.18 -6.03 <0.0001 -8.14 -10.21 -6.07 <0.0001
Hypertension -1.15 -2.22 -0.07 0.0367 -1.23 -2.30 -0.16 0.0248
Diabetes*coronary event -8.12 -11.95 -4.28 <0.0001
Coronary event*stroke -8.28 -13.17 -3.38 0.0009
The dependent variable is the EQ-5D index score.
BMI: Body mass index
*Reference category: Questionnaire respondents
†Reference category: Male sex
‡Reference category: Primary Education
All events are self-reported
Figure 1 Estimated smooth functions
ˆ
f
age
and
ˆ
f
BMI
showing the nonlinear effects of age and body mass index (BMI) on the mean EQ-
5D index score. The solid curves represent GAM estimates using a thin plate regression spline function with estimated 6.2 and 4.7 effective
degrees of freedom for age and BMI, respectively. The shaded areas represent approximate 95% pointwise confidence intervals. The functions
are fixed around the mean value of the EQ-5D index score. Due to estimation uncertainty for outliers, values for seven subjects over 90 years
and one subject with a BMI >50 are not displayed.
Hunger et al . Health and Quality of Life Outcomes 2011, 9:53
/>Page 5 of 10
associated with an EQ-5D utility loss of about 5.0 units.
On the other hand, underweight individu als with a BMI
of 18 had an average impairment of 7.1 units compared
to a BMI of 24.8. The estimated curves differed only
slightly when the data were split into two subsets.
Applying the regression model to the imputed data set
did not alter findings and the same interactions were
selected. Separately fitting the regression model to the
subset of younger and to the subset of older partici-
pants, we observed that the history of a stroke had a
stronger negative impact on HRQL in individuals aged
65-74 years than in individual s aged 75 years and above.
In contrast, the impairments in HRQL a ssociated with
the history of cancer were more pronounced in the
older age group. Furthermore, the neg ative effect of low
BMI on HRQL was more important in t he older age
group (results not shown).
The stratified analysis by sex revealed that the history
of a stroke had a stronger effect in men (-14.3; CI: -16.9
- -11.7) than in women (-7.4; CI: -10.5 - -4.3). In con-
trast, the effect of chronic bronchitis was slightly more
pronounced in women ( -10.5; CI: -14.4 - -7.6) than in
men (-6.4; CI: -9 .0 - - 3.7). Moreover, HRQL for men
peaked at a BMI of 26.3 kg/m
2
while maximum HRQL
in women was observed at a BMI of 23.4 kg/m
2
.
Results from the logistic regression models are shown
in Table 3. The covariates considered explained less var-
iance in the items ‘ pain’ and ‘ a nxiety/depression’
(deviance explained 5.3% and 4.2%, respectivel y) than in
the other items (deviance explained between 13.1% and
16.5%). The synergistic effects found in the EQ-5D
index model were also reflected in the EQ-5D dimen-
sions, how ever, the interaction terms were only partly
significant. Sex differences were mainly observed in the
dimensions ‘ usual activities’ , ‘ pain’ ,and‘anxiety/
depression’.
Discussion
In our study, we found that each of the chronic condi-
tions considered was associated with impairments in
HRQL, either alone or in combination with other condi-
tions. In agreem ent with the results of other studies, we
observed the most severe impairments for a history of
stroke [7,10,31] and chronic bronchitis [7,32]. With an
adjusted R
2
of approximately 18%, our models only
explained a moderate proportion of variance. Neverthe-
less, the adjusted R
2
was equal to or better than in com-
parable studies [7,12,33].
Several researchers investigated the joint effects that
specific disease combinations have on quality of life.
However, to the best of our knowledge, this study is the
first to explicitly examine interaction effects between
chronic conditions on HRQL measured by the EQ-5D.
Our analyses revealed that the combination of diabetes
mellitus and coronary problems, as well as the combina-
tion of coronary problem s and a stroke history were
synergistically associated with HRQL. There was no sub-
tractive interaction between diseases in our data.
The joint effect of diabetes and coronary problems on
HRQL in our study reflects the substantial burden of ill-
ness caused by the combination of these two conditions.
Studieshaveshownthatpersonswithdiabetesareat
greatly increased risk of cardiovascular diseases and that
the prevalence of cardiovascular complications amongst
persons with diabetes is especially high in older age
groups [34]. Our results complement these findings by
Table 3 Estimated odds ratios from the logistic generalised additive model
Mobility Self-care Usual activities Pain Anxiety/Depression
Sex
†
female 1.16 1.15 1.14 1.13 1.35** 1.33** 1.45*** 1.44*** 2.13*** 2.12***
Diabetes mellitus 1.49*** 1.39** 1.51** 1.29 1.53*** 1.33** 1.06 0.98 1.16 1.06
Coronary event 1.34* 1.11 1.57** 1.05 1.58*** 1.17 1.27* 1.04 1.41** 1.18
Stroke 3.09*** 2.81*** 3.96*** 3.44*** 3.24*** 3.04*** 1.96*** 1.82*** 2.07*** 2.02***
Cancer 1.35** 1.36** 1.30 1.32 1.45** 1.47*** 1.07 1.08 1.22* 1.22*
Bronchitis 2.33*** 2.34*** 2.44*** 2.47*** 2.21*** 2.24*** 2.40*** 2.41*** 1.72*** 1.73***
Hypertension 1.19* 1.19* 1.04 1.05 1.17 1.17 1.25* 1.26** 1.19* 1.20*
Diabetes*coronary event - 1.56 - 2.17* - 2.36** - 1.99* - 1.81*
Coronary event*stroke - 1.69 - 1.83 - 1.37 - 1.51 - 1.09
Deviance explained 13.1% 13.2% 16.5% 16.2% 13.3% 13.6% 5.3% 5.5% 4.2% 4.3%
The dependent variables are the probability of reporting moderate or severe problems in the respective EQ-5D dimension. In each dimension, the first column
refers to the main effect model and the second column to the interaction model.
All estimates are adjusted for age, body mass index, data collection method, education.
†Reference category: Male sex
* p < 0.05
** p < 0.01
*** p < 0.001
All events are self-reported
Hunger et al . Health and Quality of Life Outcomes 2011, 9:53
/>Page 6 of 10
underlining the exacerbating effect that cardi ovascular
diseases show on HRQL in subjects with diabetes. Syner-
gistic effect s o f diabetes and coronary proble ms on
HRQL have also been reported in studies using the SF-36
[9,15] and the HUI3 [8], as well as in studies on disabili ty
and functional status [14,35]. In contrast, Wee et al.
reported mainly additive, but even partly subtractive
effects of heart disease and diabetes on the SF-36 sub-
scales and the SF-6D [ 16]. For a discussion of further
synergistic relationships found in literature, see, e.g.,
Hodek et al. [36].
The nonsignificant main effect of diabetes in our
interaction model indicates that either there is no
decline i n HRQL caused by diabetes without coronary
comorbidity, or that the d ecline is too low to be
detected by the EQ-5D. It has been argued that the EQ-
5D detects differences d ue to d iabetes relat ed complica-
tions, but that it lacks sensitivity in capturing differences
between diabetes treatment regimes [37]. Although
there is evidence that subjects with diabetes but without
comorbidities still have more impairments than subjects
without diabetes [14, 15], another study found that dia-
betes was not associated with lower EQ-5D scores after
adjusting for comorbidities [7]. Rijken et al. even
observed a positive main effect of diabetes on the physi-
cal scale of the SF-36 when the negative interaction
term with cardiovascular disease was accounted for [9].
We found the combination of coronary problems and
the history of a stroke to also have synergistic effects on
HRQL. Stroke a nd myocardial infarction are both
mainly manifestations of atherosclerosis. Studies showed
higher mortality rates and increased treatment cost
when stroke occurs after myocardial infarction [38,39].
Reversely, myocardial infarction is an important cause of
death in patients with cerebrovascular disease [40].
Ano ther study found that heart disease and stroke were
synergistically associated with physical disab ility [35].
Our results highli ght the negative impact of this disease
combination on HRQL.
Very few studies on HRQL in multimorbid patients
accounted for the effect of weight problems, as expressed
by the BMI [7,17,18,41]. And to the best of our knowledge,
this study is the first to explicitly examine the funct ional
form of the relationship between BMI and HRQL by
means of semiparametric regression methods, i.e., without
imposing a priori constraints on its shape such as polyno-
mial forms or piecewise constant terms. Our analyses
showed that the relationship between BMI and HRQL was
inverse U-shaped and that not only overweight but also
lower BMI values were associated with significantly
reduced HRQL. This supports findings reported by other
studies [13,19,20,22]. Furthermore, our study is the first to
address the nonlinear association of BMI with HRQL in
older adults. Ignoring the nonlinearity would overestimate
HRQL for subjects with lower BMI values, which is parti-
cularly serious in the older population where being under-
weight can be a severe problem [42].
The additive regression models used in our study also
allowed us to explore the nonlinear relationship between
age and HRQL. In our sample, age was strongly asso-
ciated with the m ean EQ-5D index, but the age-re lated
decline in health was o nly observed from the age of 70.
The negative correlation between age and HRQL, even
after adjustment for the effect of chronic conditions, is
supported by several studies [6,7,10,43]. However, there
is evidence that age per se is only a weak predictor of
HRQL and that rather the increasing number and sever-
ity of chronic conditions are behind the age effect
[7,11,36,43]. Thus, the association between age and
HRQLmaybecomelesspronouncedifmorbiditywas
assessed by a gre ater number of comorbidities or if dis-
ease severity was accounted for.
The data used in our analyses came from a postal ques-
tionnaire for self-completion. However, about 16% of the
participants were interviewed by telephone since these
people had not returned the questionnaire despite being
sent a reminder. Respondents interviewed by telephone
were on average older, more likely to be female and suf-
fered from more chronic conditions than the question-
naire respondents. These three aspects are all known to be
negatively associated with HRQL. In fact, the unadjusted
HRQL score within the telephone respondents was nearly
8 points lower than within the questionnaire respondents.
However, our multivariable regression analyses showed
that the difference in HRQL between the two data collec-
tion methods persisted even after adjustment for covari-
ates. There are two possible explanations for this finding:
first, it can not be ruled out that answers to quality of life
questions given by the telephone respondents may be
biased due to the personal interview situation [44].
Second, it is possible that the difference is caused by unob-
served comorbidities. Although the telephone interviews
could increase the response rate, our study (as most popu-
lation surveys) was still confronted with the problem of
non-response. An extensive analysis on this issue in one of
the baseline surveys has shown that non-respondents
included a higher percentage of people with impaired
health [45], and it can be assumed that more severely ill
subjects were less likely to participate in our study. As a
consequence, our results may underestimate the burden of
comorbidity in the older population. Nevertheless, the pre-
valence of the chronic conditions in our study sample was
comparable to that reported in another German study
with the same age range [7].
One strength of our study is the large number of
patients wi th cell frequencies for disease combin ations
that allow for the valid examination of interaction
terms. Also, our study is population-based so that
Hunger et al . Health and Quality of Life Outcomes 2011, 9:53
/>Page 7 of 10
results are more likely to be transferable to the older
generalpopulationthanresults obtained from general
pract ice samples. Finally, to our knowledge , our study is
the first to examine the effect of disease c ombinations
on HRQL measured by the EQ-5D, the most freque ntly
used instrument in economic evaluation.
A limitation of our study was that we relied on a lim-
ited list of only six chronic conditions and no psychia-
tric condition was amongst the considered co nditions
[3]. This limitation is reflected by the relatively l ow pro-
portions of explained deviance in the regress ion models,
especi ally for the EQ-5D item ‘anxiety/depression’. Also,
we did not assess dementia because questions about the
diagnosis of dementia are a sensitive issue and responses
may be of limited validity [46]. However, most of the
comparab le studies evaluating interaction effects consid-
ered a similar number of chronic conditions [9,16,35],
and our study considered most of the common wide-
spread diseases in western countries.
Another limitation is that the presence of chronic
conditions in our study was based on self-reports. We
did not use a specific, validated questionnaire; however,
the case-finding questions for physician-diagnosed ill-
ness used in our questionnaire are widely used in popu-
lation-based studies [8,35,47] . Self-reports are not as
vali d as medical record information, h owever, they have
been shown to provide reasonable estimates of comor-
bidity in the older population [48,49]. In an earlier fol-
low-up of the KORA S1-S3 participants, the diagnoses
of myocardial infarction, stroke, and diabetes have been
validated by medical record review and the agreement
was very high [50].
Furthermore, our analyses did not account for time
since diagnosis or disease severity. Although long-term
reductions in HRQL for patients with a history of myo-
cardial infarction or stroke were reported in literature
[51,52], disease burdens may be higher for more recent
diagnoses. Differentiating by disease duration and disease
severity would permit more precise quantification of the
association between individual conditions and HRQL.
However, this study focused on exploring the joint effects
of disease combinations, and interaction effects between
conditions could no longer be described comprehensively
if the effect of each diagnosis was additionally differen-
tiated by severity or disease duration. Finally, the ef fects
that specific disease combinations have on HRQL may be
more complex than described by pairwise interaction
terms. H owever, three-way or even higher order interac-
tions are complicated to interpret and their estimation is
likelytobeunstableinourdataduetosmallcellfre-
quencies of some three-way combinations. Nevertheless,
the pairwise disease interactions in our study can be con-
sidered as a reasonable approximation of potentially
more complex dependencies [35].
Conclusions
The effects of ch ronic conditions on HRQL in the older
population are not always pu rely additive. Our study
showed that the interactions between coronary pro-
blems, diabet es mellitus, and the history of stroke
caused greater impairments in HRQL m easured by the
EQ-5D than co uld be expected from the separate effects
of these conditions. Our findings emphasise the impor-
tance of comorbidity prevention in order to reduce the
health burden caused by the exacerbating effects of
specific disease combinations.
Acknowledgements
The KORA research platform (KORA, Cooperative Research in the Region of
Augsburg) was initiated and financed by the Helmholtz Zentrum München -
German Research Center for Environmental Health, which is funded by the
German Federal Ministry of Education and Research and by the State of Bavaria.
Author details
1
Helmholtz Zentrum München, German Research Center for Environmental
Health (GmbH), Institute of Health Economics and Health Care Management,
Ingolstädter Landstr. 1, 85764 Neuherberg, Germany.
2
Helmholtz Zentrum
München, German Research Center for Environmental Health (GmbH),
Institute of Epidemiology II, Ingolstädter Landstr. 1, 85764 Neuherberg,
Germany.
Authors’ contributions
MH devised the concept for the paper, performed the statistical analysis,
interpreted the data and drafted the manuscript. BT was involved in the
coordination of the study and commented on drafts of paper. MS was
involved in the interpretation of data. AD participated in the coordination of
the study. PM commented on drafts of paper. AP was involved in the
conception of the study. RH was involved in the conception of the study
and assisted in writing the manuscript. All authors have read and approved
the final version of the manuscript.
Competing interests
The authors declare that they have no competing interests. The KORA-Age
project was financed by the German Federal Ministry of Education and
Research (BMBF FKZ 01ET0713).
Received: 16 February 2011 Accepted: 18 July 2011
Published: 18 July 2011
References
1. Schram MT, Frijters D, van de Lisdonk EH, Ploemacher J, de Craen AJ, de
Waal MW, van Rooij FJ, Heeringa J, Hofman A, Deeg DJ, et al: Setting and
registry characteristics affect the prevalence and nature of
multimorbidity in the elderly. J Clin Epidemiol 2008, 61(11):1104-1112.
2. Fortin M, Hudon C, Haggerty J, Akker M, Almirall J: Prevalence estimates of
multimorbidity: a comparative study of two sources. BMC Health Serv Res
2010, 10:111.
3. Fortin M, Lapointe L, Hudon C, Vanasse A, Ntetu AL, Maltais D:
Multimorbidity and quality of life in primary care: a systematic review.
Health Qual Life Outcomes 2004, 2:51.
4. Greiner W, Weijnen T, Nieuwenhuizen M, Oppe S, Badia X, Busschbach J,
Buxton M, Dolan P, Kind P, Krabbe P, et al: A single European currency for
EQ-5D health states. Results from a six-country study. Eur J Health Econ
2003, 4(3):222-231.
5. Fortin M, Dubois MF, Hudon C, Soubhi H, Almirall J: Multimorbidity and
quality of life: a closer look. Health Qual Life Outcomes 2007, 5:52.
6. Heyworth IT, Hazell ML, Linehan MF, Frank TL: How do common chronic
conditions affect health-related quality of life? Br J Gen Pract 2009,
59(568):e353-358.
Hunger et al . Health and Quality of Life Outcomes 2011, 9:53
/>Page 8 of 10
7. Hodek JM, Ruhe A, Greiner W: [Multimorbidity and health-related quality
of life among elderly persons]. Bundesgesundheitsblatt
Gesundheitsforschung Gesundheitsschutz 2009, 52(12):1188-1201.
8. Maddigan SL, Feeny DH, Johnson JA: Health-related quality of life deficits
associated with diabetes and comorbidities in a Canadian National
Population Health Survey. Qual Life Res 2005, 14(5):1311-1320.
9. Rijken M, van Kerkhof M, Dekker J, Schellevis FG: Comorbidity of chronic
diseases: effects of disease pairs on physical and mental functioning.
Qual Life Res 2005, 14(1):45-55.
10. Saarni SI, Harkanen T, Sintonen H, Suvisaari J, Koskinen S, Aromaa A,
Lonnqvist J: The impact of 29 chronic conditions on health-related
quality of life: a general population survey in Finland using 15D and EQ-
5D. Qual Life Res 2006, 15(8):1403-1414.
11. Saarni SI, Suvisaari J, Sintonen H, Koskinen S, Harkanen T, Lonnqvist J: The
health-related quality-of-life impact of chronic conditions varied with
age in general population. J Clin Epidemiol 2007, 60(12):1288-1297.
12. Wang HM, Beyer M, Gensichen J, Gerlach FM: Health-related quality of life
among general practice patients with differing chronic diseases in
Germany: cross sectional survey. BMC Public Health 2008, 8:246.
13. Wee HL, Cheung YB, Loke WC, Tan CB, Chow MH, Li SC, Fong KY, Feeny D,
Machin D, Luo N, et al: The association of body mass index with health-
related quality of life: an exploratory study in a multiethnic Asian
population. Value Health 2008, 11(Suppl 1):S105-114.
14. Oldridge NB, Stump TE, Nothwehr FK, Clark DO: Prevalence and outcomes
of comorbid metabolic and cardiovascular conditions in middle- and
older-age adults. J Clin Epidemiol 2001, 54(9):928-934.
15. Poljicanin T, Ajdukovic D, Sekerija M, Pibernik-Okanovic M, Metelko Z, Vuletic
Mavrinac G: Diabetes mellitus and hypertension have comparable adverse
effects on health-related quality of life. BMC Public Health 2010, 10:12.
16. Wee HL, Cheung YB, Li SC, Fong KY, Thumboo J: The impact of diabetes
mellitus and other chronic medical conditions on health-related Quality
of Life: is the whole greater than the sum of its parts? Health Qual Life
Outcomes 2005, 3:2.
17. Sach TH, Barton GR, Doherty M, Muir KR, Jenkinson C, Avery AJ: The
relationship between body mass index and health-related quality of life:
comparing the EQ-5D, EuroQol VAS and SF-6D. Int J Obes (Lond) 2007,
31(1):189-196.
18. Yan LL, Daviglus ML, Liu K, Pirzada A, Garside DB, Schiffer L, Dyer AR,
Greenland P: BMI and health-related quality of life in adults 65 years and
older. Obes Res 2004, 12(1):69-76.
19. Jia H, Lubetkin EI: The impact of obesity on health-related quality-of-life
in the general adult US population. J Public Health (Oxf) 2005,
27(2):156-164.
20. Soltoft F, Hammer M, Kragh N: The association of body mass index and
health-related quality of life in the general population: data from the
2003 Health Survey of England. Qual Life Res 2009, 18(10):1293-1299.
21. World Health Organization Expert Committee on Physical Status: The use
and interpretation of anthropometry. World Health Organization. Geneva;
1995.
22. Kortt MA, Clarke PM: Estimating utility values for health states of
overweight and obese individuals using the SF-36. Qual Life Res 2005,
14(10):2177-2185.
23. Cook Z, Kirk S, Lawrenson S, Sandford S: Use of BMI in the assessment of
undernutrition in older subjects: reflecting on practice. Proc Nutr Soc
2005, 64(3):313-317.
24. Holle R, Happich M, Lowel H, Wichmann HE: KORA–a research platform for
population based health research. Gesundheitswesen 2005, 67(Suppl 1):
S19-25.
25. Lowel H, Doring A, Schneider A, Heier M, Thorand B, Meisinger C: The
MONICA Augsburg surveys–basis for prospective cohort studies.
Gesundheitswesen 2005, 67(Suppl 1):S13-18.
26. Lacruz ME, Emeny RT, Bickel H, Cramer B, Kurz A, Bidlingmaier M, Huber D,
Klug G, Peters A, Ladwig KH: Mental health in the aged: prevalence,
covariates and related neuroendocrine, cardiovascular and inflammatory
factors of successful aging. BMC Med Res Methodol 2010, 10:36.
27. Wood SN: Generalized Additive Models, An Introduction with R. London:
Chapman and Hall; 2006.
28. Stollenwerk B, Stock S, Siebert U, Lauterbach KW, Holle R: Uncertainty
assessment of input parameters for economic evaluation: Gauss’s error
propagation, an alternative to established methods. Med Decis Making
2010, 30(3):304-313.
29. Horton NJ, SR L: Multiple imputation in Practice: Comparison of Software
Packages for Regression Models with Missing Variables. The American
Statistician 2001, 55:244-254.
30. R Development Core Team: R: A Language and Environment for
Statistical Computing. Vienna, Austria: R Foundation for Statistical
Computing; 2010.
31. Schultz SE, Kopec JA: Impact of chronic conditions. Health Rep 2003,
14(4):41-53.
32. Smith AW, Reeve BB, Bellizzi KM, Harlan LC, Klabunde CN, Amsellem M,
Bierman AS, Hays RD: Cancer, comorbidities, and health-related quality of
life of older adults. Health Care Financ Rev 2008, 29(4):41-56.
33. Cuijpers P, van Lammeren P, Duzijn B: Relation between quality of life
and chronic illnesses in elderly living in residential homes: a prospective
study. Int Psychogeriatr
1999, 11(4):445-454.
34. Pittrow D, Stalla GK, Zeiher AM, Silber S, Marz W, Pieper L, Klotsche J,
Glaesmer H, Ruf G, Schneider HJ, et al: [Prevalence, drug treatment and
metabolic control of diabetes mellitus in primary care]. Med Klin (Munich)
2006, 101(8):635-644.
35. Fried LP, Bandeen-Roche K, Kasper JD, Guralnik JM: Association of
comorbidity with disability in older women: the Women’s Health and
Aging Study. J Clin Epidemiol 1999, 52(1):27-37.
36. Hodek JM, Ruhe AK, Greiner W: [Relationship between health-related
quality of life and multimorbidity]. Gesundheitswesen 2010, 72(8-9):455-465.
37. Speight J, Reaney MD, Barnard KD: Not all roads lead to Rome-a review of
quality of life measurement in adults with diabetes. Diabet Med 2009,
26(4):315-327.
38. Tanne D, Gottlieb S, Hod H, Reicher-Reiss H, Boyko V, Behar S: Incidence
and mortality from early stroke associated with acute myocardial
infarction in the prethrombolytic and thrombolytic eras. Secondary
Prevention Reinfarction Israeli Nifedipine Trial (SPRINT) and Israeli
Thrombolytic Survey Groups. J Am Coll Cardiol 1997, 30(6):1484-1490.
39. Tung CY, Granger CB, Sloan MA, Topol EJ, Knight JD, Weaver WD,
Mahaffey KW, White H, Clapp-Channing N, Simoons ML, et al: Effects of
stroke on medical resource use and costs in acute myocardial infarction.
GUSTO I Investigators. Global Utilization of Streptokinase and Tissue
Plasminogen Activator for Occluded Coronary Arteries Study. Circulation
1999, 99(3):370-376.
40. Adams RJ, Chimowitz MI, Alpert JS, Awad IA, Cerqueria MD, Fayad P,
Taubert KA: Coronary risk evaluation in patients with transient ischemic
attack and ischemic stroke: a scientific statement for healthcare
professionals from the Stroke Council and the Council on Clinical
Cardiology of the American Heart Association/American Stroke
Association. Circulation 2003, 108(10):1278-1290.
41. Solli O, Stavem K, Kristiansen IS: Health-related quality of life in diabetes:
The associations of complications with EQ-5D scores. Health Qual Life
Outcomes 2010, 8:18.
42. Flicker L, McCaul KA, Hankey GJ, Jamrozik K, Brown WJ, Byles JE,
Almeida OP: Body mass index and survival in men and women aged 70
to 75. J Am Geriatr Soc 2010, 58(2):234-241.
43. Michelson H, Bolund C, Brandberg Y: Multiple chronic health problems
are negatively associated with health related quality of life (HRQoL)
irrespective of age. Qual Life Res 2000, 9(10):1093-1104.
44. Bowling A: Mode of questionnaire administration can have serious
effects on data quality. J Public Health (Oxf) 2005, 27(3):281-291.
45. Holle R, Hochadel M, Reitmeir P, Meisinger C, Wichmann HE: Prolonged
recruitment efforts in health surveys: effects on response, costs, and
potential bias. Epidemiology 2006, 17(6)
:639-643.
46. Bradford A, Upchurch C, Bass D, Judge K, Snow AL, Wilson N, Kunik ME:
Knowledge of documented dementia diagnosis and treatment in
veterans and their caregivers. Am J Alzheimers Dis Other Demen 2011,
26(2):127-133.
47. Taylor AW, Price K, Gill TK, Adams R, Pilkington R, Carrangis N, Shi Z,
Wilson D: Multimorbidity - not just an older person’s issue. Results from
an Australian biomedical study. BMC Public Health 2010, 10:718.
48. Bayliss EA, Ellis JL, Steiner JF: Subjective assessments of comorbidity
correlate with quality of life health outcomes: initial validation of a
comorbidity assessment instru ment. Health Qual L ife Outcomes 2005,
3:51.
49. Bush TL, Miller SR, Golden AL, Hale WE: Self-report and medical record
report agreement of selected medical conditions in the elderly. Am J
Public Health 1989, 79(11):1554-1556.
Hunger et al . Health and Quality of Life Outcomes 2011, 9:53
/>Page 9 of 10
50. Meisinger C, Schuler A, Lowel H: Postal questionnaires identified
hospitalizations for self-reported acute myocardial infarction. J Clin
Epidemiol 2004, 57(9):989-992.
51. Haacke C, Althaus A, Spottke A, Siebert U, Back T, Dodel R: Long-term
outcome after stroke: evaluating health-related quality of life using
utility measurements. Stroke 2006, 37(1):193-198.
52. Schweikert B, Hunger M, Meisinger C, Konig HH, Gapp O, Holle R: Quality
of life several years after myocardial infarction: comparing the MONICA/
KORA registry to the general population. Eur Heart J 2009, 30(4):436-443.
doi:10.1186/1477-7525-9-53
Cite this article as: Hunger et al.: Multimorbidity and health-related
quality of life in the older population: results from the German KORA-
Age study. Health and Quality of Life Outcomes 2011 9:53.
Submit your next manuscript to BioMed Central
and take full advantage of:
• Convenient online submission
• Thorough peer review
• No space constraints or color figure charges
• Immediate publication on acceptance
• Inclusion in PubMed, CAS, Scopus and Google Scholar
• Research which is freely available for redistribution
Submit your manuscript at
www.biomedcentral.com/submit
Hunger et al . Health and Quality of Life Outcomes 2011, 9:53
/>Page 10 of 10