báo cáo khoa học:" Dimensional structure of the oral health-related quality of life in healthy Spanish workers" potx
Bạn đang xem bản rút gọn của tài liệu. Xem và tải ngay bản đầy đủ của tài liệu tại đây (434.99 KB, 9 trang )
RESEARC H Open Access
Dimensional structure of the oral health-related
quality of life in healthy Spanish workers
Javier Montero
1*
, Manuel Bravo
2
, María-Purificación Vicente
3
, María-Purificación Galindo
3
, Joaquín F López
1
,
Alberto Albaladejo
1
Abstract
Background: Oral health-related quality of life (OHQoL) is conceived as a multidimensional construct. Here our aim
was to investigate the dimensional structure of OHQoL as measured by the Spanish versions of the Oral Impacts
on Daily Performance (OIDP) and the Oral Health Impact Profile (OHIP-14) questionnaires applied simultaneously.
Methods: We recruited a consecutive sample of 270 healthy Spanish workers visiting the Employment Risk
Prevention Centre for a routine medical check-up. OHIP-14 was self-completed by participants but the OIDP was
completed in face-to-face interviews. An Exploratory Factor Analysis (EFA) was performed to identify the underlying
dimensions of the OHQoL construct assessed by both instruments. This factorial structure was later confirmed by
Confirmatory Factor Analysis (CFA) using several estimators of goodness of fit indices.
Results: EFA and the CFA identified and respectively confirmed a set of 3 underlying factors in both
questionnaires that could be interpreted as functional limitation, pain-discomfort, and psychosocial impacts. The
model achieved was seen to fit properly for both instruments, but the factorial structure was clearer for the OIDP.
Conclusions: The results provide evidence for construct equivalence in the latent factors assessed by both OIDP
and OHIP-14, suggesting that OHQoL is a three-dimensional con struct. The prevalence of impact on these three
factors was coherent between both indicators, pain-discomfort having the highest prevalence, followed by psycho-
social impact, and functional limitation.
Background
Oral health-related quality of life (OHQoL) is a multidi-
mensional construct that refers to the extent to which
oral problems disrupt an individual’s normal functioning
[1,2]. The multidimensional nature of OHQoL is also
recognized in the most widely accepted theoretical
model of oral health reported by Locker [3], which pos-
tulates that there are five consequences of ora l disease
(impairmen t, functional limita tion, pain/discomfort, dis-
ability, and handic ap) and that these are related sequen-
tially. Consequently, all OHQoL indicators group their
items within different topic categories, but the number
and nature of these categories vary across instruments.
Moreover, the assignment of items within the dimen-
sions of OHQoL indicators are mostly based on authors’
expert knowledge of the theoretical framework. How-
ever, some statistical methods, such as exploratory and
confirmatory factor analyses, are mandatory for explor-
ing the underlying multivariable relationships and could
be helpful in building up a picture of what is really
being measured.
Using principal component facto r analysis, some
authors have considered OHQoL in adults or the elderly
as a single construct [4,5]. In contrast, however, others
have identified a range of three-to-five latent dimensions
related to physical, psychological and social performance
in the OHQoL construct of adults or the elderly [6-8].
One recent European project [9] has recommended
focusing on three major OHRQoL indicators: OHIP-14
[10], OHQoL-UK [11] and OIDP [12]. Of these, the two
most widely used and internationally accepted are
OHIP-14 and OIDP. Both instruments are based on
Locker’s well-established conceptual model [3] and have
recently been validated in Spain [13,14].
Whereas the psychometric properties of both instru-
ments (reliability and validity) have been found to be
satisfactory in a variety of cultural contexts, the
* Correspondence:
1
Department of Surgery. University of Salamanca. Salamanca. Spain
Montero et al. Health and Quality of Life Outcomes 2010, 8:24
/>© 2010 Montero et al; licensee BioMed Central Ltd. This is an Open Access article distributed under the terms of the Creative
Commons Attribution License ( which permits unrestricted use, distribution, and
reproduction in any medium, provided the original work is properly cited.
dimensional structure of both indicators is still a contro-
versial issue, and presumably both of them should mea-
sure the same construct from different perspectives: one
using a severity-based approach (OIDP) and the other
using a frequency-based approach (OHIP) for summar-
izing the perceived impacts on the OHQoL. It would
also be desirable to identify a set of core constructs for
cross-cultural comparisons of oral wellbeing or to
shorten the questionnaires available on the basis the
major dimensions detected.
Based on our previous experiences [13,14], we
hypothesized that oral health-related quality of life, in
spite of being a single construct, could comprise at least
3 dimensions conceived as pain-discomfort, eating p er-
formance and aesthetics because we had observed that
individuals seemed to understand these dimensions to
be distinct aspects of oral wellbeing. For example, visibly
stained teeth could only affect the aesthetic dimension
but not the other two; shortened dental arches could
only affect eating performance but not the other two,
and sensitive teeth could only affect the pain-discomfort
dimension but not the other two. Of course, several
clinical conditions could partially or totally i mpinge on
these dimensions.
The present work aims to identify the dimensional
structure of OHQoL in a healthy Spanish workers by
applying Confirmatory Factor Analysis to these two
widely accepted instruments.
Methods
Study design
A cross-sectional epidemiological study was performed
in the City of Granada and its province. A consecutive
sample of 295 heal thy workers visiting the Employment
Risk Prevention Centre for a routine medical check-up
were invited to take part in the study, 270 of whom
finally participated in the study (91.5%), although the
drop-outs were similar in terms of their socio-demo-
graphic characteristics. All interviewees were briefed
about the purpose of the study and written consent was
sought for questionnaire -led interviews and simple oral
examinations. Individuals younger than 25 years of age
or seeking dental treatment were excluded, because we
wished to assess the construct of OHQoL in a mature
dental population with no acute oral prob lems in order
to obtain a baseline picture of the construct in this sam-
ple, which could be compared in the future with some
other sociodemographic profiles of adults or even with a
representative sample of the Spanish population.
Instruments
The OHIP-14 (Oral Health Impact Profile) comprises 14
items that explore seven dimensions of impact (func-
tional limitation, pain, psychological discomfort, physical
disability, psychological disability, social disability, and
handicap) and participants respond to each item accord-
ing to the frequency of impact on a 5-point Likert scale
ranging from never to very often (never = 0, hardly ever
= 1, occasionally = 2, fairly often = 3, very often = 4),
using a twelve-months recall period.
In the original development of this instrument, factor
analysis revealed a single underlying factor that
accounted for almost the 70% of the variance [10]. How-
ever, later research performed in Germany using the
extended version reported a parsimonious set of dimen-
sions termed oral functions, pain, and psychosocial
impact [8].
The OIDP (Oral Impacts on Daily Performances)
questionnaire assesses the impacts of oral conditions on
the abilities of individuals to perform eight daily activ-
ities. For each dimension (eating, speaking, hygiene,
occupational activities, social relations, sleeping-relaxing,
smiling, and emotional state), the severity and either the
frequency or duration of each impact are recorded on a
Likert scale. Firstly, individuals responded whether or
not problems with the mouth, teeth or dentures had
caused them any difficulty with each of the eight activ-
ities in the past six months. If the answer was “ no” the
item score was coded as “0”, and we enquired as to the
presence of difficulty with the next item. However, if the
answer was “yes”, the frequency and severity of this dif-
ficulty had to be assessed. Frequency had to be recorded
only if the subject had this difficulty on a regular basis
over the past six months, being coded as f ollows: less
often than once a month = 1; about 1-2 times a month
= 2; about 1-2 times a week = 3; about 3-4 times a
week = 4; every day or nearly every day = 5. Neve rthe-
less, if individuals perceiv ed that this difficulty to
affected them only for a part of this 6-month period,
then the duration of this event was recorded, coding the
responses as follows: for 5 days or less = 1; for more
than 5 days, up to a month = 2; for more than 1, up to
2 months = 3; for more than 2, up to 3 months = 4; for
more than 3 months = 5. Then, individuals expressed
how much effect the difficulty had on their everyday
life, coding the responses as follows: no effect = 0; a
very minor effect = 1; a fairly minor effect = 2; a moder-
ate effect = 3; a fairly severe effect = 4, a very severe
effect = 5.
This instrument has commonly been applied as a one-
dimensional construct, in terms of a single OIDP sum-
mary score, but recently a three-dimensional structure
(designated as physical, psychological and social
impacts) has been confirmed statistically [15-17].
Here, the OHIP was self-completed by participants in
a waiting room, whereas the OIDP was completed in
face-to-face interviews in a quiet private room by a
trained and calibrated examiner (MJ) to overcome the
Montero et al. Health and Quality of Life Outcomes 2010, 8:24
/>Page 2 of 9
complexities of the instrument. Furthermore, these were
the administration methods recommended by the origi-
nal authors [10,12] and we therefore considered them to
be the best approach to detect the underlying dimen-
sions of the construct. The examiner ensured full com-
pletion of the OHIP-14, before starting the interview
with the OIDP.
In both instruments, an additive total scoring method
was used. For the OHIP, it was calculated by summing
the item codes for the 14 items. For the OIDP, total
impact was quantified by summing the item scores,
which were obtained by multiplying the frequency and
severit y scores for each of the eight items, and convert-
ing this total score into a percentage format. This scor-
ing system yields an intuitive oral impact score. The
frequency and severity scores are Likert-type scales, but
a zero score is only possible for severity. Hence, severity
is weighted and can produce a zero score for an item-
related impact if the individual considers that there is
no effect on daily life activities.
To estimate the prevalence of impacts, the presence
of any impact was recorded for each measure or
domain. For OHIP, an impact was recorded as present
ifitwasreportedatthethresholdof“ occasional” or
more frequently (≥2 on the 5-point Likert scale). For
OIDP, an impact was considered if it was recorded at
amoderateormoreseverelevel(≥3inthe6-point
Likert scale).
Data analysis
An Exploratory Factor Analysis (EFA) was performed on
one half of the sample (n = 135) to identify the latent
dimensions of OHQoL. Factors with an eigenvalue of
less than 1 were disregarded. A varimax rotation was
conducted to achieve a simpler structure. Items were
assigned to the rotated factors when t hey had a loading
of 0.5 or higher on a single factor [18].
Later, Confirmatory Factor Analysis (CFA) was applied
to the data from the other half o f the sample to verify
the factor structure. The goodness-of-fit of the model to
the data was evaluated using the following parameters.
The Chi-square test, which indicates the amount of dif-
ference between expected and observed covariance
matrices. A Chi-square value close to zero indicates lit-
tle difference between the expected and observed covar-
iance matrices. In addition, the probability level must be
greater than 0.05 when Chi-square is close to zero.
Equivalently, Chi-Square/DF ≥ 3 indicates an unaccepta-
ble model fit, although this index is strongly influenced
by sample size [19]. The comparative fit index (CFI) is
equal to the discrepancy function adjusted for sample
size. The CFI ranges from 0 to 1, a higher value indicat-
ing better model fit. An acceptable model fit is indicated
by a CFI value of 0.90 or greater [20].
The Root Mean Square Error o f Approximation
(RMSEA) is related to the residual error in the model.
RMSEA values range from 0 to 1, a smaller RMSEA
value indicati ng a better model fit. An acceptable model
fit is indicated by an RMSEA value of 0.06 or less [20].
To evaluate the statistical signification of RMSEA, the
“p-close” value has been proposed [21]; that is, the p-
value to test the null hypothesis (RMSEA ≤ .05). A n
acceptable value of p-close should be >0.05.
An overall conclusion about the fit of each model can
be obtained by considering these indices sim ultaneously,
as recommended by Schermelleh-Engel et al.[22],and
by obtaining at least three fit statistics indicating an
acceptable fit.
Once the factorial structure h as been confirmed, the
parameter estimates are examined as follows: the critical
ratio (CR) of each parameter estimate divided by its
standard error is distributed as a z statistic and is signif-
icantatthe0.05levelifitsvalueexceeds1.96,andat
the 0.01 level if its value exceeds 2.56 [23].
EFA was performed with the Statistical Package for
the Social Sciences (SPSS v.15) whereas CFA was per-
formed with the AMOS computer software program,
version 7.0 [24].
Results
Sample profile
Since the factorial structure might vary across the gen-
der and socio-demographic characteristics of a popula-
tion, and since this is of importance when it comes to
designing intervention programs, it is necessary to
describe the study sample (Table 1). The mean age of
the participants was 45.2 ± 9.5 yrs (c ± SD): 45.6% were
male; 83.3% were non-manual workers, and 57% lived in
the City of Granada. In behavioural terms, 93% of sub-
jects brushed the ir teeth at least once a day and 36.3%
routinely visited their dentist at least once a year. On
cli nical examinati on, most participants had a good state
of oral health. The sample had a mean of 26.4 ± 4.2
standing natural teeth, with 17.8 ± 5.6 healthy non-
restored teeth. The decayed, missing and filled teeth
index (DMFT) was 10.7 ± 5.0, of which a mean of 3. 2 ±
2.5 teeth were decayed; 3.3 ± 3.7 were missing, and 4.3
± 3.5 were filled. The periodontal status afforded a CPI
score of zero in 3.1 ± 2.2 of sextants. More than 90% of
the subjects were dentate without dentures.
Factorial Structure
For both indicators, the measurement of sampling ade-
quacy (Kaiser-Meyer-Olkin) and significance level of
Bartlett’s test of sphericity (p-value < 0.001) indicated
that there were probably significant relationships among
items, and that the data were suitable for factor analysis
(Table 2 and 3). For both indicators, three components
Montero et al. Health and Quality of Life Outcomes 2010, 8:24
/>Page 3 of 9
with eigenvalues above 1 emerged from the factorial
analysis and were supported by the elbow in the corre-
sponding scree plot of e igenvalues. In the OIDP, these
three factors explained 64.3% of the total variance
(Table 2), while in the OHIP-14 they explained 58.1%
(Table 3). The fact or loadings are depicted in the
rotated component matrix. For the OIDP, the first factor
(termed “ Functional Limitation” ) comprised items
related to speaking, hygiene, occupational and, partially,
to eating. Factor 2 (designated “Psychosocial Impact”)
comprised social relations and smiling. Factor 3 (labelled
as “Pain-discomfort” ) comprised the items referred to
sleeping-relaxing, emotional state and, partially to eating.
IntheOHIP-14,thesamefactorsemergedfromthe
rotated matrix: Factor 1 represented the “Psychosocial
impact"; Factor 2 the “Pain-discomfort” ,andFactor3
the “Functional limitation”.Item5(Self-consciousness)
had a mixed load between Psychosocial and Pain-dis-
comfort factors. All factors in both indicators had alpha
values ranging between 0.46 and 0.84.
Fit Statistics
The CFA carried out i ndicated an excellent fit of the
model for the OIDP [c2/d.f= 1.40, p = 0.13, CFI= 0.99,
RMSEA= 0.04, p-close= 0.66] and an acceptable fit of
the model for the OHIP [c2/d.f= 2.09, CFI= 0.95,
RMSEA= 0.06, p-close= 0.06]. The null hypothesis that
this model fits the data was confirmed. Considering the
ratio of the Chi-square statistic to the accompanying
degrees of freedom, a ratio of 1.40 for the OIDP and
2.09 for the OHIP (both < 3) were considered to
Table 1 Sociodemographic, behavioural and clinical
description of the sample (n = 270).
SOCIODEMOGRAPHICS VARIABLES n %
Sex
Male 123 45.6
Female 147 54.4
Social Class
a
High 113 41.8
Medium 112 41.5
Low 45 16.7
Residence
Urban 154 57.0
Rural 116 43.0
Age (Mean ± SD) 45.2 ± 9.5
<34 yrs 39 14.4
35-44 yrs 85 31.5
45-54 yrs 99 36.7
55- 65 yrs 47 20.4
BEHAVIOURAL VARIABLES n %
Brushing habits
2-3 times/day 181 67.0
Once/day 70 25.9
Less than once/day 19 7.0
Dental visit pattern
Check-up visits 98 36.3
Problem-based visits 172 63.7
CLINICAL VARIABLES Mean ± SD
Prosthodontic variables
Missing teeth 3.3 ± 3.7
Replaced teeth 1.3 ± 2.8
Occlusal Units 6.4 ± 2.2
Aesthetic Units 5.7 ± 1.0
Standing teeth 26.4 ± 4.2
Number of replaceable teeth 1.4 ± 2-2
Caries variables
Decayed teeth 3.2 ± 2.5
Healthy restored teeth 4.3 ± 3.5
DMFT (Decayed Missing and Filled Teeth) 10.7 ± 5.0
Healthy non-restored teeth 17.8 ± 5.6
Periodontal variables
b
Sextants with CPI = 0 3.1 ± 2.2
Sextants with CPI = 1 0.9 ± 1.4
Sextants with CPI = 2 0.5 ± 0.8
Sextants with CPI = 3 1.1 ± 1.6
Sextants with CPI = 4 0.1 ± 0.5
a
Social Class was estimated in occupational terms as follows: High: skilled
non-manual worker; Medium: skilled manual worker; Low: non-skilled manual
worker.
b
CPI: Community Periodontal Index
SD: Standard deviation
Table 2 OIDP Item Loadings > 0.50 from Exploratory
Factor Analysis followed by Varimax Rotation
ITEMS Factor 1 Factor 2 Factor 3
Speaking 0.75
Cleaning 0.65
Occupational 0.80
Social relations 0.83
Smiling 0.83
Eating 0.40 0.56
Sleeping-relaxing 0.83
Emotional state 0.69
Eigenvalues 2.9 1.3 1.1
Variance explained 22.9 20.9 20.4
Cumulative variance 22.9 43.9 64.3
Alpha 0.60 0.71 0.60
Kaiser-Meyer-Olkin measure of sampling adequacy: 0.72
Bartlett’s test of sphericity: c
2
, d.f; p-value = 454.04, 28; p < 0.001
Montero et al. Health and Quality of Life Outcomes 2010, 8:24
/>Page 4 of 9
represent acceptable model fits. Moreover, the root
mean square error of approximation (RMSEA) for both
instruments was greater than the 0.06 criterion (p-close
also >0.05) and, additionally, the Comparative Fit Index
(CFI) value met the criterion (0.90 or larger) for accep-
table model fit.
Thus, the CFA analysis confirmed the three-factor
structure for both the OIDP (Table 4) and the OHIP-14
(Table 5), and all parameter estimates for the confirma-
tory factor model were significant at the 0.001 level.
While unstandardized parameter estimates retain scaling
information of variables and can only be interpreted
with reference to the scales of the variables, standar-
dized parameter estimates are transformations of
unstandardized estimates that remove scaling and can
be used for informal comparisons of parameters within
the model. Thus, standardized estimates correspond to
effect-size estimates. Table 4 shows that regarding the
factor termed “Functional Limitation”,theoccup ationa l
item is the most relevant one, followed sequentially by
speaking and cleaning. Within the dimension termed
“Psychosocial impact” the social item is the most related
one, and within the dimension termed “Pain-discom-
fort”,theslee ping-re laxing item is the strongest factor-
related one. Likewise, Table 5 shows that regarding the
latent factor termed “Psychosocial impacts”, item 6 (ten-
sion) is the most related, followed by item 11 (irritable)
while, by contrast, the least related is item 14 ( unable to
function). With regard to factor 2 terme d “Pain-discom-
fort”, the most related item is OHIP-8 (interrupt meals),
followed by item 4 (uncomfortable eating). For the third
dimension, called “Functional Limitation”, the item with
the greatest weight is item 1 (speaking).
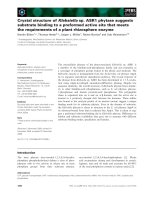
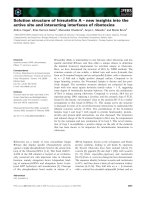
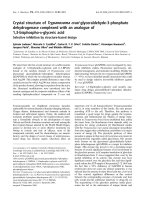
The proposed models for OIDP and OHIP-14 are
depicted in Figures 1 and 2 respectively. In these mod-
els, a residual relationship between dimensions can be
observed through some items: i.e., in the case of the
OIDP some interaction is observed between eating and
hygiene items and between the sleeping-relaxing and
speaking items for the OIDP (Figure 1). The residual
relationships between the OHIP items are depicted in
Figure 2. For the OIDP, the inter-factor correlations
between Pain and Psychosocial was 0.51; between Pain
and Functional limitatio n it was 0.64, and between Psy-
chosocial and Functional limitation it was 0.41. For the
OHIP these c orrelations were 0.71, 0.59 and 0.60
respectively.
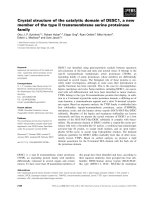
Since these three factors could be conceived as match-
ing among the indicators, an estimation of the preva-
lenceofimpactinthePsycho-social, Pain-discomfort
and Functional limitations dimensions is depicted in
Table 3 OHIP Item Loadings > 0.50 from an Exploratory
Analysis followed by Varimax Rotation
ITEMS Factor 1 Factor 2 Factor 3
OHIP-1: Speaking 0.78
OHIP-2: Sense of taste 0.78
OHIP-3: Painful aching 0.76
OHIP-4:Uncomfortable eating 0.86
OHIP-5: Self-conscious 0.54 0.42
OHIP-6: Tension 0.68 0.38
OHIP-7: Unsatisfactory diet 0.32 0.67
OHIP-8: Interrupt meals 0.61
OHIP-9: Difficult to relax 0.60
OHIP-10: Embarrassed 0.71
OHIP-11: Irritable 0.66 0.36
OHIP-12: Occupational 0.61 0.32
OHIP-13: Unsatisfactory life 0.79
OHIP-14: Unable to function 0.70
Eigenvalues 3.8 2.8 1.6
Variance explained 27.2 19.7 11.2
Cumulative variance 27.2 46.9 58.1
Alpha 0.84 0.78 0.46
Kaiser-Meyer-Olkin measure of sampling adequacy: 0.89
Bartlett’s test of sphericity: c
2
, d.f; p-value = 1484.49, 91; p < 0.001
Table 4 Parameter estimates of unstandardized and standardized regression weights for the three-factor model of the
OIDP.
Item FACTORS Unstandardized Regression Weights S.E. C.R. p-value Standardized Regression Weights
Speaking Functional limitation 1.00 0.69
Cleaning 0.80 0.146 5.53 *** 0.40
Occupational 1.05 0.138 7.59 *** 0.81
Social Psychosocial Impact 1.00 0.67
Smiling 1.00 0.84
Eating Pain-Discomfort 1.00 0.58
Emotion 0.94 0.151 6.23 *** 0.58
Sleep-relax 1.03 0.169 6.12 *** 0.60
S.E. Standard error. C.R. Critical ratio
All items are statistically significant. p =*** means p < 0.000
Montero et al. Health and Quality of Life Outcomes 2010, 8:24
/>Page 5 of 9
Figure 3 using the OIDP and OHIP. A higher prevalence
of impact in these dimensions can be seen when the
OHIP was used than when the OIDP was employed,
although there is a certain degree of harmony in the
trends of prevalence of three factors in both indicators,
Pain-discomfort having the highest prevalence, followed
by Psycho-social impact, and Functional Limitation.
Discussion
This study focused on exploring t he dimensions of the
OHQoL construct as measured by two well known
instruments (OIDP and OHIP-14) in a consecutive sam-
ple of healthy Spanish workers. To our knowledge, this
is the first study that has focused on exploring the fac-
torial structure of OHQoL by using these instruments
simultaneously, although some authors have analyz ed
dimensions using a generic instrument (such as the EQ-
5D) and the OHIP-14 simultaneously in South-Austra-
lian patients [25]. They conclude that both instruments
cover an overlapping domain of pain, but are discrepant
as regards the specific aspects encompas sed within phy-
sical, psychological and social wellbeing.
In the present study, sample size (n = 270) and the
high response rate (91.5%) of this pseudo-probabilistic
method of subject recruitment seem to be acceptable
for such an objective. However, since perceptions of
health and disability are influenced by the social, cul-
tural and political context in which they are assessed,
and since our convenience sample of healthy workers
does not ref lect the gen eral Spanish population, it was
considered at least necessary to check whether the
dimensions identified by the EFA in half of the sample
were consistently confirmed by CFA in the other half
using the usual goodness-of-fit measurements. The
rationale of th is focuses on assuring the external validity
of the dimensions initially identified.
While EFA simply requires a determination of the fac-
tor structure (model) and an explanation of the maxi-
mum amount of variance, CFA requires apriori
specification of a model, the number of factors, knowl-
edge of which items load on each factor, a model sup-
ported by theory and error e xplicitness. In our study,
since no hypotheses have been consistently stated
because of the lack of consensus in the literature (some
researchers have identified a 3-factor structure while
others have used those measures assuming only a one-
fact or underlying structure) the information necessary to
specify the model was captured from EFA. CFA specifi-
cally, relies on several statistical tests to determine the
adequacy of model fitting to the data. However, some
shortcomings should be taken into account when inter-
preting the findings, because although this method iden-
tified the structure that best fitted the data, the fit indices
did not preclude other structures from providing equally
good or even better fits, and ultimately the process relied
on subj ective consideration of the best model, in an
attempt to be coherent with the hypothesized underlying
theory. In the present study, CFA was used to lend quan-
titative support to a qualitative interpretation.
The evidence suggests that health-related quality of
life is multidimensional, including physical, psychologi-
cal and social dimensions [26]. Thus, being a subset of
this it sho uld be assumed that OHQoL is also multidi-
mensional [27]. In the present study, the CFA confirmed
that a three-factor model fitted the data well, supporting
the hypothesis that the construct measured by both
Table 5 Parameter estimates of unstandardized and standardized regression weights for the three-factor model of the
OHIP-14.
Item FACTORS Unstandardized Regression Weights S.E. C.R. p-value Standardized Regression Weights
OHIP5 Psychosocial Impacts 1.00 0.65
OHIP6 1.03 0.095 10.85 *** 0.81
OHIP9 0.92 0.098 9.43 *** 0.67
OHIP10 0.71 0.079 9.04 *** 0.64
OHIP11 0.74 0.073 10.17 *** 0.74
OHIP12 0.38 0.043 8.71 *** 0.61
OHIP13 0.57 0.061 9.46 *** 0.68
OHIP14 0.18 0.023 7.64 *** 0.53
OHIP3 Pain-discomfort 1.00 0.53
OHIP4 1.57 0.163 9.68 *** 0.71
OHIP7 1.18 0.159 7.40 *** 0.71
OHIP8 1.04 0.138 7.52 *** 0.74
OHIP1 Functional limitation 1.00 0.66
OHIP2 1.00 0.47
S.E. Standard error. C.R. Critical ratio
All items are statistically significant. p =*** means p < 0.000
Montero et al. Health and Quality of Life Outcomes 2010, 8:24
/>Page 6 of 9
questionnaires consists of three domains, interpreted as
functional limitation, pain-discomfort and psychosocial
impacts, all of them already p resent in the multidimen-
sional Locker model [3] on which both instruments
were based. These dimensions have been repo rted pre-
viously by other authors using either the extended ver-
sion of the OHIP, on German adults [8], or the OIDP,
on Tanzanian adults [15], or an expert-based set of
items on Swedish adults [28]. Also, the same number of
domains and with a similar nature have also been
reported for children in Perú [16], Tanzania [17] and
Hong Kong. [29].
In general there is some ag reement with previous stu-
dies focusing on the dimensions measured by the
OHIP-14, because pain-related items (items 3, 4, 8 and
7) and some psychosocial-related items such as items 6,
9, 12 and 13 were consistently assigned to the so-called
dimensions, as reported elsewhere [25]. In contrast, the
items reported here as belonging to functional limitation
(item1and2)wereincluded within the Psychosocial
dimension upon perfo rming EFA [25]. Furthermore, it
was found that for the OHIP-14 the first facto r strongly
dominated the factorial structure, although the other
two dimensions were also significant.
With respect to the OIDP, a three-dimensional struc-
ture in which the social and smiling items were grouped
together in the same domain was also found, as reported
elsewhere [15-17]. Moreover it was also observed here
that eating, sleeping-relaxing and emotional state shared
the same factor (Table 4), as has been found for adults
[15] and for children [17]. However, we have interpreted
this domain as a pain-discomfort dimension while those
authors interpreted it as a functional or psychological
dimension respectively. Our interpretation was based on
previous studies carried o ut on the same reference
population, in which “oral pain-discomfort ” wa s the
most predominant cause of impact within those items
[13]. Notwithstanding, this fact was also evident in Tan-
zanian children [17] in whom pain-discomfort events
were the most prevalent causes of impact within all
Psychosocial
impact
Self-conscious
e5
1
1
Tension
e6
1
Difficult to relax
e9
1
Embarrassed
e10
1
Irritable
e11
1
Occupational
e12
1
Unsatisfactory life
e13
1
Unable to function
e14
1
Pain-
Discomfort
Painful aching
e3
Uncomfortable eating
e4
Unsatisfactory diet
e7
Interrupt meals
e8
1
1
1
1
1
Functional
limitation
Speaking
e1
Sense of taste
e2
1
1
1
1
Figure 2 Hypothesized three-factor mode of the 14-item Oral
Health Impact Profile (OHIP-14). Random measurement errors
denoted as e1-e14.
Functional
Limitation
Speaking
esp
1
1
Cleaning
ehy
1
Occupational
eoc
1
Psychosocial
Impact
Social relations
esr
Smiling
esm
1
1
Pain-
Discomfort
Eating
eea
Sleeping-relaxing
esl
1
1
1
Emotional state
ees
1
1
1
Figure 1 Hypothesized three-factor model of the eight-item
Oral Impacts on Daily Performances (OIDP). Random
measurement errors denoted as esp, ,ees, respectively
Percenta
g
e of sub
j
ects with im
p
act
Figure 3 Percentage of subjects with impact among the
dimensions supported by the factorial solution using both the
OIDP and the OHIP.
Montero et al. Health and Quality of Life Outcomes 2010, 8:24
/>Page 7 of 9
items except for speaking, cleaning and smiling,and
mostly in the sleeping, emotion, occupational and eating
items. In children [16,17]eating and cleaning were found
to belong to t he same physical domain. Our results also
indicate that eating is partially loaded on the functional
limitation dimension, as is cleaning (Table 2), and that
also there is still a residua l relationship between both
items in the model (Figure 1), although in our setting
this item loaded higher on a factor shared with sleeping-
relaxing, as reported for adults [15].
Our findings are expected at least to contribute to an
important ongoing discussion about the exploration of
the dimensions of the OHQoL that will permit the
development of a preliminary theory for furth er testing
in different s ettings (structural reliability). It has been
reported that the process of assessing the validity of
OHQoL indicators should continuously evaluate the
theoretical framework and the content of the construct
within the natural environment of the population in
question [30,31]. The theoretical background postulated
that all dimensions may be disturbed sequentially; for
example a pain-related condition may affect physical,
psychological or social performance and may even gen-
erate handicap. Thus, the data gathered with both
instruments could reflect the effect of oral conditions
with multidimensional impact. In this sense, it must be
accepted that OHQoL dimensions overlap to a certain
degree, and hence share a considerable amount of infor-
mation that could be categorized and justified for tech-
nical reasons but that ultimately reflect the notion that
the main d omains in OHQoL are to some extent inter-
connected (all inter-factor correlations reported in this
study were above 0.40).
In sum, we believe that OHQoL measures refer to at
least three dimensions, although since some clinical
entities are able to affect several dimensions simulta-
neously and since all factor analysis methods are based
on the intercorrelation of i tems, it would seem that the
construct is somewhat overlapped. Nevertheless, the fact
is that most oral conditi ons could have impact on more
than one dimension. This could be w hy other authors
have reported that only a single component emerged
from their factor analyses and explained more than 60%
of the variance [4,10,11], because several items may be
highly correlated as a result of a common oral d isease
(toothache, edentulousness ). Thus, it could be recom-
mendable to choose an oblique rotation method, as
done by Bernabé et al [16], in which the factors are not
orthogonal; that is, they are inter-correlated, which is
exactly what was found in the present study and what
has been discussed by several authors [15-17,25-29].
This study has some limitations, mainly with regard to
the sample profile studied, because the participants
(healthy Spanish workers) were not representative of the
general population of similar ages. Therefore, the pre-
sent findings are only valid for the group for which they
were obtained and should never be extended to the
adult Spanish population. Further studies are needed to
corroborate our results in other, broader settings.
Furthermore, studies directed toward specific oral condi-
tions would be able to find which dimensions are mainly
affected in such conditions, because it would be
expected that the impact of orthodontic needs would be
higher in the Psychosocial dimension than in the Pain-
discomfort dimension.
Conclusions
The present study revealed a clear distinction within the
construct of the OHQoL in three qualitatively different
components (Psychosocial, Pain-discomfort and Func-
tional limitation), with high consistency, integrated
within the theoretical background. Furthermore, this
factorial structure seems to be shared by OIDP and
OHIP. We did not undertake a factoria l analysis to
derive a subset of items of the OIDP and OHIP but sim-
ply to v isualize and co mpare the underlying factors of
the multifactorial construct they were measuring.
Accordingly, the construct seems fairly coherent as
regards both instruments and can therefore presumably
be applied to other OHQoL instruments implemented
among the same age-range populations.
Acknowledgements
Data collection was funded by the corresponding author’s fellowship from
the Spanish Ministry of Culture and Education.
Authors are grateful to the reviewers of this manuscript for the gentle
suggestions made and the insights shared during the revision process.
Author details
1
Department of Surgery. University of Salamanca. Salamanca. Spain.
2
Department of Preventive and Community Dentistry. University of Granada.
Granada. Spain.
3
Department of Biostatistics. University of Salamanca.
Salamanca. Spain.
Authors’ contributions
BM conceived and coordinated the study from its design to the manuscript
confection. MJ carried out the study and drafted the manuscript. AA and LJ
made substantial contributions to the interpretation of data. VP and GP
performed the data analysis and helped to draft the manuscript. All authors
read and approved the final manuscript.
Competing interests
The authors declare that they have no competing interests.
Received: 14 November 2009
Accepted: 21 February 2010 Published: 21 February 2010
References
1. Locker D: Applications of self-reported assessments of oral health
outcomes. J Dent Educ 1996, 60:494-500.
2. Sheiham A, Spencer J: Health needs assessment. Community oral health
Oxford: WrightPine CM 1997, 39-54.
3. Locker D: Measuring Oral Health: A conceptual framework. Community
Dent Health 1988, 5:3-18.
Montero et al. Health and Quality of Life Outcomes 2010, 8:24
/>Page 8 of 9
4. Atchison KA, Dolan TA: Development of the geriatric oral health
assessment index. J Dent Educ 1990, 54:680-7.
5. McGrath C, Bedi R: An evaluation of a new measure of oral health
related quality of life–OHQoL-UK(W). Community Dent Health 2001,
18:138-143.
6. Leao A, Sheiham A: The development of a socio-dental measure of
dental impacts on daily living. Community Dent Health 1996, 13:22-6.
7. Strauss RP, Hunt RJ: Understanding the value of teeth to older adults:
influences on the quality of life. J Am Dent Assoc 1993, 124:105-10.
8. John MT, Hujoel P, Miglioretti DL, LeResche L, Koepsell TD, Micheelis W:
Dimensions of Oral health-related Quality of life. J Dent Res 2004,
83:956-960.
9. Skaret E, Astrom AN, Haugejorden O: Oral Health-Related Quality of life.
Review of existing instruments and suggestions for use in oral health
outcome research in Europe. Proceedings of European Global Oral Health
Indicators Development Project Paris: Quintessence InternationalBourgeois
DM, Llodra JC 2004, 99-110.
10. Slade GD: Derivation and validation of a short-form oral health impact
profile. Community Dent Oral Epidemiol 1997, 25:284-290.
11. McGrath C, Bedi R: An evaluation of a new measure of oral health
related quality of life –OHQoL-UK(W). Community Dent Health 2001,
18:138-143.
12. Adulyanon S, Sheiham A: Oral impacts on daily performance. Measuring
oral health and quality of life Chapel Hill: University of North CarolinaSlade
GD 1997, 151-60.
13. Montero J, Bravo M, Albaladejo A: Validation of two complementary oral
health-related quality of life indicators (OIDP and OSS) among two
qualitatively distinct samples of the Spanish population. Health Qual Life
Outcomes 2008, 6:101.
14. Montero J, Bravo M, Albaladejo A, Hernández LA, Rosel EM: Validation the
Oral Health Impact Profile (OHIP-14sp) for adults in Spain. Med Oral Patol
Oral Cir Bucal 2009, 14:E44-50.
15. Astrøm AN, Mtaya M: Factorial structure and cross-cultural invariance of
the Oral Impacts on Daily Performances. Eur J Oral Sci 2009, 117:293-9.
16. Bernabé E, Sheiham A, Tsakos G: A comprehensive evaluation of the
validity of Child-OIDP: further evidence from Peru. Community Dent Oral
Epidemiol 2008, 36:317-325.
17. Mtaya M, Astrøm AN, Tsakos G: Applicability of an abbreviated version of
the Child-OIDP inventory among primary schoolchildren in Tanzania.
Health Qual Life Outcomes 2007, 13
:40.
18. Dawis RV: Scale construction. Methodological issues and strategies in clinical
research Washington, DC: American Psychological AssociationKazdin AE
1998, 193-213.
19. Carmines EG, McIver JP: Analyzing models with unobserved variables.
Social Measurement: Current Issues Beverly Hills: SageBohrnstedt GW,
Borgatta EF 1981, 53-86.
20. Hu L, Bentler PM: Cut-off criteria for fit indices in covariance structure
analysis: Conventional criteria versus new alternatives. Struct Equ
Modeling 1999, 6:1-55.
21. Browne MW, Cudeck R: Alternative ways of assessing model fit. Testing
structural equation models Beverly Hills CA: SageBollen KA, Long JS 1992,
75-108.
22. Schermelleh-Engel K, Moosbrugger H, Müller H: Evaluating the fit of
structural equation models: tests of significance and descriptive
Goodness-of-Fit measures. Methods Psychol Res Online 2003, 8:23-74.
23. Hoyle RH: Structural Equation Modeling SAGE Publications, Inc. Thousand
Oaks, CA 1995.
24. Arbuckle J: AMOS user’s guide 7.0 Spring House, PA: AMOS Development
Corporation 2006.
25. Brennan DS, Spencer AJ: Dimensions of oral health-related quality of life
measured by EQ-5D and OHIP-14. Health Qual Life Outcomes 2004,
13(2):35.
26. Patrick D, Erickson P: Health status and health policy - quality of life in health
care evaluation and resource allocation New York, NY: Oxford University
Press 1993.
27. John MT: Exploring dimensions of oral health-related quality of life using
experts’ opinions. Qual Life Res 2007, 16:697-704.
28. Bagewitz IC, Söderfeldt B, Nilner K, Palmqvist S: Dimensions of oral health-
related quality of life in an adult Swedish population. Acta Odontol Scand
2005, 63:353-60.
29. Lau AW, Wong MC, Lam KF, McGrath C: Confirmatory factor analysis on
the health domains of the Child Perceptions Questionnaire. Community
Dent Oral Epidemiol 2009, 37:163-70.
30. Brondani MA, MacEntee MI: The concept of validity in sociodental
indicators and oral health-related quality of life measure. Community
Dent Oral Epidemiol 2007, 35:472-8.
31. Locker D, Allen F: What do measures of “oral health-related quality of life
measure"?. Community Dent Oral Epidemiol 2007, 35:401-11.
doi:10.1186/1477-7525-8-24
Cite this article as: Montero et al.: Dimensional structure of the oral
health-related quality of life in healthy Spanish workers. Health and
Quality of Life Outcomes 2010 8:24.
Submit your next manuscript to BioMed Central
and take full advantage of:
• Convenient online submission
• Thorough peer review
• No space constraints or color figure charges
• Immediate publication on acceptance
• Inclusion in PubMed, CAS, Scopus and Google Scholar
• Research which is freely available for redistribution
Submit your manuscript at
www.biomedcentral.com/submit
Montero et al. Health and Quality of Life Outcomes 2010, 8:24
/>Page 9 of 9