báo cáo khoa học:" An instrument to assess quality of life in relation to nutrition: item generation, item reduction and initial validation" potx
Bạn đang xem bản rút gọn của tài liệu. Xem và tải ngay bản đầy đủ của tài liệu tại đây (418.91 KB, 13 trang )
RESEARC H Open Access
An instrument to assess quality of life in relation
to nutrition: item generation, item reduction and
initial validation
Holger J Schünemann
1*
, Francesca Sperati
2
, Maddalena Barba
2
, Nancy Santesso
3
, Camilla Melegari
4
, Elie A Akl
1
,
Gordon Guyatt
3
, Paola Muti
2
Abstract
Background: It is arguable that modification of diet, given its potential for positive health outcomes, should be
widely advocated and adopted. However, food intake, as a basic human need, and its modification may be
accompanied by sensations of both pleasure and despondency and may consequently affect to quality of life
(QoL). Thus, the feasibility and success of dietary changes will depend, at least partly, on whether potential
negative influences on QoL can be avoided. This is of particular importance in the context of dietary intervention
studies and in the development of new food products to improve health and well being. Instruments to measure
the impact of nutrition on quality of life in the general population, however, are few and far between. Therefore,
the aim of this project was to develop an instrument for measuring QoL related to nutrition in the general
population.
Methods and results: We recruited participants from the general population and followed standard methodology
for quality of life instrument development (identification of population, item selection, n = 24; item reduction, n =
81; item presentation, n = 12; pretesting of questionnaire and initial validation, n = 2576; construct validation n =
128; and test-retest reliabil ity n = 20). Of 187 initial items, 29 were selected for final presentation. Factor analysis
revealed an instrument with 5 domains. The instrument demonstrated good cross-sectional divergent and
convergent construct validity when correlated with scores of the 8 domains of the SF-36 (ranging from -0.078 to
0.562, 19 out of 40 tested correlations were statistically significant and 24 correlations were predicted correctly) and
good test-retest reliability (intra-class correlation coefficients from 0.71 for symptoms to 0.90).
Conclusions: We developed and validated an instrument with 29 items across 5 domains to assess quality of life
related to nutrition and other aspects of food intake. The instrument demonstrated good face and construct
validity as well as good reliability. Future work will focus on the evaluation of longitudinal construct validity and
responsiveness.
Background
The intake of food is a basic human need. This basic
need is accompanied by sensations of both pleasure (e.g.
related to taste, social interaction) and despondency (e.g.
related to indigestion, gastrointestinal disturbances,
weight gain). These sensations may affect quality of life
(QoL) and may be influenced by different composition
and nutrient content of food stuff.
Furthermore, certain nutrients and types of diets may
be associated with other patient important outcomes
such as longe vity, mortality and morbidity. For instance,
the Mediterranean diet and high fruit and vegetable
intake may lead to a range of positive health outcomes
(e.g. reduction in myocardial infarction, stroke and pul-
monary disease) [1]. One could therefore argue that
modification of diet, given its potential for positive
health outcomes, should be widely advocated and
adopted. However, the feasibility and success of dietary
changes will depend, at least partly, on whether poten-
tial negative influences on QoL can be avoided. It is
* Correspondence:
1
Department of Medicine, University at Buffalo, State University of New York,
Buffalo, New York, USA
Schünemann et al. Health and Quality of Life Outcomes 2010, 8:26
/>© 2010 Schünem ann et al; licensee BioMed Central Ltd. This is an Open Access article distribut ed under the terms of the Creative
Commons Attributio n License (http ://creativecommons. org/licenses/by/2.0), which permits unrestricted use, distribution, and
reproduction in any medium, provided the original work is properly cited.
therefore important to assess how food intake and diet-
ary c hanges relate to QoL. This is of particular impor-
tance in the context of dietary intervention studies and
for the develo pment of new food products to impr ove
health and well being. In addition, QoL related to nutri-
tion may potentially serve as a predictor of compliance
with specific dietary interventions. Social context of
nutrition, such as eating together, may impact on
domains such as satisfaction and happiness [2].
Instruments to measure the impact of nutrition on
qualityoflifeinthegeneralpopulation,however,are
few and far between [3]. For example, Hatton et al.
found that a prepared diet improved nutritional health
perceptions and affect and reduced hassles related to
nutrition in patients with cardiovascular disease [4]. The
authors used four tools that were modeled on disease
specific quality of life and well-being instruments. While
the instruments showed face validity and indicated that
the measured outcomes improved, details of item gen-
eration and item reduction for these instruments were
not described. Furthermore Hatton did not address
quality of life related to social aspects of life, such as
interaction with others during meals, in particular in
societies that place high emphasis on diet and food
intake.
Therefore, the aim of this project was to develop an
instrument for measuring QoL related to nutrition and
food intake in the general population.
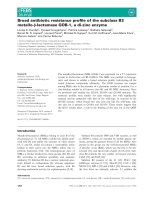
Methods
We followed standard methodology for quality of life
instrument development based on the following six
phases described in the framework by Guyatt and Kirsh-
ner [5]:
a. Identification of Population
b. Item Selection
c. Item Reduction
d. Item Presentation
e. Pretesting of Questionnaire
f. Validation of Questionnaire
We focused on discriminative properties in this study,
but aimed to develop an instrument that eventually will
be also useable for evaluative purposes. However, we did
not investigate evaluative properties in this study. The
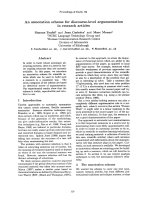
flow of the study is described in figure 1.
Search for existing instruments and identification of the
population
We began our work by searching the literature for
instruments measuring QoL related to food and food
instruments related to QoL that could inform our work.
We searched three databases (Medline, Healt h and Psy-
chosocial Instruments (HAPI), CAB Abstracts) up to
November 2007 and reviewed references from relevant
articles (see search strategies in appendix 1). Of the
2083 citations resulting from the electronic search, there
were two food related quality of life scales of particular
interest that we reviewed prior to beginning the work
on item generation [6,7]. Another citation described the
use of questionnaires related to the impact of prepared
diets on quality of life [4]. We also identified an abstract
describing a nutrition QOL survey [8]. While providing
potentially relevant items, these scales primarily focus
on quality of life related to dietary therapy. Other
instruments related to food provided potentially relevant
themes such as food involvement, preparation, purchase,
food diversity and social constraints related to food, but
they focused on special populations. However, our focus
was on the general popula tion that might be exposed to
general health messag es regarding food intake and diet
changes. Thus, we aimed to recruit a representative
sample of the general population applying the following
inclusion criteria: age greater than 18; no dietary restric-
tions (with the exception of vegetarian diet); able to
read and spea k Italian. We excluded participants with
psychiatric, emotional or cognitive problems that could
prevent reliable complet ion of the questionnaire; a diag-
nosis of a disease t hat is likely to influence completion
of the questionnaire or selection of items; a major illness
that substantially influences the patient’s quality of life;
distance of residence from recruitment centre of greater
than 1 hour drive.
Item generation and selection
This phase consisted of extraction of items from the
reviewed literature, feedback from nutrition experts and
semi-structured personal interviews (figure 1). Three
investigators interviewed participants using a semi-
structured questionnaire allocating up to 90 mi nutes to
each interview . We recru ited 24 participants in Novem-
ber and December 2007 through a consumer research
agency in Rome, Italy. This consumer research agency
holds a database of approximately 7000 individuals
recruited since 1995 through public relation and publi-
cally available databases. Potential candidates were
selected at random and invited by telephone or email to
participate. Exclusion criteria for this phase of the study
were work activity in the following professions: public
relation, journalism, market research, marketing, food
production or sales, psychology or sociology. Partici-
pants should not have participated in other interviews
for at least 3 months prior to recruitment in this study.
Participants received reimbursement for their travel
expenses and provided informed consent. Table 1
shows the demographic characteristics of these
participants.
The item generation phase generated 187 items that
were partially overlapping.
Schünemann et al. Health and Quality of Life Outcomes 2010, 8:26
/>Page 2 of 13
Item reduction and pretesting
We grouped the collected items into similar themes
before recruiting 81 participants in four Italian cities
(Rome, Naples, Parma and Milan) for item reduction and
initial item presentation using the same agency as for the
item generation phase in addition to participants who
worked in food production and sales (figure 1). Ta ble 2
shows the demographic characteristics of these partici-
pants. Participants used 7 point Like rt-type scales to rate
the relative importance (not important (1) to extremely
important (7)), agreement with (complete disagreement
(1) to complete agreement (7)), or frequency of occur-
rence (never (1) to always (7)) for ea ch of the selected
items. We also began testing comprehension of draft
items in the final third of the 81 participants by obtaining
feedback about readability and clarity of question.
We the n conducted descriptive analysis, factor analy-
sis, bivariate correlations and item-item co rrelations.
After eliminating items of low importance, low agree-
ment between participants about the importance or
infrequent occurrence, we grouped the remaining 105
Figure 1 Flow chart of phases in the study and recruited participants.
Table 1 Demographic characteristics: item generation
and selection phase (n = 24)
mean SD Lowest - Highest
Age 30.5 7.53 19 - 44
Weight 70.7 16.1 46 - 112
Height 172.5 9.3 158 - 190
N%
24
Gender
M 12 50.0
F 12 50.0
Level of education
Middle school 14 58.3
High school 8 33.3
Masters’ level education 1 4.2
No Information 1 4.2
Marital status
Married 9 37.5
Separated or divorced 1 4.2
Not married 14 58.3
Schünemann et al. Health and Quality of Life Outcomes 2010, 8:26
/>Page 3 of 13
items in five domains (n = number of items per
domain):
1) Sensations (n = 11)
2) Symptoms (n = 12)
3) Healthy lifestyle (n = 47)
4) Family function (n = 19)
5) Social and role function (n = 16)
An additional 12 items related to taste did not load on
any of the domains. We then reduced the number of
items in each domai n by removing items with high
inter-item correlations (r > 0.5) or items that covered
similar aspects (e.g. separate items indicating that
healthy food should prevent cancer, cardiovascular dis-
ease, hypertension and diabetes were grouped into pre-
venting disease). We made the latter ju dgments through
discussion and consensus of three investigators. The
final list of items prior to item presentation included 31
items, two of which we considered possibly difficult to
understand.
Item presentation
We presented the 31 items resulting from item reduc-
tion to an additional 12 volunteers. All it ems required
answers on a 7 point Likert-type scale and inquired
about the past two weeks. As anticipated, participants
did not easily understand two items and we dropped
those items before pretesting and validation of the ques-
tionnaire. Participants showed ease of understanding
and there were no obvious ceiling or floor effects for
the remaining 29 items (the questionnaire, named Qual-
cibo, is shown in appendix 2). The instrument required
less than approximately 12 minutes for completion.
Validation of the questionnaire
We performed a number of validation exercises (figure
1). First, we recruited a sample of 2576 participants
from the general population during introduction of a
new food product in temporary shops in the cities of
Milan and Rome. Potential participants entering the
shops w ere approached by employees of the temporary
shop to participate in the study. They were asked to sit
down and complete a questionnaire, but we did not
select information on participants who declined to parti-
cipate. Participants were informed of the purpose of the
study and completed the questionnaire on a computer
touch screen.
Second, w e recruited a sample of 128 participants on
the internet through advertisement who completed the
questionnaire online together with the Short Form 36
(SF-36) [9]. This recruitment was done in the context of
an advertising campaign for the same new food product
that was offered in the tempora ry shops. Adverti sement
was sent by email thro ugh a marketing agency that was
responsible for marketing the new food product.
Third, 20 volunteers participated in a reliability study
(figure 1). These participants were recruited as part of a
study investigating biochemical markers of nutrient
intake. They completed the questionnaire twice,
approximately four weeks apart in the context of a clinic
visit. No lifestyle changes were suggested to these
individuals.
Table 2 Demographic characteristics: item reduction and
presentation phase (n = 81)
mean SD
Age 47.7 15.8
Weight 70.7 14.1
Height 167.4 13.7
N%
Gender
M 38 46.9
F 43 53.1
Level of education
Middle school 21 26.2
High school 47 58.8
University degree 12 15.0
Marital status
Married 53 65.4
Separated or divorced 4 4.9
Widow 5 6.2
Never married 19 23.5
Type of employment
Stable work 41 50.7
Term worker 4 4.9
Unemployed 2 2.5
Retired 10 12.3
Homemaker 13 16.0
Student 11 13.6
Smoker
Never smoker 34 42.0
Current moker 24 29.6
Former smoker 23 28.4
Diabetes mellitus type 2
No 78 96.3
Yes 3 3.7
Cardiovascular disease
No 76 93.8
Yes 5 6.2
Hypertension
No 65 81.2
Yes 15 18.8
History of Cancer
No 77 95.1
Yes 4 4.9
Following a special diet
No 68 84.0
Yes 13 16.0
Schünemann et al. Health and Quality of Life Outcomes 2010, 8:26
/>Page 4 of 13
Statistical analysis for validation and reliability study
We calculated Pearson correlation coefficients between
the items selected for presentation of the initial valida-
tion set of 2576 participants. We based the allocation of
the items of Qualcibo into do mains on factor analysis
(principal component analysis with varimax rotation)
and face validity as judged by the investigators [10]. To
investigate the internal consistency of Qualcibo
domains , we calculated Cron bach alpha valu es [10]. We
evaluated convergent and discriminant cross sectional
construct validity by calculating Pearson’s correlation
coefficients between Qualcibo domains and the SF-36
domains in 128 participants. We consider ed correlations
of less than 0.2 as very weak, from 0.2 to 0.35 as weak,
from greater than 0.35 to 0.5 as moderate, and of more
than 0.5 as strong. For interpretation of the data, we
used blinded a priori ratings about the strength of the
correlation between the 8 domains on the SF36 and the
Qualcibo from four of the authors with significant
experience in quality of life research. Finally, we evalu-
ated the test-retest reliability of Qualcibo using repeated
measurements in the sample of 20 individuals who com-
pleted the instrument twice. We calculated mean scores
at the two administrations and compared these scores
for all 29 questions using a paired t-test and calculated
Pearson’ s correlation coefficient. We then calculated
intra-class correlation coefficients by domain where the
between-rater variance estimates at the two times of
administration were in the numerator and the between-
rater variance in addition to the within-rater variance of
the two ratings in the denominator [11,12]. We used
SPSS for Windows 14.0 and 17.0 for the statistical ana-
lyses (SPSS, Inc, Chicago, Ill).
Ethics
The item generation and item reduction phase was
approved by the ethics board of the Italian National
Cancer Institute “ Regina Elena” in Rome, Italy.
Recruited participants signed an informed consent. For
the latter part of the study, the requirement for
informed consents was waived by the instit utional
review board and the reliability data were provided by
one of the investigators (CM) as part of an ongoing
study that had received ethics approval by the University
of Parma.
Results
Development
Descriptive characteristics of the participants enrolled
for the item generation and selection phase (n = 24) are
shown in Table 1. 81 participants completed the
extended item questionnaire of 187 items and their
descriptive characteristics are shown in Table 2. We
reduced this set of items to 29 through statistical
analyses, discussion and item presentation in the item
reduction phase.
Pretesting and validation
Thirty-nine p ercent of the 2576 participants were men.
The mean age of the recruited participants was 42.2
years, with a mean weight of 66.2 kg and height of
169.7 cm.
Table 3 shows the results of the factor analysis for the
29 items. The items loaded on five factors that were
related to the initial clusters we identified: healthy life-
style (n = 10 items), symptoms (n = 6), sensations (n =
6), social and role function (n = 4), taste (n = 3). Table
4 shows the internal consistency reliability for the entire
set of questions and the single domains. Table 5 shows
the mean scores for the five domains and table 6 the
correlations among domains. The mean sc ores were
above 4 (the mean of the score range) but the standard
deviation was approximately 1.0 for all domains. We
found that two items (becomingupsetinrelationto
food intake and a feeling of happiness after a rich break-
fast) were not loading uniquely on only one factor.
Furthermore, one of these items (becoming upset in
relation to food intake) showed a flat distribution indi-
cating that this item may have been misunderstood by
participants.
Cross-sectional construct validity
The 128 participants (35.9% male) who participated in
the internet survey and completed both the Qualc ibo
and the SF-36 had a mean age of 35.3 (SD 10.2) years,
mean weight of 63.9 (SD 13.2) kg, and were 169.7 (SD
8.9, data missing on 14 individuals) cm tall. The correla-
tions between the domains on the Qualcibo an d the SF-
36 ranged from -0.0 78 to 0.562 (table 7). Of the 40
tested correlations, 19 were statistically significant (p <
0.01 for 12 correlations and p < 0.05 for 7 correlations).
The correlations in the Qualcibo symptoms domain
with all of the SF36 domains were hig her (primarily in
the moderate to strong category) than the other Qual-
cibo domains. Most of the correlations were weak to
very weak. However, except for the correlations with the
symptoms domain for which we expected slightly lower
correlations, the direction and magnitude of the associa-
tions were generally in line with the predictions by the
authors with expertise in quality of life research. In fact,
24 correlations were predicted correctly, 15 w ere either
higher or lower by one category and one lower by two
categories (predicted as moderate correlation but
resulted as very weak).
Reliability
The 20 participants who completed the Qualcibo twice
had a mean age of 65.7 (SD 4.4) years, weighted 76.6
Schünemann et al. Health and Quality of Life Outcomes 2010, 8:26
/>Page 5 of 13
(SD 8.0) kg and were 166 (SD 7.8) cm tall. Despite per-
forming 29 tests, there were no significant difference s in
the mean scores for any of the 29 questions between the
two administrations. The correlation coeffi cients
between the two administrations ranged from 0.03 to
0.82 and 16 correlations were above 0.5. The lowest cor-
relation coefficient was largely driven by one respondent
who reported a 7 on the first admi nistratio n and a 1 on
the second administration (item 15). The correlation
coefficients by domain ranged from 0.55 to 0.84 (p <
0.05 for all domains). The intra-class c orrelation coeffi-
cients by domain were 0.84 for healthy lifestyle, 0.71 for
symptoms, 0.90 sensations, 0.77 for social and role func-
tion, 0.73 for taste.
Discussion
Applying standard methodology following an established
framework, we created an instrument that evaluates
quality of life related to nutrition [5]. The 29 items of
the Qualcibo are simple to complete, show good face
Table 3 Factor analysis of 29 items
Factor
Item Nr. (Factor loading) and item name 1 2 3 4 5
1. (2) avvertito pesantezza .142 .788 .119 .016 104
2. (2) avvertito acidità/bruciore stomaco .077 .653 .089 .004 .132
3. (1) evitato cibi pesanti/grassi/fritti .729 .101 068 048 075
4. (2) avvertito sonnolenza .259 .515 .011 .029 3.49E-005
5. (3) avvertito soddisfazione/sollievo morale .005 .071 .724 .085 .074
6. (1) evitato grandi quantità di cibo .663 .209 183 .040 020
7. (3) avvertito momento tranquillità .131 .184 .649 .033 .082
8. (4) mangiato piatto nuovo .032 043 .370 .410 159
9. (2) disturbi intestinali .033 .697 .067 .014 .172
10. (1) controllato etichette/tipologia del cibo mangiato .587 034 .228 040 .008
11. (4) occasione per riunirsi .005 .025 .087 .844 .046
12. (1) fatto la spesa/partecipato alla preparazione del (pasto/rispettato stagionalità degli alimenti .421 032 .177 .030 .259
13. (5) mangiato cibo con gusto che non piace .143 .147 022 040 .597
14. (1) evitato di andare a dormire dopo mangiato/fatto una ((passeggiata .345 .141 .014 .123 .111
15. (2) avvertito gonfiore .109 .778 .153 .002 061
16. (1) seguito alimentazione che comprende tutti i gruppi ()alimentari .720 .168 .112 .063 .062
17. (1) mangiato cibo sano .597 .210 .171 .058 .236
18. (5) mangiato cibo con buon sapore .104 .185 .266 .197 .631
19. (3) avvertito benessere personale/piacere .070 .191 .711 .171 .289
20. (3) avvertito sensazione di recupero forze .160 .160 .589 .098 006
21. (4) accordo sui gusti alimentari/cena ben cucinata ha migliorato la relazione con partner/famiglia .157 .056 .360 .454 .127
22. (3) contento dopo abbondate colazione .240 047 .318 .047 .126
23. (1) mangiato cibi che prevengono malattie .581 .039 .288 .020 .007
24. (5) avvertito sazietà 051 159 .197 .054 .574
25. (1) controllato l’assunzione di cibi che fanno ingrassare .729 .032 .037 029 010
26. (1) consumato prodotti di qualità .690 .104 .187 .061 .042
27. (3) sentito odore di una petanza .130 006 .491 .262 .340
28. (4) momento per stare in compagnia/parlare .007 .053 .115 .827 .170
29. (2) avvertito cattivo umore in relazione a un pasto .047 .478 .075 .110 .452
Table 4 Internal consistency reliability
Cronbach alpha
Entire set of questions (n = 29) 0.86
Healthy lifestyle domain 0.83
Symptoms domain 0.77
Sensations domain 0.73
Social and role function domain 0.65
Taste domain 0.43
Table 5 Domain scores (n = 2576) of the five Qualcibo
domains
Minimum Maximum Mean Std.
Deviation
Healthy lifestyle 1 7 4.5 1.04
Symptoms 1 7 5.0 0.99
Sensations 1 7 4.5 0.95
Social and role
function
1 7 4.2 0.96
Taste 1 7 5.3 0.92
Schünemann et al. Health and Quality of Life Outcomes 2010, 8:26
/>Page 6 of 13
validity, and internal consistency reliability. Evaluation of
construct validity generally indicated correlations with
the SF-36 of expected magnit ude and direction. Reliabil-
ity of the instrument is also adequate. Our literature
search indicated that validated instruments for the gen-
eral population in this area are absent. We identified
one a bstract that described the development of a nutri-
tion quality of life screening too l [8]. We therefore
believe that this instrument may find application in
nutrition surveys and clinical studies.
Strength
Webelieveourstudyhasseveralstrengths.Westarted
our work with a thorough review of the literature on
existing items and generated a large list of candidate
items. The extensive subsequent phases following stan-
dard methodology and using large sample sizes are
another strength of this study.
Limitations
This study has some l imitations. First, the generalizabil-
ity of the results need to be evaluated in an international
context because this study was performed in only one
Mediterranean country in only one language. Second,
two items showed loading on more than one factor. For
example, the item dealing with satisfaction and agree-
ment on food taste (it em 21) loaded on both the sensa-
tions and the social and role function domain. One
possibility for this and similar instances is that the item
actually does relate to more than one domain. Alterna-
tively, despite the detailed efforts to ensure optimal
phrasing of the item the intended question may not
have been specific enough. This could result in differi ng
understanding of the item across respondents. Third,
the recruitment strategy might have favoured partici-
pants with an interest in nutrition. We believe that this
could have led to higher than average scores on some of
the domains. Finally, we only performed cross-sec tional
validation, but did not address longitudinal construct
validity and responsiveness.
Instrument properties
The instrument has 29 items with 5 domains: healthy
lifestyle (n = 10 items), symptoms (n = 6 items), sensa-
tions (n = 6 items), social and role function (n = 4
items), and taste (n = 3 items). Mean scores were
Table 6 Domain-domain correlations (n = 2576)
Healthy Lifestyle Symptoms Sensations Social and role function
Healthy Lifestyle
Symptoms 0.324(**)
Sensations 0.358(**) 0.298(**)
Social and role function 0.178(**) 0.141(**) 0.456(**)
Taste 0.214(**) 0.225(**) 0.372(**) 0.232(**)
** all p values < 0.001
Table 7 Cross-sectional Construct Validity (n = 128)
Healthy lifestyle Symptoms Sensations Social and Role function Taste
SF-36 Physical Function .158 .366** .123 .114 .235**
.075 .000 .168 .199 .008
SF-36-Role Function .053 .368** .160 .025 .150
.556 .000 .071 .777 .091
SF-36 Bodily Pain 022 .121 078 023 .108
.803 .174 .384 .795 .226
SF-36 General Health .124 .451** .258** .212* .201*
.162 .000 .003 .016 .023
SF-36 Vitality .222* .562** .394** .127 .269**
.012 .000 .000 .154 .002
SF-36 Social Functioning 023 .504** .171 .130 .199*
.796 .000 .053 .144 .025
SF-36 Role-Emotional .046 .458** .138 .100 .195*
.607 .000 .120 .260 .028
SF-36 Mental Health .094 .538** .361** .209* .192*
.293 .000 .000 .018 .030
*p < 0.05; ** p < 0.01
Schünemann et al. Health and Quality of Life Outcomes 2010, 8:26
/>Page 7 of 13
above 4 in the large validation set of 2576 participants
who likely possessed above average interest in nutri-
tion. Further work in other large representative popu-
lations is required to establish the mean score in the
general population. However, we believe that the score
distribution indicates that both deterioration and
improvement will be detectable in most populations.
Correlations with the SF-36 domains were very weak
to strong. Although most of the correlations were
weak, we expected these low correlations bec ause our
instrument focuses on domains that are only partially
related to those of t he SF-36 and more specific for
food intake. Given that we made a priori predictions
about the strength of the associations, the observed
correlations indicated good construct validity. Finally,
both internal consistency reliability and test-retest
reliability indicate that this instrument has good psy-
chometric properties.
Context
In the context of recommendations about diet and clini-
cal interventions to alter risk factors, the need for
instruments to assess the impact of nutrition related
lifestyle changes exists [3]. This instrument is one of the
first to tackle the gap of vali dated tools to assess the
relation between nutrition and quality of li fe. We found
that sensations, symptoms healthy lifestyle, family func-
tion, social and role function are important in the con-
text of nutrition. The impact on those domains should
be considered in the prescription of dietary interven-
tions to p atients in both the clinical and t he research
settings. I t will be important to explore whether poten-
tial small benefits i n morbidity outcomes as a result of
dietary interventions studies outweigh potential negative
outcomes on quality of life and vice versa. Our instru-
ment should allow this a ssessment. The instrument
might also be able to predict the compliance of subjects
with specific dietary interventions based on reported
change in QoL with the introduction of those diets. The
instrument will require additional work to ensure proper
translation and cultural adaptation.
Conclusions
We developed and validated an instrument to assess
quality of l ife related to nutriti on and ot her aspects of
food intake. The instrument demonstrates promising
validity and will be a suitable questionnaire for popula-
tionbasedresearchondietchangesandtheimpactof
nutrition on Qol. It can be used to determine whether
dietary interventions negative ly or positively influence
individuals’ perception of QoL related to nutrition.
Further work will focus on the instrume nts longit udinal
construct validity and responsiveness.
Appendix 1
Search Strategies and Results
Health and Psychosocial Instruments 1985 to November
2007
1. (food$ or nutri$ or eat$ or feed$ or meal$ or diet$).
m_titl.
2. (life or behavio$ or habit$ or practice$ or activit$ or
attitud$ or belie$ or emotion$ or psych$).mp. [mp =
title, acronym, descriptors, abstract]
3. (content$ or happ$ or satisf$ or quality or enjoy$ or
pleas$).mp. [mp = title, acronym, descriptors, abstract]
4. 1 and (2 or 3)
1305 citations
Medline 1950 - November 2007
1. exp food/
2. exp nutrition therapy/
3. exp diet/
4. exp feeding behavior/
5. or/1-4
6. quality of life.tw.
7. quality of life/
8. ((content or contented$ or happy or happiness or
happily or satisfy or satisfied or satisfaction or enjoy$ or
pleas$) and life).tw.
9. or/6-8
10. psychometrics/
11. questionnaires/
12. (scale$ or questionnaire$).tw.
13. “Outcome Assessment (Health Care)"/
14. or/10-13
15. 5 and 9 and 14
683 citations
CAB Abstracts (1973 - November 2007)
1. ( ((DE “food” OR DE “food products” OR DE “foods”
or DE “ food beliefs” or DE “food intake” or DE “ food
intolerance (AGRICOLA)” or DE “food preferences” or
DE “food preparation” or DE “food purchasing (AGRI-
COLA)” or D E “food quality” or DE “food re search ” or
DE “food sciences” or DE “foods” OR DE “beverages”
OR DE “ carbohydrate-rich foods” OR DE “chewing
gum” OR DE “ confectio nery” OR DE “ conv enience
foods” OR DE “desserts” OR DE “dietetic foods” OR DE
“ethnic foods (AG RICOLA)” OR DE “fast foods” OR DE
“food pastes” OR DE “food supplements
” OR DE “fried
foods ( AGRICOLA)” OR DE “functional foods” OR DE
“garnishes (AGRICOLA)” OR DE “health foods ” OR DE
“infant foods” OR DE “ko sher food (AGRICOLA)” OR
DE “low acid foods (AGRICOLA)” OR D E “low calorie
foods (AGRICOLA)” OR DE “low fat products” OR DE
“ natural foods (AGRICOLA)” OR DE “ novel foods
(AGRICOLA)” OR DE “organic foods” OR DE “pickled
foods (AGRICOLA)” OR DE “precooked foods (AGRI-
COLA)” OR DE “protein foods” OR DE “ salad dressin gs
Schünemann et al. Health and Quality of Life Outcomes 2010, 8:26
/>Page 8 of 13
(AGRICOLA)” OR DE “ salads (AGRICOLA)” OR DE
sauces” OR DE “simulated foods” OR DE “soups” OR DE
“spre ads” OR DE “ tropical foods (AGRICOLA)” OR DE
“ unconventional foods” OR DE “ wild foods” )and(DE
“nutrition” or DE “nutriti on knowledge” or DE “nutriti on
planning (AGRICOLA)” or DE “nutrition research” or
DE “nutritional adequacy (AGRICOLA)” or DE “nutri-
tional state”)) or (DE nutrient intake (AGRICOLA)” ))
and (DE “diet” or DE “diet planning” or DE “dietetics”)
2. ((DE “surveys” or DE “censuses” or DE “disease sur-
veys” or DE “epidemiological surveys” or DE “household
surveys” or DE “ nutrition surveys
” or DE “regional sur-
veys (AGRICOLA)” or DE “ data collection” or DE
“research” or DE “sampling” or DE “sur veillance” or DE
“ surveying” )or(DE“ measurement” )) or (DE “dietary
surveys”)
3. AB tool OR instrument OR scale
4. 1 AND (2 OR 3)
95 citations
Appendix 2
Questo questionario è concepito allo scopo di verificare
come si è sentito/a nelle ultime 4 settimane. Per favore
risponda a tutte le domande scegliendo una delle opzioni
ed inserisca una X nella casella corrispondente alla ris-
postadaLeiindividuata.Nonesistonorispostegiusteo
sbagliate. Nel caso i n cui Lei fosse insicura/o riguardo a
come rispondere ad una domanda, dia cortesemente la
migliore risposta possibile. Le Su e risposte al presente
questionario saranno trattate in modo confidenziale.
1. Indichi per favore quante volte nelle ultime 4 setti-
mane in relazione all’assunzione di cibo Le è capitato di
avvertire una sensazione di pesantezza.
|1| Sempre
|2| Quasi sempre
|3| Tante volte
|4| Qualche volta
|5| Poche volte
|6| Quasi mai
|7| Mai
2. Indichi per favore quante volte nelle ultime 4 setti-
mane in relazione all’assunzione di cibo ha avvertito
acidità o bruciore di stomaco.
|1| Sempre
|2| Quasi sempre
|3| Tante volte
|4| Qualche volta
|5| Poche volte
|6| Quasi mai
|7| Mai
3. Indichi per favore quanto spesso nelle ultime 4 set-
timane ha evitato cibi pesanti o cibi grassi e fritti.
|1| Non ho mai evita to cibi pesanti o cibi grassi e
fritti
|2| Non ho quasi mai evitato cibi pesanti o cibi
grassi e fritti
|3| Poche volte ho evita to cibi pesanti o cibi grassi e
fritti
|4| Qualche volta ho evitato cibi pesanti o cibi grassi
e fritti
|5| Tante volte ho evitato cibi pesanti o cibi grassi e
fritti
|6| Ho quasi sempre evitato cibi pesanti o cibi grassi
e fritti
|7| Ho sempre evitato cibi pesanti o cibi grassi e
fritti
4. Indichi per favore quanto spesso nelle ultime 4 set-
timane in relazione all’assunzione di cibo Le è capitato
di avvertire sonnolenza.
|1| Sempre
|2| Quasi sempre
|3| Tante volte
|4| Qualche volta
|5| Poche volte
|6| Quasi mai
|7| Mai
5. Indichi per favore quante volte nelle ultime 4 setti-
mane in relazione all’assunzione di cibo Le è capitato di
avvertire una sensazione di soddisfazione o sollievo mor-
ale.
|1| Mai
|2| Quasi mai
|3| Poche volte
|4| Qualche volta
|5| Tante volte
|6| Quasi sempre
|7| Sempre
6. Indichi per favore quante volte nelle ultime 4 setti-
mane ha evitato grandi di consumare quantità di cibo.
|1| Non ho mai evitato grandi quantità di cibo
|2| Non ho quasi mai evitato grandi quantità di cibo
|3| Poche volte ho evitato grandi quantità di cibo
|4| Qualche volta ho evitato grandi quantità di cibo
|5| Tante volte ho evitato grandi quantità di cibo
|6| Ho quasi sempre evitato grandi quantità di cibo
|7| Ho sempre evitato grandi quantità di cibo
Schünemann et al. Health and Quality of Life Outcomes 2010, 8:26
/>Page 9 of 13
7. Indichi per favore quante volte nelle ultime 4 setti-
mane in relazione all’assunzione di cibo Le è capitato di
avvertire un momento di tranquillità.
|1| Mai
|2| Quasi mai
|3| Poche volte
|4| Qualche volta
|5| Tante volte
|6| Quasi sempre
|7| Sempre
8. Indichi per favore quanto spesso nelle ultime 4 set-
timane ha mangiato un piatto nuovo.
|1| Mai
|2| Quasi mai
|3| Poche volte
|4| Qualche volta
|5| Tante volte
|6| Quasi sempre
|7| Sempre
9. Indichi per favore quanto spesso nelle ultime 4 set-
timane ha consumato cibi che hanno creato disturbi
intestinali.
|1| Sempre
|2| Quasi sempre
|3| Tante volte
|4| Qualche volta
|5| Poche volte
|6| Quasi mai
|7| Mai
10. Indichi per favore quanto spesso nelle ultime 4
settimane ha controllato le etichette dei cibi o co ntrol-
lato la tipologia del cibo che ha mangiato.
|1| Mai
|2| Quasi mai
|3| Poche volte
|4| Qualche volta
|5| Tante volte
|6| Quasi sempre
|7| Sempre
11. Indichi per favore quante volte nelle ultime 4 setti-
mane l’assunzione di cibo è stata per Lei un occasione
per riunirsi.
|1| Mai
|2| Quasi mai
|3| Poche volte
|4| Qualche volta
|5| Tante volte
|6| Quasi sempre
|7| Sempre
12. Indichi per favore quante volte nelle ultime 4 setti-
mane ha fatto personalmente la spesa, preparato o par-
tecipato alla preparazione di un pasto caldo per la sua
famiglia o rispettato la stagionalità degli alimenti nel
preparare un pasto.
|1| Mai
|2| Quasi mai
|3| Poche volte
|4| Qualche volta
|5| Tante volte
|6| Quasi sempre
|7| Sempre
13. Indichi per favore quanto spesso nelle ultime 4
settimane ha mangiat o un cibo con un gusto che non
Le piace.
|1| Non ho mai mangiato cibo di mio gusto
|2| Non ho quasi mai mangiato cibo di mio gusto
|3| Poche volte ho mangiato cibo di mio gusto
|4| Qualche volta ho mangiato cibo di mio gusto
|5| Tante volte ho mangiato cibo di mio gusto
|6| Ho quasi sempre mangiato cibo di mio gusto
|7| Ho sempre mangiato cibo di mio gusto
14. Indichi per favore quanto spesso nelle ultime 4
settimane ha evitato di andare subito a dormire dopo
aver mangiato o ha fatto una passeggiata dopo aver
mangiato troppo.
|1| Mai
|2| Quasi mai
|3| Poche volte
|4| Qualche volta
|5| Tante volte
|6| Quasi sempre
|7| Sempre
15. Indichi per favore quante volte nelle ultime 4 setti-
mane in relazione all’assunzione di cibo Le è capitato di
avvertire una sensazione di gonfiore.
|1| Sempre
|2| Quasi sempre
|3| Tante volte
|4| Qualche volta
|5| Poche volte
|6| Quasi mai
Schünemann et al. Health and Quality of Life Outcomes 2010, 8:26
/>Page 10 of 13
|7| Mai
16. Indichi per favore quanto spesso nelle ultime 4
settimane ha mangiato leggero o seguito un’alimenta-
zione che comprenda tutti i gruppi alimentari.
|1| Mai
|2| Quasi mai
|3| Poche volte
|4| Qualche volta
|5| Tante volte
|6| Quasi sempre
|7| Sempre
17. Indichi, per favore, quante volte nelle ultime 4 set-
timane nella sua opinione ha consumato cibo sano.
|1| Mai
|2| Quasi mai
|3| Poche volte
|4| Qualche volta
|5| Tante volte
|6| Quasi sempre
|7| Sempre
18. Indichi, per favore, quante volte nelle ultime 4 set-
timane ha consumato cibo c on un buon sapore. Scelga
una delle seguenti opzioni:
|1| Mai
|2| Quasi mai
|3| Poche volte
|4| Qualche volta
|5| Tante volte
|6| Quasi sempre
|7| Sempre
19. Quante v olte nelle ultime 4 settimane in relazione
all’assunzione di cibo Le è capitato di avv ertire una sen-
sazione di benessere personale o di piacere?
|1| Mai
|2| Quasi mai
|3| Poche volte
|4| Qualche volta
|5| Tante volte
|6| Quasi sempre
|7| Sempre
20. Indichi per favore quante volte nelle ultime 4 setti-
mane in relazione all’assunzione di cibo Lei ha avvertito
nella giornata una sensazione di recupero delle forze?
|1| Mai
|2| Quasi mai
|3| Poche volte
|4| Qualche volta
|5| Tante volte
|6| Quasi sempre
|7| Sempre
21. Indichi, per favore, quanto spesso nelle ultime 4
settimane l’accordo sui gusti alimentari o una cena ben
cucinata ha migliorato la relazione con il partner o la
famiglia.
|1| Mai
|2| Quasi mai
|3| Poche volte
|4| Qualche volta
|5| Tante volte
|6| Quasi sempre
|7| Sempre
22. Indichi, per favore, quanto spesso nelle ultime 4
settimane si è sentito contento/a di aver fatto un’
abbondante colazione.
|1| Mai
|2| Quasi mai
|3| Poche volte
|4| Qualche volta
|5| Tante volte
|6| Quasi sempre
|7| Sempre
23. Indichi per favore quanto spesso nelle ultime 4
settimane nella sua opinione ha consumato cibi che pre-
vengono malattie.
|1| Mai
|2| Quasi mai
|3| Poche volte
|4| Qualche volta
|5| Tante volte
|6| Quasi sempre
|7| Sempre
24. Indichi per favore quante volte nelle ultime 4 setti-
mane in relazione all’assunzione di cibo Le è capitato di
avvertire una sensazione di sazietà.
|1| Mai
|2| Quasi mai
|3| Poche volte
|4| Qualche volta
|5| Tante volte
|6| Quasi sempre
Schünemann et al. Health and Quality of Life Outcomes 2010, 8:26
/>Page 11 of 13
|7| Sempre
25. Indichi, per favore, quanto volte nelle ultime 4 set-
timane ha potuto controllare l’assunzione di cibi che
fanno ingrassare.
|1| Mai
|2| Quasi mai
|3| Poche volte
|4| Qualche volta
|5| Tante volte
|6| Quasi sempre
|7| Sempre
26. Indichi, per favore, quanto spesso nelle ultime 4
settimane ha consumato prodotti di qualità che La man-
tengono in forma.
|1| Mai
|2| Quasi mai
|3| Poche volte
|4| Qualche volta
|5| Tante volte
|6| Quasi sempre
|7| Sempre
27. Indichi per favore quanto spesso nelle ultime 4
settimane Lei ha avvertito piacere quando ha sentito o
annusato l’odore di una pietanza.
|1| Mai
|2| Quasi mai
|3| Poche volte
|4| Qualche volta
|5| Tante volte
|6| Quasi sempre
|7| Sempre
28. Indichi per favore quante volte nelle ultime 4 setti-
mane l’assunzione di cibo è stata per Lei un momento
per stare in compagnia o parlare.
|1| Mai
|2| Quasi mai
|3| Poche volte
|4| Qualche volta
|5| Tante volte
|6| Quasi sempre
|7| Sempre
29. Indichi, per favore, quanto spesso nelle ultime 4
settimane Le è capitat o di avvertire un cattivo umore in
relazione a un pasto.
|1| Sempre
|2| Quasi sempre
|3| Tante volte
|4| Qualche volta
|5| Poche volte
|6| Quasi mai
|7| Mai
Acknowledgements
The use of the instrument requires a user/license agreement. We appreciate
the assistance of Mrs Peggy Austin. This study was funded by a research
grant and research contract from Barilla, srl, Parma, Italy. Dr Melegari is an
employee of Barilla, srl. The sponsor had no input into the study design
(although Dr Melegari reviewed the study protocol) and data interpretati on
(except for Dr Melegari who commented on early results as a scientist
involved in the study). The authors are indebted to Drs Laura Franzini and
Diego Ardigò from the Department of Internal Medicine and Biomedical
Sciences, University of Parma, for collecting reliability data.
Author details
1
Department of Medicine, University at Buffalo, State University of New York,
Buffalo, New York, USA.
2
Department of Epidemiology, Italian National
Cancer Institute Regina Elena, Rome, Italy.
3
Department of Clinical
Epidemiology and Biostatistics, McMaster University, Hamilton, Ontario,
Canada.
4
Barilla, SpA, Parma, Italy.
Authors’ contributions
HS had the original idea of developing this quality of life instrument,
conceived the study, contributed to collecting all but the reliability data and
analyzed data and wrote the first draft of this article. FS contributed to
collecting all but the reliability data and analyzed data and reviewed the
final draft of the article. MB contributed to collecting all but the reliability
data and reviewed the final draft of the article. NS performed the literature
search and reviewed the final draft of the article. CM approved the study
protocol, supplied the data for the reliability study and reviewed the final
draft of the article. EAA, GG, PM reviewed the study protocol, interpreted
data and reviewed the final draft of the article. All authors read and
approved the final draft of the manuscript.
Competing interests
The authors declare that they have no competing interests.
Received: 29 July 2009 Accepted: 11 March 2010
Published: 11 March 2010
References
1. He FJ, Nowson CA, MacGregor GA: Fruit and vegetable consumption and
stroke: meta-analysis of cohort studies. Lancet 2006, 367(9507):320-326.
2. Wright L, Hickson M, Frost G: Eating together is important: using a dining
room in an acute elderly medical ward increases energy intake. Journal
of Human Nutrition & Dietetics 2006, 19(1):23-26.
3. Barr JT, Schumacher GE: The need for a nutrition-related quality-of-life
measure. J Am Diet Assoc 2003, 103(2):177-180.
4. Hatton DC, Haynes RB, Oparil S, Kris-Etherton P, Pi-Sunyer FX, Resnick LM,
Stern JS, Clark S, McMahon M, Morris C, et al: Improved quality of life in
patients with generalized cardiovascular metabolic disease on a
prepared diet. American Journal of Clinical Nutrition 1996, 64(6):935-943.
5. Kirshner B, Guyatt G: A methodological framework for assessing health
indices. J Chronic Dis 1985, 38(1):27-36.
6. Barr J, Schumacher G: Using focus groups to determine what constitutes
quality of life in clients receiving medical nutrition therapy: first steps in
the development of a nutrition quality-of-life survey. J Am Diet Assoc
2003, 103(7):844-851.
7. Sato E, Suzukamo Y, Miyashita M, Kazuma K: Development of a diabetes
diet-related quality-of-life scale. Diabetes Care 2004, 27(6):1271-1275.
8. Barr J, Schumacher G: Development of a Nutrition Quality of Life Survey
to Improve Patient-Centered, Chronic Nutrition Care. AcademyHealth
Schünemann et al. Health and Quality of Life Outcomes 2010, 8:26
/>Page 12 of 13
Meeting (2005 : Boston, Mass) Abstr Academy Health Meet 2005, abstract no.
4347.
9. Ware JE Jr, Kosinski M, Bayliss MS, McHorney CA, Rogers WH, Raczek A:
Comparison of methods for the scoring and statistical analysis of SF-36
health profile and summary measures: summary of results from the
Medical Outcomes Study. Med Care 1995, 33(Suppl 4):AS264-279.
10. Streiner DL, Norman GR: Health Measurement Scales. Oxford: Oxford
University Press 2003.
11. Puhan MA, Guyatt GH, Montori VM, Bhandari M, Devereaux PJ, Griffith L,
Goldstein R, Schunemann HJ: The standard gamble demonstrated lower
reliability than the feeling thermometer. J Clin Epidemiol 2005,
58(5):458-465.
12. Schunemann HJ, Norman G, Puhan MA, Stahl E, Griffith L, Heels-Ansdell D,
Montori VM, Wiklund I, Goldstein R, Mador MJ, et al: Application of
generalizability theory confirmed lower reliability of the standard
gamble than the feeling thermometer. J Clin Epidemiol 2007,
60(12):1256-1262.
doi:10.1186/1477-7525-8-26
Cite this article as: Schünemann et al.: An instrument to assess quality
of life in relation to nutrition: item generation, item reduction and
initial validation. Health and Quality of Life Outcomes 2010 8 :26.
Submit your next manuscript to BioMed Central
and take full advantage of:
• Convenient online submission
• Thorough peer review
• No space constraints or color figure charges
• Immediate publication on acceptance
• Inclusion in PubMed, CAS, Scopus and Google Scholar
• Research which is freely available for redistribution
Submit your manuscript at
www.biomedcentral.com/submit
Schünemann et al. Health and Quality of Life Outcomes 2010, 8:26
/>Page 13 of 13