báo cáo khoa học:" Evaluation of internal reliability in the presence of inconsistent responses" ppt
Bạn đang xem bản rút gọn của tài liệu. Xem và tải ngay bản đầy đủ của tài liệu tại đây (1.22 MB, 10 trang )
RESEARC H Open Access
Evaluation of internal reliability in the presence of
inconsistent responses
Daniel YT Fong
1*
,SYHo
2
, T H Lam
2
Abstract
Background: We aimed to assess the impact of inconsistent responses on the internal reliability of a multi-item
scale by developing a procedure to adjust Cronbach’s alpha.
Methods: A procedure for adjusting Cronbach’s alpha when there are inconsistent responses was developed and
used to assess the impact of inconsistent responses on internal reliability by evaluating the standard Chinese 12-
item Short Form Health Survey in adolescents.
Results: Contrary to common belief, random responses may inflate Cronbach’s alpha when their mean differ from
that of the true responses. Fixed responses inflate Cronbach’s alpha except in scales with both positive and
negative polarity items. In general, the bias in Cronbach’s alpha due to inconsistent responses may change from
negative to positive with an increasing number of items in a scale, but the effect of additional items beyond
around 10 becomes small. The number of response categories does not have much influence on the impact of
inconsistent responses.
Conclusions: Cronbach’s alpha can be biased when there are inconsistent responses, and an adjustment is
recommended for better assessment of the internal reliability of a multi-item scale.
Background
Internal reliability i s an attr ibute of a multi-item scale
that refers to the extent to which items in the scale are
related; it is very often evaluated to assess the reliability
of patient-reported outcomes (PROs). The most
common measu re of internal reliability reported in psy-
chometric studies of PROs is Cronbach’s alpha [1], but
unfortunately, it can be biased by the presence of incon-
sistent responses.
Inconsistent responding occurs when respondents
complete a questionnaire without comprehending the
items, typically in self-reported questi onnaires when the
participants are u nmotivated or the questions are sensi-
tive [2]. Inconsistent responses are classified as random,
when responses are given unsystematically, or fixed,
when the same response is given to all items [3].
Although the literature has not stipulated the impact of
inconsistent responses on internal reliability, fixed
responses by their nature would result in high associa-
tion among the responses of the associated items and
thus inflate the observed reliability in scales whose items
have the same polarity. They can also diminish it in
scales when that is not the case as the association
among the item responses w ould be lower. Moreover, a
substantial number of random responses would diminish
the internal reliability by the independent nature o f ran-
dom responses, but what it means by substantial and
such an effect in general are less certain.
In practice, inconsistent responses may not be easily
identified since they can also be plausible responses.
Random responses are particularly difficult to detect as
they have no identifiable patterns. Nevertheless, there
are tested personality scales, namely, the Minnesota
Multiphasic Personality Inventory-2 (MMPI-2) and the
Minnesota Multiphasic Personality Inventory-Adolescent
(MMPI-A), that assess the level of inconsistency for a
response [4,5]. Both of them have a variable response
inconsistency (VRIN) scale for assessing random
responding and a tru e response inconsistency (TRIN)
scale for assessing fixed responding. Cutoff values have
also been established for the detection of random and
fixed responses [4-6]. Depending on the instrument
used, the VRIN scale comprises at least 50 item pairs
* Correspondence:
1
School of Nursing, Li Ka Shing Faculty of Medicine, The University of Hong
Kong, Pokfulam Road, Hong Kong
Fong et al . Health and Quality of Life Outcomes 2010, 8:27
/>© 2010 Fong et al; licensee BioMed Central Ltd. This is an Open Access article distributed under the terms of the Creative Commons
Attribution License ( which permits unrestricted use, distribution, and re production in
any medium, provided the original work is properly cited.
and the TRIN at least 23 item pairs. As their length
does not always allow for concurrent use with PRO
instruments, we can only assess the s ensitivity of inter-
nal reliability within an antici pated range of the pro por-
tion of inconsistent responses. However, to the best of
our knowledge, no method is available for adjusting the
internal reliability due to inconsistent responses.
In view of these, we aimed 1. to evaluate the impact of
inconsistent responding on int ernal reliability; 2. to pro-
pose a method for adjusting Cronbach’s alpha in the
presence of inconsistent responses; and 3. to illustrate
the use of the procedure in evaluating the internal relia-
bility of the standard Chinese 12-item Short Form
Health Survey (SF-12v2) for a large sample of
adolescents.
Methods
Adjusting Cronbach’s alpha for inconsistent responses
We consider a multi-item scale when the total score S is
used as a health indicator. Cronbach’ salpharequires
adjustment when there are inconsistent responses. This
couldbedonewhentheproportionsofrandomand
fixed responses, denoted by p
R
and p
F
, respectively, are
known. Given these proportions, Cronbach’ salpha
based on the true responses (a
T
)canbederivedasthe
following formula:
a
m
m1
ab
T
(),1
(1)
where a is Cronbach’ s alpha without the adjustment
for inconsistent responses, and m is the number of
items. The quantities a and b are obtained from the
equations:
a
mp
R
mp
F
R
mp
R
p
F
p
R
p
FIR
varaince of S
[]()()()
222
1
2
(2)
and
b
m(p
R
p
F
R
mp
R
p
F
p
R
p
FIR
variance of S
) ( )( )( )
,
2
1
2
(3)
when all items have the same polarity. μ
R
and
R
2
are
the mean and variance of the random responses and
can be taken as
1
2
()K1
and
1
12
2
1()K
, respectively,
for scales composing of items responded on a K-point
Likert scale with each scored from 1 to K. μ
T
is the
mean of true responses and can be taken as
1
1
1
2()
()()
p
R
p
F
mean of S
m
p
R
p
F
K
[see Additional
file 1].
Cronbach’s alpha adjusted for incons istent responding
can be calculated from (1) after replacing the unknown
quantities by the corresponding sample estimates. Note
the adjustment assumes that both random and fixed
responses to an item are uniformly distributed over the
K-point Likert scale; i.e., there is no specific preference
of a certain response category. Performance of the
adjustment procedure is assessed by a small Monte-
Carlo simulation study. Biases of the adjusted Cron-
bach’s alpha are consistently smaller than those of the
unadjusted alpha [see Additional file 2].
Assessing the impact of inconsistent responses on
Cronbach’salpha
The impact of inconsistent responses as well as the
number of items and item response categories on Cron-
bach’s alpha is analytically assessed by using our derived
formula in (1). The assessment is performed under t he
following four settings that w ere chosen to cover some
common scenarios in practice:
1. The influence of random responses is assessed by
varying its proportion (p
R
)from0to50%whenp
F
is
taken to be 0 or 5%. The mean difference between the
true and random responses (μ
T
-μ
R
)is0or1,andthe
scale has 5 positive polarity items, each responded on a
5-point Likert scale.
2. The influence of fixed responses is assessed by vary-
ing its proportion (p
F
) from 0 to 50%. The p
R
is taken to
be 0 or 10%, and t he number of positive polarity items
is 5 or 3. Moreover, the mean difference between the
true and random responses (μ
T
-μ
R
) is 0, and the scale
has 5 items, each responded on a 5-point Likert scale.
3. The influence of the number of items is assess ed by
varying i t from 2 to 20 when the proportion of positive
polarity items is taken to be 0.5 or 1, and the mean dif-
ference between the true and random responses (μ
T
-μ
R
)
is 0 or 1. Moreover, all items are responded on a 5-
point Likert scale.
4. The influence of the number of item response cate-
gories (K) is assessed by varying it from 2 to 10 when
the number of positive polarity items is 5 or 3, and the
mean difference between the true and random responses
is 0 or 0.2 K. Moreover, we assume that 20% and 5% of
responses are random and fixed, respectively.
For each of the four scenarios, Cronbach’s alpha based
on the true responses is defined to be 0.4, 0.5, 0.6, 0.7
and 0.8.
A real example to illustrate the adjustment of
inconsistent responses
As an example, we evaluate the internal reliability of the
standard Chinese SF-12v2. The questionnaire consists of
12 items in eight scales. F or the sake of illustration, we
considered only the Physical functioning (PF), Role emo-
tional (RE) and Men tal health (MH) scales, each of
which consists of two items. All items in the three scales
Fong et al . Health and Quality of Life Outcomes 2010, 8:27
/>Page 2 of 10
are positively worded except one item in MH that is
negatively worded. Items in the PF scale use a 3-point
Likert scale, while the other items use a 5-point Likert
scale. The original scale scores are standardized in the
range of 0-100, but for conven ience, we just considered
thetotalscoreafterreversecodingtheresponsesofthe
negative polarity items. Note, however, that the internal
reliability is invariant to this standardization.
Data in the standard Chinese SF-12v2 w ere collected
from the Hong Kong Student Obesity Surveillance
(HKSOS) project conducted in 2006-2007. This study
was cross-sectional involving 42 high schools covering
all 18 districts in Hong Kong. It administered a survey
questionnairethatcontainedtheSF-12v2.Theproject
was approved by the Institut ional Review Board of The
University of Hong Kong and the Hospital Authority
Hong Kong West Cluster.
Results
The impact of inconsistent responses on Cronbach’s
alpha
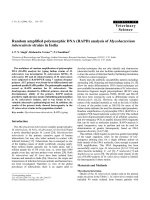
Figure 1 shows the influence of random responses on
the bias in Cronbach’s alpha under setting 1. In general,
the presence of rand om responses reduces the observed
Cronbach’s alpha (Figures 1(a) and 1(b)). In particular,
when there are no fixed responses and the true
responses are equal to the random responses on aver-
age, the reduction is more for higher Cronbach’salpha
calculated from true responses. However, when the true
responses are skewed relative to the random responses,
Cronbach’s alpha can be overestimated (Figures 1(c) and
1(d)). This is contrary to the common belief that the
presence of random responses always reduces the inter-
nal reliability. The overestimation is higher when the
true Cronbach’s alpha is smaller.
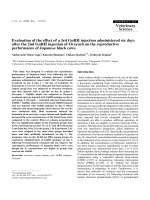
The influence of fixed responses under setting 2 is
examined in Figure 2. The presence of fixed response s
generally overestimates Cronbach’s alpha when all items
have the same polarity, but otherwise, it produces a
smaller estimate. The bias is again higher when the true
Cronbach’s alpha is smaller.
Figure 3 shows that the bias in Cronbach’ salphadue
to inconsistent responses may change from negative to
positive with an increasing number of items under set-
ting 3, but the effect of additional items beyond around
10 becomes small. On the other hand, a higher skew-
ness of the true responses increases the differential in
the bias under different true Cronbach’s alpha levels
(Figures 3(c) and 3(d)).
Under setting 4, the number of response categories does
not generally have much influence on the bias of Cron-
bach’ s alpha due to inconsistent responses (Figure 4).
There could be a small differential when there are only a
few response categories and the true responses are skewed.
However, the effect becomes smaller when there are more
response categories.
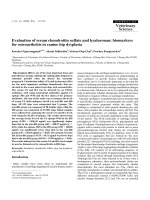
Internal reliability of the standard Chinese SF-12v2
We illustrate the adjustment of Cronbach’s alpha due to
inconsistent responses by evaluating the internal reliabil-
ity of the standard Chinese SF-12v2. A total of 33,692
completed questionnaires from adolescents were
received. A descriptive summary of the RE, PF and MH
scales including their Cronbach’s alpha coefficients are
summarized in Table 1. Note the unusually low internal
reliability of the MH scale, which may possibly be due
to the presence of inconsistent responses. Although the
survey questionnaire did not incorporate scales for
tracking inconsistent responses, there were multiple
response items other than those in the SF-12v2 with
“ none of the above” as a r esponse choice. Random
responses may be indicated if one or more responses
were chosen simultaneously with the contradicting
response of “no ne of the above”. Using one to six such
items closest to the SF-12v2, we estimated that there
would be 1.5% to 11% of random responses in the SF-
12v2. On the other hand, one item in the SF-12v2 con-
sists of three sub-items about how often one feels 1.
calm and peaceful, 2. energetic, and 3. downhearted and
depr essed. The same 5-point response scale from “all of
the time” to “none of the time” was used. As the three
sub-items are closely related and worded in different
polarities, the selection of the same extreme response
for all of them is suggestive of fixed responding. There
were 4% of students who chose “ all o f the time” or
“none of the time” in all three sub-items; this figure was
doubled if the less extreme responses of “ most of the
time” and “a little of the time” were also counted.
Hence, we estimated the percentage of fixed responses
to be 4% to 8%. We shall now illustrate the adjustment
of Cronbach’ s alpha for inconsistent responses. The
adjusted Cronbach’ s alpha which is a n estimate of a
T
is
denoted by a
a
.
For the RE scale, K = 5, and thus μ
R
can be estimated
as 3 and
R
2
as 2. When p
R
=0.02andp
F
= 0.05, we
may estimate μ
T
as 3.850. By (2) and (3), we have a =
0.835 and b = 0.092. With a = 0.87, solving (1) yields a
a
= 0.868. The values of a
a
at other values of p
R
and p
F
are shown in Figure 5(a). The presence of random
responses can reduce the internal reliability, and thus
thetrueCronbach’s alpha can be underestimated. On
the other hand, fixed responses inflate the observed
association between the two positive polarity items and
thus lead to over-estimation of the true Cronbach’s
alpha. Nevertheless, within our anticipated range of
random and fixed responses, Cronbach’ salphaforRE
should be above 0.8. Therefore, the RE scale can be
considered as internally reliable.
Fong et al . Health and Quality of Life Outcomes 2010, 8:27
/>Page 3 of 10
For the PF scale, K = 3, μ
R
is estimated as 2 and
R
2
as 0.67. The values of a
a
at different values of p
R
and p
F
are shown in Figure 5(b). While there remains an infla-
tion of Cronbach’s alpha when there are fixed responses,
it is interesting to note a general decreasing trend of the
true internal reliability after removing more random
responses. In other words, the presence of random
responses may also inflate Cronbach’salpha.Afurther
examination of the scale items revealed that they were
highly left skewed, with ceiling percentages of 80.4% and
81.5%, leading to 72.7% of the scale scores reaching the
plausible maximum of 6 ( Table 1). Indeed, random
responses are systematically lower (μ
R
=2)thantrue
responses (μ
T
> 2). Thus, when there are random
responses that uniformly spread over the plausible item
values, small item values are more likely random
responses than large item values. Consequently, indivi-
duals who gave random responses would more likely
have small values in all items, and hence their presence
woul d enhance the inter-item association. In fact, it can
be shown that the presence of random responses
increases the correlation between two positively worded
items when the true correlation is below
p
F
p
F
p
R
R
p
TT R
R
p
TT R
22
22
()
()
. This threshold increases when
Figure 1 Inf luence of random responses (p
R
)onCronbach’salpha(a
T
for the true responses) for different percentages of fixed
responses (p
F
) and mean differences between the true and random responses (μ
T
-μ
R
). There are 5 positive polarity items, each responded
on a 5-point Likert scale.
Fong et al . Health and Quality of Life Outcomes 2010, 8:27
/>Page 4 of 10
(μ
T
-μ
R
)
2
, which measures the skewness o f the true
responses from the mid-response, becomes large. In
summary, the PF scale should have a Cronbach’salpha
of at most 0.67 only, and its internal reliability could be
unacceptably low given the anticipated range of incon-
sistent responses.
Figure 5(c) examines the impact of inconsistent
responses on MH, which consists of a positive polarity
and a negative polarity item. In contrast to the other
two scales, the presence of both random and fixed
responses would reduce the Cronbach’ salphaofthe
MH scale. Thus, the reported Cronbach’salphaof0.33
is indeed the minimum level, and the adjusted value
could be as h igh as 0.66 given the anticipated range of
inconsistent responses.
Discussion
The presence of inconsistent responses may positively or
negatively bias the Cronbach’s alpha, making the assess-
ment of internal reliability difficult. An adjustment was
proposed to Cronbach’s alpha for correcting the effects
of inconsistent responses when one can estimate a pos-
sible range for the percentage of inconsistent responses.
This enables a sensitivity analysis to assess the potential
Figure 2 Influence of fixed responses ( p
F
)onCronbach’salpha(a
T
for the true responses) for different percentages of random
responses (p
R
) and numbers of positive (m
+
) and negative (m
-
) polarity items, m
+
-m
-
. The mean random/fixed response is identical to
that of the true responses, and there are 5 items, each on a 5-point Likert scale.
Fong et al . Health and Quality of Life Outcomes 2010, 8:27
/>Page 5 of 10
impact of inconsistent responses and facilitates a better
understanding of t he internal reliability of a multi-item
scale.
As one would expect, the presence of fixed responses
overestimates Cronbach’s alpha for scales composed of
items mostly worded i n the same direction but would
otherwise lead to an underestimation. However, it is
interesting to observe that random responses may
indeed inflate Cronbach’s alpha when the distribution of
true responses is skewed or, more precisely, when the
true mean response deviates from the random/fixed
mean response. This is contrary to the common
intuition that random responses would dilute the asso-
ciation among items and hence reduce the internal relia-
bility. Indeed, when the true item respo nses are skewed
on the same side, the addition of random responses that
scatter around the mid-response could strengthen asso-
ciation among the items if they are not too many. Thus,
paradoxically, this kind of noise could inflate the inter-
nal reliability and hence Cronbach’salpha.Unfortu-
nately, it is common for true responses to differ from
random/fixed responses, on average, especially in
patients whose quality of life has deteriorated due to
their adverse conditions. H ence, we should be c areful
Figure 3 Influence of the number of items (m) on Cronbach’salpha(a
T
for the true responses) for different proportions of positive
polarity items (m
+
/m). There are 20% random responses and 5% fixed responses, no difference between the mean of the random/fixed
responses and that of the true responses, and all items are responded on a 5-point Likert scale.
Fong et al . Health and Quality of Life Outcomes 2010, 8:27
/>Page 6 of 10
not to optimistically interpret Cronbach’salphawhen
there are random responses.
To determine random and fixed responses, tested per-
sonality scales such as the VRIN and TRIN scales of the
MMPI-2 and MMPI-A may be considered [4]. They are,
however, rather le ngthy, requiring at least 23 item pairs,
andtheymaynotbefeasiblyincorporatedintolarge
scale studies. Nevertheless, we need to have an estimate
of the proportion of inconsistent responses in a sample
before the proposed method can be effectively applied.
While the determination of whether an individual was
endorsing inconsistent responses can be a challenge,
modification or addition of a few items for tracking
potentially inconsistent responses will be helpful . As in
our illustrative example, the response option of “none of
the above” in items allowing multiple response choices
could be easily incorporated to track for potential ran-
dom responses. Fixed responses are more easily identi-
fied by the patterns that they follow. Incorpo rating
items that w ould not likely receive the same response
will be useful.
Cronbach’ s alpha of a scale has been known to be
higher in scales with more items [7]. We have found
that, when there are inconsistent responses, scales with
Figure 4 Influence of the number of item response categories (K) on Cronbach’ salpha(a
T
for the true responses) for different
proportions of positive polarity items (m+/m) and mean differences between the true and random responses (μ
T
-μ
R
). There are 20%
random responses and 5% fixed responses.
Fong et al . Health and Quality of Life Outcomes 2010, 8:27
/>Page 7 of 10
more items would also increase any upward bias in
Cronbach’s alpha. Although the increase diminishes and
may become negligible when there are many items, it is
better to keep the number of items minimal to avoid
reporting an overly optimistic Cronbach’s alpha. Never-
theless, there remains a chance of under-estimating
Cronbach’s alpha, and it is probably better to be conser-
vative when assessing the internal reliability of a scale.
We have also shown that the number of response cate-
gories does not have much influence on the bias of Cron-
bach’ s alpha induced by the presence of inconsistent
responses. There could be only a small positive increase in
the bias for scales with items of 3 or fewer response cate-
gories. Previous studies have shown that scales with fewer
response categories tend to have lower internal reliability
and suggested the use of more than 3 response categories
[8,9]. This recommendation is indeed also goo d to mini-
mize the i mpact of inconsistent responses. However, the
choice of the number of response categories may largely
depend on the actual content of the scale [10]. Modern
assessment of item characteristics utilizing item response
theory is deemed more useful to determine an appropriate
number of response categories [11].
We have illustrated how Cronbach’s alpha can be
adjusted for inconsistent responses by evaluating the stan-
dard Chinese SF-12v2 in a large sample of students. Note
that each scale of the SF-12v2 consists of at most two
items only. Although the Cronbach’s alpha may in theory
be used for scales of at least two items, its use for two-
item scales has been criticized [12]. The concern lies in
whether two items are sufficient to represent the corre-
spondingly larger domain comprising a much larger col-
lection of items. Alternative forms of reliability that utilize
more items in the same constru ct may be more desirable
[13]. Hence, the internal reliability of the SF-12v2 may
require further study. It is used here to merely illustrate
the impact of inconsistent responses on Cronbach’s alpha.
The proposed adjustment to Cronbach’s alpha for cor-
recting the effects of inconsistent responses facilitates
the assessment of the impact of inconsistent responses
on internal reliability. In practice, as soon as respon-
dents with inconsistent item-answer behavior had been
identified, it would be simpler to exclude them from the
calculation of Cronbach’ s alpha. However, when
the identification of such responses is difficult and the
anticipated range of inconsistent responses may be
taken more conservatively than that of actually identi-
fied, the proposed adjustment may be used.
We assumed the random and fixed responses to an
item are uniformly distributed over a K-point Likert
scale. When an individual is endorsing a random or fixed
response to an item without referencing to the actual
content of the time, there would likely be no specific pre-
ference on endorsing a particular response category.
Therefore, unless there are particular response categories
that would be generally endorsed more often i n the
population, the assumption of uniform distribution
appears to be reasonable. Nevertheless, a non-uniform
distribution may also be incorporated. Indeed, the adjust-
ment procedure depends on only the first two moments
of the random and fixed responses. A different mean of
random and fixed responses would either increase or
decrease its difference from the mean of true responses
(i.e. μ
T
-μ
R
), on which the influence has been examined in
Figure 1. On the other hand, an increase of the variance
of random and fixed responses would increase the pro-
portion of variance in the total score that is due to incon-
sistent responses (i.e.
R
2
/variance of S) which reduces
the observed Cronbach’s alpha.
We have not examined the impact of inconsistent
responses on inferen ce about Cronbach’salpha.How-
ever, it has been previously shown that the width of the
corresponding confidence interval is negatively propor-
tional to the estimated Cronbach’s alpha [14,15]. T hus a
Table 1 A summary of scales of the standard Chinese SF12v2 in adolescents
Scales
Role emotional (RE) Physical functioning (PF) Mental health (MH)
Number of response categories (K) 5 3 5
Number of items
Positive polarity (m
+
)221
Negative polarity (m
-
)001
Number of respondents 32939 32924 33025
Mean 7.58 5.57 7.02
Variance 4.05 0.65 2.62
Floor
a
2.2% 1.0% 0.6%
Ceiling
b
25.7% 72.7% 6.7%
Cronbach’s alpha 0.87 0.67 0.33
a
Percentage of values that equal to the plausible minimum of the scale
b
Percentage of values that equal to the plausible maximum of the scale
Fong et al . Health and Quality of Life Outcomes 2010, 8:27
/>Page 8 of 10
positively biased alph a would tend to result in a short
confidence interval leading to a nominal coverage less
than the required level. Hence, the false positive error
rate for testing about the significance of Cronbach’ s
alpha would also be increased.
Cronbach’s alpha has been criticized on the grounds that
is just a lower bound of reliability and that other measures
may be considered as a better lower bound measure than
the coefficient alpha [16]. Moreover, it implicitly assumes
the items are responded on an interval scale which limits
its use in PRO instruments when items are categorically
scored. Besides, it assumes a fixed level of reliability across
the whole range of the measurement, and is not a measure
of uni-dimensionality. Nevertheless, Cronbach’s alpha may
be interpreted as a measure of the proportion of the total
score variance that can be attributed to true score variance
that may be affected by the extent to whic h the items are
associated. Hence, we believe that the impact of inconsis-
tent responses could be applicable to the general evaluation
of internal reliability of a scale. An analytical exploration of
the impact of inconsistent responses would be desirable. A
potential method was the modern psych ometric assessm ent
by item response theory which allows the examination of
the response characteristics of individual items. It has
gained much popularity but it has been reviewed and con-
cluded to be relatively unsuccessful in identifying dissimu-
lation [17,18]. Further work may deem to be necessary.
Conclusions
Cronbach’ salphamaybeinflatedbyinconsistent
responses when either the mean of true responses differ
from that of the random/fixed responses or all i tems in
thescalehavethesamepolarity.Theinflationinthe
former situation i s due to the presence of random
responses, while the latter is due to the presence of
fixedresponses.Itshouldnotbeassumedthatrandom
responses always diminish Cronbach’s alpha.
Additional file 1: Derivation of the Cronbach’s alpha for true
responses when there are inconsistent responses. It describes in
details about the derivation of the Cronbach’s alpha for true responses
when there are inconsistent responses.
Click here for file
[ />S1.RTF ]
Additional file 2: A Monte-Carlo simulation study. It describes details
of a Monte-Carlo simulation study and shows the corresponding results.
Click here for file
[ />S2.RTF ]
Acknowledgements
We thank Mr. KK Mak and Miss W.S. Lo, who coordinated and collected data
in the HKSOS project. The HKSOS project was financially supported by The
University of Hong Kong University Research Committee Strategic Research
Theme on Public Health.
Figure 5 Internal reliability of the standard Chinese SF-12v2
after removal of inconsistent responses. The dot indicates
Cronbach’s alpha calculated when there are no inconsistent
responses.
Fong et al . Health and Quality of Life Outcomes 2010, 8:27
/>Page 9 of 10
Author details
1
School of Nursing, Li Ka Shing Faculty of Medicine, The University of Hong
Kong, Pokfulam Road, Hong Kong.
2
Department of Community Medicine
and School of Public Health, Li Ka Shing Faculty of Medicine, The University
of Hong Kong, Pokfulam Road, Hong Kong.
Authors’ contributions
DYTF contributed to the methodological development, data analysis and
drafting of the manuscript. SYH and THL critically revised the manuscript. All
authors have read and approved the final manuscript.
Competing interests
The authors declare that they have no competing interests.
Received: 10 September 2009 Accepted: 12 March 2010
Published: 12 March 2010
References
1. Cronbach LJ: Coefficient Alpha and the Internal Structure of Tests.
Psychometrika 1951, 16:297-334.
2. Siddiqui O, Mott JA, Anderson TL, Flay BR: Characteristics of inconsistent
respondents who have “ever used” drugs in a school-based sample.
Subst Use Misuse 1999, 34:269-295.
3. Weiner IB, Freedheim DK, Schinka JA, Gallagher M, Healy AF, Millon T,
Lerner RM, Reynolds WM, Stricker G, Nezu AM, et al: Handbook of
psychology Hoboken, N.J.: John Wiley 2003.
4. Handel RW, Arnau RC, Archer RP, Dandy KL: An evaluation of the MMPI-2
and MMPI-a true response inconsistency (TRIN) scales. Assessment 2006,
13:98-106.
5. Baer RA, Ballenger J, Berry DTR, Wetter MW: Detection of random
responding on the MMPI-A. Journal of Personality Assessment 1997,
68:139-151.
6. Baer RA, Kroll LS, Rinaldo J, Ballenger J: Detecting and discriminating
between random responding and overreporting on the MMPI-A. Journal
of Personality Assessment 1999, 72:308-320.
7. Cortina JM: What Is Coefficient Alpha - an Examination of Theory and
Applications. Journal of Applied Psychology 1993, 78:98-104.
8. Weng LJ: Impact of the number of response categories and anchor
labels on coefficient alpha and test-retest reliability. Educational and
Psychological Measurement 2004, 64:956-972.
9. Preston CC, Colman AM: Optimal number of response categories in
rating scales: reliability, validity, discriminating power, and respondent
preferences. Acta Psychologica 2000, 104:1-15.
10. Halpin G, Halpin G, Arbet S: Effects of Number and Type of Response
Choices on Internal Consistency Reliability. Perceptual and Motor Skills
1994, 79:928-930.
11. Roberson-Nay R, Strong DR, Nay WT, Beidel DC, Turner SM: Development
of an abbreviated Social Phobia and Anxiety Inventory (SPAI) using item
response theory: The SPAI-23. Psychological Assessment 2007, 19:133-145.
12. Cudeck R: Cronbach’s alpha on two-item scales. J Consum Psychol 2001,
10:55-55.
13. Ware JE, Turner-Bowker DM, Kosinski M, Gandek B: How to Score Version 2
of the SF-12® Health Survey Lincoln, RI: QualityMetric 2002.
14. van Zyl JM, Neudecker H, Nel DG: On the distribution of the maximum
likelihood estimator of Cronbach’s alpha.
Psychometrika 2000, 65:271-280.
15. Iacobucci D, Duhachek A: Advancing alpha: Measuring reliability with
confidence. J Consum Psychol 2003, 13:478-487.
16. Sijtsma K: On the Use, the Misuse, and the Very Limited Usefulness of
Cronbach’s Alpha. Psychometrika 2009, 74:107-120.
17. Ferrando PJ, Chico E: Detecting dissimulation in personality test scores: A
comparison between person-fit indices and detection scales. Educational
and Psychological Measurement 2001, 61:997-1012.
18. Reise SP, Flannery WP: Assessing person-fit on measures of typical
performance. Appl Meas Educ 1996, 9:9-26.
doi:10.1186/1477-7525-8-27
Cite this article as: Fong et al.: Evaluation of internal reliability in the
presence of inconsistent responses. Health and Quality of Life Outcomes
2010 8:27.
Submit your next manuscript to BioMed Central
and take full advantage of:
• Convenient online submission
• Thorough peer review
• No space constraints or color figure charges
• Immediate publication on acceptance
• Inclusion in PubMed, CAS, Scopus and Google Scholar
• Research which is freely available for redistribution
Submit your manuscript at
www.biomedcentral.com/submit
Fong et al . Health and Quality of Life Outcomes 2010, 8:27
/>Page 10 of 10