báo cáo khoa học:" Low Sense of Coherence (SOC) is a mirror of general anxiety and persistent depressive symptoms in adolescent girls - a cross-sectional study of a clinical and a non-clinical cohort" docx
Bạn đang xem bản rút gọn của tài liệu. Xem và tải ngay bản đầy đủ của tài liệu tại đây (885.76 KB, 13 trang )
Henje Blom et al. Health and Quality of Life Outcomes 2010, 8:58
/>Open Access
RESEARCH
© 2010 Henje Blom et al; licensee BioMed Central Ltd. This is an Open Access article distributed under the terms of the Creative Com-
mons Attribution License ( which permits unrestricted use, distribution, and reproduc-
tion in any medium, provided the original work is properly cited.
Research
Low Sense of Coherence (SOC) is a mirror of
general anxiety and persistent depressive
symptoms in adolescent girls - a cross-sectional
study of a clinical and a non-clinical cohort
Eva C Henje Blom*
1
, Eva Serlachius
1
, Jan-Olov Larsson
2
, Töres Theorell
3
and Martin Ingvar
1
Abstract
Background: The Sense of Coherence (SOC) scale is assumed to measure a distinct salutogenic construct separated
from measures of anxiety and depression. Our aim was to challenge this concept.
Methods: The SOC-scale, Beck's Depression Inventory (BDI), Beck's Anxiety Inventory (BAI) , the emotional subscale of
the Strengths and Difficulties Questionnaire (SDQ-em) and self-assessed health-related and physiological parameters
were collected from a sample of non-clinical adolescent females (n = 66, mean age 16.5 years with a range of 15.9-17.7
years) and from female psychiatric patients (n = 73), mean age 16.8 years with a range of 14.5-18.4 years), with
diagnoses of major depressive disorders (MDD) and anxiety disorders.
Results: The SOC scores showed high inverse correlations to BDI, BAI and SDQ-em. In the non-clinical sample the
correlation coefficient was -0.86 to -0.73 and in the clinical samples -0.74 to -0.53 (p < 0.001). Multiple regression
models showed that BDI was the strongest predictor of SOC in the non-clinical (beta coefficient -0.47) and clinical
sample (beta coefficient -0.52). The total degree of explanation of self assessed anxiety and depression on the SOC
variance estimated by multiple R
2
= 0.74, adjusted R
2
= 0.73 in the non-clinical sample and multiple R
2
= 0.66, adjusted
R
2
= 0.65 in the clinical sample.
Multivariate analyses failed to isolate SOC as a separate construct and the SOC-scale, BDI, BAI and SDQ-em showed
similar patterns of correlations to self-reported and physiological health parameters in both samples. The SOC-scale
was the most stable measure over six months.
Conclusions: The SOC-scale did not appear to be a measure of a distinct salutogenic construct, but an inverse
measure of persistent depressive symptoms and generalized social anxiety similar to the diagnostic criteria for major
depressive disorder (MDD), dysthymic disorder, generalized anxiety disorder (GAD) or generalized social anxiety
disorder (SAD) according to DSM-IV. These symptoms were better captured with SOC than by the specialized scales for
anxiety and depression. Self-assessment scales that adequately identify MDD, dysthymic disorder, GAD and SAD need
to be implemented. Comorbidity of these disorders is common in adolescent females and corresponds to a more
severe symptomatology and impaired global function.
Introduction
The Sense of Coherence (SOC) construct is based on
Antonovsky's salutogenic theory in which protective and
risk factors were considered to be qualitatively and
dimensionally different [1]. Antonovsky designed a Sense
of Coherence scale with 29 items and hypothesized that
the SOC scale specifically measured three protective fac-
tors together constituting a global salutogenic factor: 1.
the extent to which individuals are likely to perceive
stressors as predictable and explicable (comprehensibil-
ity), 2. the extent to which they have confidence in their
capacity to overcome the stressors (manageability) and 3.
the extent to which they judge it worthwhile to take on
* Correspondence:
1
Department of Clinical Neuroscience, Karolinska Institutet, Sweden
Full list of author information is available at the end of the article
Henje Blom et al. Health and Quality of Life Outcomes 2010, 8:58
/>Page 2 of 13
the challenge (meaningfulness) [1]. High SOC was sug-
gested to mirror a successful coping with stressors and
thereby increase resilience. Later studies by Antonovsky
himself and others have concluded that the SOC scale
seemed to be a reliable, valid, and cross culturally applica-
ble measure of how people cope with stressful situations
and stay well [2,3].While the predictive power of SOC in
relation to psychological health has been confirmed [4],
the predictive power on physical health is still a matter of
debate [5,6].
The discriminative validity of the SOC scale in relation
to measures of depression and anxiety has been ques-
tioned [7]. Strong negative correlations have been found
between SOC scores and measures of depression and
anxiety in adults [8]. Physiological health parameters
such as body mass index, blood pressure and saliva corti-
sol correlate in a similar way to SOC and measures of
anxiety and depression [9,10].
The association between SOC and symptoms of anxiety
and depression may apply to teenagers as well [11]. A
high SOC score has been suggested to buffer the negative
impact of emotion-oriented coping on suicidal manifesta-
tion in adolescent girls [12]. It is clinically important to
establish the independence of SOC in relation to mea-
sures of anxiety and depression especially in the young. It
is well known that symptoms of anxiety and depression
early in life are risk factors for future psychiatric prob-
lems and the absence of these symptoms may be impor-
tant salutogenic factors expressed by a high sense of
coherence. If a low sense of coherence simply mirrors
anxious and depressive problems, evidence-based meth-
ods for treatment may prevent chronic development and
enhance the individual's general resistance resources.
Antonovsky mentions that the social environment is an
important factor in forming the SOC [1]. Psychological
symptoms and abuse in childhood also seem to influence
the individual SOC [13,14]. From young adulthood SOC
was assumed to have stabilized and show fluctuations of
only about ten percent, except when faced with major life
changes. According to the suggested model individuals
with a strong SOC would show less variability of SOC
over time [3]. The literature is inconclusive regarding
temporal stability of SOC and whether SOC really is a
trait measure as suggested by Antonovsky. Recent data
imply a stabilization of SOC already at age 15 [15], but
contradictory to Antonovsky's statement it has also been
reported that SOC increases with age [10,16,17]. Further-
more, epidemiological data show that changes of SOC are
related to societal changes and psychiatric complaints in
the population [18]. and interventions with mindfulness
based stress reduction lead to an increase of SOC scores
[19], which implies that SOC is rather a state measure.
Teenage girls show increased vulnerability to anxiety
disorders and depression compared to boys [20,21]. The
gender differences apply also for SOC. Both teenage and
adult females have weaker SOC than men [10,13,22]. The
SOC scale, like psychiatric self-assessment scales, is used
in the same versions for boys and girls without adaption
to gender. In order to limit the variability of the sample
we chose to focus solely on adolescent girls.
The factors suggested in forming SOC may also be
applicable as risk factors for future development of anxi-
ety and depression. It is well known that symptoms of
depression and anxiety in childhood and adolescence
have a negative impact on future health [23-25]. It is
important to elucidate whether the SOC scale measures
specific protective abilities that can be identified and tar-
geted for training - or if the focus should be identification
and treatment of depression and anxiety in this age
group.
The aim of the present study was to challenge the con-
cept of SOC as a distinct salutogenic construct separated
from measures of anxiety and depression. In this paper
we explore in depth the SOC construct based on data
from a cohort study, in which we noted that the ability of
SOC to discriminate caseness of anxiety disorders (AD)
and/or major depressive disorder (MDD) from non-case-
ness in adolescent girls was better or equivalent to that of
specialized instruments [26].
At first, the relationship between SOC scores and self-
assessed symptoms of anxiety and depression were inves-
tigated by correlations and multiple regression models.
Secondly, by using multivariate analyses, we investigated
whether SOC and the measures of anxiety and depression
separated themselves into distinct categories. Thirdly, we
investigated whether the SOC score related to health
parameters differently compared to measures of anxiety
and depression. Finally, we compared the temporal stabil-
ity of SOC (considered to measure trait) with the tempo-
ral stability of measures of anxiety and depression
(considered to measure state).
Method
Samples
The non-clinical sample consisted of adolescent females
(n = 66), with a mean age of 16.5 years (range 15.9-17.7
years). This sample was recruited from high schools in a
small rural town, in Stockholm city, in an affluent north-
ern suburb and in a less affluent southern suburb with a
large immigrant population. Students received in oral and
written information about the study. About 80 percent of
the informed students participated, the participation
ratio being similar for all schools. The main reasons for
declining to participate were fear of blood sampling and
reluctance to miss school-hours.
The sample of adolescent female psychiatric patients (n
= 73) had a mean age 16.8 years (range 14.5-18.4 years)
and had been diagnosed with of one or several of the fol-
Henje Blom et al. Health and Quality of Life Outcomes 2010, 8:58
/>Page 3 of 13
lowing anxiety disorders (AD): general anxiety disorder
(GAD), social anxiety disorder (SAD), specific phobia,
panic disorder, separation anxiety, post-traumatic stress
disorder (PTSD) and/or major depressive disorder
(MDD). The subjects had ongoing treatment contact
(median duration 11 months) at one of 13 open psychiat-
ric clinics situated in the centre of Stockholm, its suburbs
and in smaller towns nearby. One of the authors informed
the staff at the clinics about the study and the staff then
asked their patients about participation and gave them
written information. According to staff reports 85 per-
cent of the informed patients participated, the remaining
number declined to do so out of fear of blood sampling or
parents not approving the procedure. Assessment by
child and adolescent psychiatrists or psychologist and a
semi-structured diagnostic interview - Development and
Wellbeing Assessment (DAWBA) - were used to establish
the diagnosis of AD and/or MDD. Patients with severe
autism or anorexia nervosa, mental retardation or psy-
chotic symptoms were not considered for inclusion in the
study. Two of the authors independently rated the com-
puter-generated DAWBA information of all patients. In
four cases the raters reported different diagnoses and in
all of these cases the diagnostic dilemma was to differen-
tiate GAD and MDD. However the raters reached con-
sensus after careful assessment of the available
information. Six subjects were denied participation
because the DAWBA was incomplete or could not con-
firm diagnosis of AD and/or MDD. A detailed flow chart
of the sampling procedure is previously published [27].
The study was approved by the Central Ethic's committee
at Karolinska Institutet.
Self-assessment questionnaires
Sense of Coherence (SOC) contains 29 items measuring
putatively salutogenic factors [3,28]. Every item is rated
on a 7-point scale giving a maximum score of 203. High
scores indicate a good SOC. In a Swedish student popula-
tion age < 30 years, the means were estimated to be 140
(SD 21.5) for women (N = 104) and 143 (SD 21.8) for men
(N = 121) [29].
Beck's Depression Inventory (BDI) consists of 21
items rated on a 4-point scale and yields a total score by
summation of the ratings for the individual items [30].
The total score ranges from 0-63 p and high scores indi-
cate more severe depression. When this study was
designed, the BDI-II had not yet been validated for the
Swedish version and therefore BDI-A1 is used in this
study.
Beck's Anxiety Inventory (BAI) contains 21 items
assessing the degree to which the respondent has been
affected by the physical or cognitive symptoms of anxiety
during the past week [31]. BAI items are also meant to
reflect panic attack symptoms. The total score ranges
from 0-63 p and high scores indicate more severe anxiety.
Strengths and Difficulties Questionnaire (SDQ) is an
internationally used screening instrument for mental
health problems in children and teenagers [32]. It com-
prises 25 statements regarding psychological attributes
and behaviours, forming five subscales. In this study, only
the emotional subscale (SDQ-em) was used. Acceptable
psychometric properties for the self-report version of
SDQ for adolescents have been shown in previous Swed-
ish studies [33].
Psychosomatic health was measured by frequency of
having headaches, back pain, stomach problems and
sleeping problems defined on a five-point scale by
"never", "seldom", "1-2 days per week", "3-4 days per
week", "every day".
The level of subjectively perceived stress in relation
to total life situation, in relation to schoolwork and in
relation to parents' life situation was assessed by a three-
point scale defined by "never accurate", "sometimes accu-
rate" and "always accurate".
Sense of support (by teachers and parents) and sense
of satisfaction (likes to be in school and likes to be with
friends) were assessed by a three-point scale defined by,
"never accurate", "sometimes accurate", "always accurate".
Health behaviors were assessed by the frequency of
physical activity (hard breathing, sweating), and going to
bed after midnight ("never", "seldom", "once a week",
"twice a week", ">twice a week") and by skipping breakfast
and smoking of cigarettes ("never", "seldom", "1-2 d/
week", "3-4 d/week" or "every day"). Estimated number of
hours spent watching TV per week was also reported.
Socio-demographic background was assessed by two-
alternative questions: "one or both parents born in Swe-
den/both parents born abroad", "living with both parents/
living with single parent", "both parents employed/one or
both parents unemployed".
The items of psychosomatic health, subjectively per-
ceived stress, sense of support and satisfaction, health
behaviors and socio demographic background did only
address the present status.
Diagnostic interview
Development and Wellbeing Assessment (DAWBA) is
a semi-structured diagnostic interview designed to gen-
erate ICD-10 and DSM-IV psychiatric diagnoses on 5-17
year olds. DAWBA has consistently generated sensible
estimates of prevalence and association with risk factors
supporting good validity [34]. No published data are
available on the inter-rater reliability of DAWBA, but
when compared to non-manually based clinical diagno-
ses, DAWBA diagnoses support good validity [34-36]. In
this study, the information was only collected from the
patients and not from parents and teachers.
Henje Blom et al. Health and Quality of Life Outcomes 2010, 8:58
/>Page 4 of 13
Physiological health parameters
Saliva cortisol was collected on an ordinary school-day,
the first sample shortly after waking up (still in bed), the
second sample 30 min later. The Salivette sampling device
with no preservative (Sarstedt) was used, the tube con-
sisting of a plastic sampling vessel with a sterile neutral
cotton wool swab, which had to be chewed for about 30 s
and then returned to the insert. The subjects noted the
time for each sample on the test-tubes and posted them
to the laboratory. The saliva samples were stored at the
laboratory at -20 C and analyzed by batch. The subjects
were given both written and verbal instructions, and were
requested not to collect saliva if they had a cold or were
ill, and not to smoke cigarettes or use oral tobacco within
two hours before sampling. Orion Diagnostica SPEC-
TRIA
R
Test Cortisol RIA, a test based on a competitive
immunoassay principle, routinely used for quantitative in
vitro estimation of cortisol in saliva, was used to deter-
mine the cortisol concentration in the saliva samples. The
area under the curve between the first and second mea-
surement in relation to baseline was calculated as a mea-
sure of the awakening response.
Heart rate variability (HRV) was measured with the
subjects sitting upright, in silence, with no body move-
ments allowed. None of the subjects had clinical signs or
symptoms of infectious disease. Use of tobacco (oral
tobacco and smoking of cigarettes) or intake of tea, cof-
fee, caffeinated soft drinks or beta stimulant asthma med-
ication was not allowed one hour prior to the
measurements. The HRV registration was preceded by 15
min of rest. HRV was measured for 2 min × 2, in between
which blood pressure was checked. This was a modified
version of a 12 min protocol [37]. The standard deviation
of inter-beat intervals (SDNN) was used as a time domain
measure and high frequency and low frequency of HRV
as frequency domain measures. In spectral analyses, vari-
ability distributes as a function of frequency [38]. High
frequency HRV (0.15-0.4 Hz) is related to vagal activity
and includes the respiratory sinus arrhythmia when the
breathing rate is normal. Low frequency HRV (0.04-0.15
Hz) has been interpreted as reflecting both sympathetic
and vagal input [39] but recent studies claim that low fre-
quency mirrors mainly vagal influence [40].
Plasma(p)-glucose was analyzed with a portable
Heamocue Glucose System device [41], the capillary sam-
ple being drawn right after the HRV measurement. The
sample did not constitute a proper fasting sample.
Weight and height were measured and body mass
index calculated (BMI = weight (kg)/height (m
2
)).
Statistical Analyses
The relation between self-assessment scales and health
variables were assessed by Pearson's product-moment
correlations or with the Spearman rank test when these
variables were of an ordinal nature. Partial correlations
were used to remove the effect of heart rate, systolic-, dia-
stolic blood pressure, body mass index, p-glucose and
physical activity on HRV. Comparisons between two
measurements were made in a two-tailed fashion with
the paired sample t-test, or with Wilcoxon's sign ranks
test when normal distributions were absent. Variables
with a positively skewed distribution were logarithmically
transformed. Logarithmically transformed HRV and cor-
tisol parameters were normally distributed when the
non-clinical and clinical samples were analyzed sepa-
rately.
To assess the degree of prediction of BDI, BAI and
SDQ-em respectively on SOC in the non- clinical and
clinical samples a multiple regression model was used
and of which the beta values were presented. By multiple
regression analyses we could also evaluate the total effect
of depressive, anxious and emotional symptoms on SOC.
The multiple R
2
represents the coefficient of determina-
tion and has the disadvantage of increasing with the
amount of predictors added. Therefore we also presented
the adjusted R
2
[42]. Principal component analyses were
used for orthogonal decomposition of the variables [43].
Explorative factor analyses and hierarchical cluster analy-
ses were used to investigate whether the items of the
scales arranged themselves in distinct categories [44].
Probability levels of 0.05 or less were considered signifi-
cant and confidence intervals of 95% were reported.
Analyses were done in Statistica 8.0 t-
soft.com or SPSS 17.0 .
Results
Sample characteristics
The DAWBA interview concluded that 19.2 percent of
the subjects fulfilled the criteria for only MDD, 32.9 per-
cent for only one or several AD, and 47.9 percent received
the combined diagnosis of both MDD and AD. The diag-
nosis of GAD constituted 34 percent and SAD 31 percent
of the total amount of AD-diagnoses. Comorbidity of two
or several AD occurred in 30.1 percent of the patients,
while comorbidity with another psychiatric diagnosis in
addition to AD and or MDD occurred in 37.0 percent of
the patients. The group with other psychiatric diagnoses
in addition to AD and/or MDD did not show extreme
scores on any of the assessment scales. On the contrary,
they scored lower than the group with comorbidity of AD
and MDD (data not shown).
SOC versus self-assessment of anxiety and depression
The internal consistency for SOC, BDI, BAI and SDQ-em
were high in both samples as described by Cronbach's
alpha (table 1). SOC showed the highest negative correla-
tions to the BDI in the non-clinical sample on both mea-
surements and also in the clinical sample (table 2).
Henje Blom et al. Health and Quality of Life Outcomes 2010, 8:58
/>Page 5 of 13
Multiple regression models showed that BDI was the
strongest predictor of SOC in the non-clinical (beta coef-
ficient -0.47) and clinical sample (beta coefficient -0.52)
(table 3). Multiple regression analyses also showed the
degree of explanation of self assessed anxiety and depres-
sion (BDI, BAI and SDQ-em) on the SOC variance in the
non-clinical sample, estimated by multiple R
2
= 0.74,
adjusted R
2
= 0.73 and in the clinical sample multiple R
2
=
0.66, adjusted R
2
= 0.65.
Multivariate analyses on item level
All multivariate analyses were performed on the com-
bined samples. Explorative factor analyses failed to iden-
tify SOC as a distinct construct separated from the
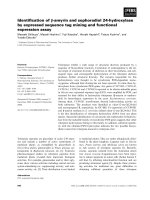
anxiety and depression constructs. Principal component
analyses (PCA) showed an orthogonal decomposition in
which SOC versus BDI, BAI and SDQ-em projected
themselves in the factor plane opposite each other (figure
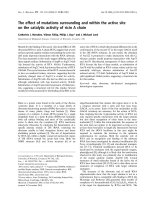
1). Furthermore, principal component analysis including
the SOC and the SDQ subscales of emotional problems,
peer problems, conduct problems and hyperactivity
clearly demonstrated that only SDQ-em and SOC have
the same dimensionality as opposed to peer problems,
conduct problems and hyperactivity that have unique
dimensionality compared to SOC (figure 2).
Hierarchical cluster analyses solely applied to SOC
items did not confirm any categories of meaningfulness,
manageability and comprehensibility. Hierarchical cluster
analysis performed on all items from all the scales
revealed that 17 of the BAI-items and one SDQ-em item
that addressed severe anxiety and physiological reactions
of fear, constituted a separate cluster. All SOC and BDI
items remained in the other cluster (data not shown).
SOC, BDI, BAI and SDQ-em versus health parameters
Generally SOC, BDI, BAI and SDQ-em showed a similar
pattern of correlation to both self-reported and physio-
logical health related parameters, although SOC often
showed higher correlations. Among the physiological
parameters, only the awakening response of saliva corti-
sol and the high frequency HRV correlated to SOC, BDI,
BAI and SDQ-em in the non-clinical sample and the cor-
relations were strongest for SOC. The correlations
between SOC and the self-assessed health-related param-
eters were generally lower in the clinical sample than the
non-clinical sample (table 4).
Temporal stability
The highest correlations between the first and second
measurement were found for SOC followed by BDI, BAI,
SDQ-em (table 5). The Wilcoxon matched pair test
showed significant differences of BDI and BAI, but not of
SOC and SDQ-em, between the measurements (table 5).
The correlations between the first and second measure-
ment were higher for all assessment scales in the low
SOC-score quartile of the non-clinical sample compared
to the high SOC-score quartile (data not shown). BDI and
BAI showed minor variation of over time, but showed
Table 1: Cronbach's alpha for the Sense of Coherence, Beck's Depression Inventory, Beck's Anxiety Inventory and the
emotional subscale of Strength's and Difficulties questionnaire
SOC BDI BAI SDQ-em
Non-clinical sample 0.94 0.87 0.93 0.71
Clinical sample 0.94 0.91 0.93 0.56
Table 2: Spearman's rho correlations of SOC, BDI, BAI and SDQ-em scores in measurement 1 of the non-clinical sample
(NC1), measurement 2 of the non clinical sample (NC2) (6 months interval) - and in the clinical sample (C).
NC-BDI 1 NC-BAI 1 NC-SDQ-em 1 NC-BDI 2 NC-BAI 2 NC-SDQ-em 2 C-BDI C-BAI C-SDQ-em
NC-SOC 1 -0.86*** N = 50 -0.78*** N = 50 -0.73*** N = 50
NC-BDI 1 -0.80*** N = 66 -0.73*** N = 66
NC-BAI 1 -0.73*** N = 66
NC-SOC 2 -0.79*** N = 59 -0.65*** N = 59 -0.71*** N = 59
NC-BDI 2 -0.75*** N = 62 -0.78*** N = 62
NC-BAI 2 -0.67*** N = 62
C-SOC -0.74*** N = 64 -0.70*** N = 68 -0.53*** N = 69
C-BDI -0.67*** N = 66 -0.44*** N = 67
C-BAI -0.50*** N = 70
*** significant at the p < 0.001 level
Henje Blom et al. Health and Quality of Life Outcomes 2010, 8:58
/>Page 6 of 13
significant correlation to SOC on both measurements
(table 2).
Discussion
The main finding of this study was that the SOC scale
appears to be an inverse measure of persistent and gener-
alized symptoms of anxiety and depression. The SOC
scale and self-assessed symptoms of anxiety and depres-
sion showed high correlations and multiple regression
models showed that symptoms of anxiety and depression
explained a major part of the SOC variance in both the
non-clinical and clinical samples. The SOC scale and
measures of anxiety and depression showed similar pat-
terns of correlations to health-related parameters in both
non-clinical and clinical samples of adolescent girls, simi-
lar to what has been shown in adults [10]. Multivariate
analyses failed to isolate SOC as a separate construct dis-
tinct from measures of anxiety and depression. As the
SOC items pertaining to the putative categories of mean-
ingfulness, manageability and comprehensibility showed
high covariance, the multivariate analyses failed to iden-
tify these as separate clusters. Previous factor analyses of
SOC items in samples of Swedish students show similar
results [29].
Regarding temporal stability, the highest correlations
between the first and the repeated measurements six
months later, were found for SOC followed by BDI, BAI,
SDQ-em. This may be explained by the fact that the BDI
and BAI ask about symptoms during the last two weeks.
BDI and BAI may thus capture mood swings and shorter
episodes of major depressive disorder and situational
anxiety on top of more persistent depressive symptoms
and generalized anxiety. Contradictory to the salutogenic
theory [1] the low quartile of the SOC score in the non-
clinical sample showed higher temporal stability than the
high quartile (data not shown). The data failed to support
that the SOC-scale is more stable at the high end of the
continuum. A limitation of this investigation was the lack
of repeated measures of the clinical sample, which would
have given information of temporal stability in the very
low end of the SOC continuum.
The extended hierarchical cluster analyses, that
included all the items of SOC, BDI, BAI, SDQ-em,
revealed that BAI and SDQ-em items that assessed symp-
toms of severe anxiety and physiological reactions of fear
clearly separated themselves from the BDI and SOC
items. It thus appeared as if BAI did not capture the type
of anxiety typical for GAD or generalized SAD. The gen-
eralized type of anxiety was better identified by the SOC-
scale. The results of the hierarchical cluster analyses can-
not be regarded as evidence, but aid an alternative inter-
pretation of SOC. The superior sensitivity of the SOC
scale for caseness of emotional disorders in adolescent
females described in our previous work [45] may be
explained by the fact that the SOC scale covers symptoms
congruent with the DSM-IV criteria for MDD, dysthymic
disorder, GAD and generalized SAD.
The question of item-overlap between SOC and mea-
sures of anxiety and depression has previously been sug-
gested [7] since meaninglessness/hopelessness is one of
the cardinal symptoms of major depressive disorder. Fur-
thermore, when suffering from MDD or generalized anx-
iety the cognitive function and social drive decrease
leading to a diminished comprehensibility and manage-
ability. In other psychiatric disorders such as ADHD, con-
duct disorder or situational anxiety this is not necessarily
the case. However, comorbidity is common in this age
group and depressive and anxious problems in combina-
tion with ADHD, conduct disorder or situational anxiety
may explain a possible decrease of SOC and also the
poorer outcome related to low SOC reported for ADHD
[46].
In adolescence, a decline in social engagement can be
the result of different trajectories. For example, depres-
sive and anxious symptoms may co-exist and develop
simultaneously to disorders of depression and anxiety.
Alternatively, a primary diagnosis of SAD or GAD may
lead to secondary depressive symptom. Finally, as often
the case, primary MDD or dysthymic disorder generate
secondary social problems. The differential diagnosing of
MDD, GAD and SAD is specifically difficult in adoles-
cence, since the diagnoses are highly co-morbid [47].
Genetic studies even indicate that depression and anxiety
Table 3: General regression model showing the degree of prediction of BDI, BAI and SDQ-em on SOC in the non-clinical
and clinical sample.
Assessment scale Non-clinical sample Clinical sample
Beta (CI) Beta (CI)
BDI -0.47 (0.75 to -0.19) N = 50 -0.52 (-0.71 to -0.32) N = 64
BAI -0.18 (-0.45 to 0.08) N = 50 -0.23 (-0.43 to 0.02) N = 68
SDQ-em -0.28 (-0.51 to -0.04) N = 50 -0.22 (-0.39 to -0.04) N = 69
Henje Blom et al. Health and Quality of Life Outcomes 2010, 8:58
/>Page 7 of 13
disorders may share a genetically determined neurobio-
logical component [48,49]. Comorbidity tends to gener-
ate higher severity scores in adolescent girls [45] and
comorbidity of GAD and MDD, is related to an increase
of overall mortality in adults [50]. Adolescents with
comorbidity of generalized anxiety and depression thus
need to be identified and prioritized for treatment and
deserve also more attention in future research.
The SOC-scores showed higher correlations to the
awakening response of saliva cortisol compared to the
psychiatric self-assessment scales in both samples. Due to
the great loss of cortisol samples especially in the clinical
sample this data is unsecure, nevertheless the finding is in
line with our hypothesis that SOC but not BDI and BAI
measures generalized anxiety, since in adolescents, per-
sistent anxiety, but not current or situational anxiety, is
associated with increase of the awakening response of
saliva cortisol [51].
Earlier population-based and clinical studies have
shown that a decrease of HRV is present both in anxiety
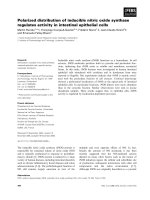
Figure 1 The projection of the scores of SOC, the psychiatric assessment scales (BDI, BAI, SDQ-em) and physiological health-related vari-
ables (systolic blood pressure SBP, diastolic blood pressure DBP, physical activity and plasma-glucose) on the factor plane calculated by
principal component analysis.
Projection of the variables on the factor-plane
BDI
BAI
SDQ-em
SOC
Phys activity
BMI
p-glucose
SBP
DBP
-1,0 -0,5 0,0 0,5 1,0
Factor 1 : 37,71%
-1,0
-0,5
0,0
0,5
1,0
Factor 2 : 17,87%
BDI
BAI
SDQ-em
SOC
Phys activity
BMI
p-glucose
SBP
DBP
Henje Blom et al. Health and Quality of Life Outcomes 2010, 8:58
/>Page 8 of 13
and depression [52-54], although the correlation of HRV
and SOC-score is not previously shown. In line with pre-
vious discussion the correlation between HRV and SOC
support that autonomous regulation is impaired in ado-
lescent girls with MDD, dysthymic disorder, GAD or gen-
eralized SAD.
The loss of SOC data (11 cases in the non-clinical sam-
ple) was due to incomplete forms from one of the schools
at the first measurement and can be considered a random
error. When omitting the subjects with incomplete forms
the rest of the sample showed a strong correlation to the
measures of anxiety and depression. The correlation was
similar in repeated measures six months later when the
full sample was included. The mean SOC score from the
subjects from measurement 1 (mean 137.1 SD 26.9) and
from the measurement 2 (mean 138.1 SD 27.5) were sim-
ilar. Hence, the impact of this data loss did not seem to
affect the conclusion. The loss of HRV data was due to
registration artifacts caused by body movements was also
random and should not have affected the conclusions.
Figure 2 The projection of the scores of SOC and the subscales of SDQ (emotional, peer problems, conduct problems, hyperactivity) on the
factor plane calculated by principal component analysis.
Projection of the variables on the factor-plane
SDQ-em
SDQ-co
SDQ-hy
SDQ-pp
SOC
-1,0 -0,5 0,0 0,5 1,0
Factor 1 : 62,14%
-1,0
-0,5
0,0
0,5
1,0
Factor 2 : 14,70%
SDQ-em
SDQ-co
SDQ-hy
SDQ-pp
SOC
Henje Blom et al. Health and Quality of Life Outcomes 2010, 8:58
/>Page 9 of 13
Table 4: Showing Pearson correlation coefficients calculated with pair-wise exclusion between SOC, BDI, BAI and SDQ-em and self-assessed and physiological
health-related parameters in the non-clinical (N = 66) and clinical sample (N = 73).
Non-clinical sample Clinical sample
Parameter N Mean (SD) SOC N = 55 BDI N = 66 BAI N = 66 SDQ-em N = 66 N Mean (SD) SOC N = 73 BDI N = 67 BAI N = 70 SDQ-em N = 73
SOC 55 137 (27) 73 96 (20.5) 97
Psychiatric symptoms
1
Depressive symptoms BDI 66 9.8 (8.4)) -0.86*** - 0.80*** 0.73 *** 67 25.1(12.0) -0.74*** - 0.67*** 0.44***
Anxiety symptoms BAI 66 13.3 (9.7) -0.78*** 0.79*** - 0.73*** 70 22.8(11.0) -0.70*** 0.67*** - 0.50***
Emotional problems SDQ-em 66 3.7 (2.4) -0.73*** 0.73*** 0.73*** - 73 3.7 (2.3) -0.53*** 0.44*** 0.50*** -
Hyperactivity SDQ-hy 66 3.7(2.6) -0.62** 0.64** 0.66** 0.53** 73 3.7(2.5) -0.52*** 0.51*** 0.51*** 0.37**
Conduct problems SDQ-co 66 1.3(1.3) -0.52** 0.58** 0.59** 0.53** 73 1.3(1.3) -0.40* 0.42*** 0.46*** 0.21
Peer problems SDQ-pp 66 1.5(1.8) -0.62** 0.53** 0.57** 0.38* 73 1.5 (1.8) -0.33** 0.36** 0.17 0.21
Psychosomatic symptoms
1
Headache 66 2.5(0.9) -0.42** 0.40** 0.50** 0.59** 70 3.1 (1.0) -0.26* 0.26* 0.40** 0.37**
Backache 66 2.6 (1.0) -0.54** 0.51** 0.54** 0.48** 70 3.1 (1.2) -0.25* 0.19 0.27* 0.39**
Stomach problems 65 2.3 (0.8) -0.39** 0.25* 0.33* 0.28* 70 3.5 (1.2) -0.19 0.18 0.25* 0.23
Sleep problems 66 2.6 (1.0) -0.45* 0.54** 0.61** 0.53** 70 2.6 (1.2) -0.25* 0.51** 0.30* 0.11
Dizziness 66 1.9(0.9) -0.26 0.32** 0.41** 0.09 70 2.0 (0.8) -0.43** 0.34** 0.46** 0.31**
Self-perceived stress
In relation to total life situation 64 2.6 (0.6) 0.41** -0.56** -0.50** -0.33* 67 2.0 (0.8) 0.19 -0.23 -0.06 -0.13
In relation to school work 66 1.6 (0.6) 0.51**' -0.42** -0.32** -0.40** 70 1.4 (0.6) 0.17 -0.14 -0.08 -0.11
In relation to parent's situation 66 2.2 (0.6) 0.26 -0.34** -0.24* -0.18* 66 1.9 (0.8) 0.12 -0.18 -0.28* -0.06
Sense of support/satisfaction
1
By teachers 66 1.6 (0.6) 0.55** -0.47** 0.46** -0.42** 70 2.0 (0.6) 0.55** -0.37** -0.39** -0.22
By parents 66 1.2 (0.7) 0.43** -0.38** 0.40** -0.38** 70 1.4 (0.7) 0.21 -0.20 -0.22 -0.35**
Likes to be in school 66 1.7 (0.7) 0.48** -0.47** 0.40** -0.33* 66 2.3 (0.6) 0.11 -0.08 -0.12 0.03
Likes to be with friends 66 1.3 (0.5) 0.23 0.24 0.14 0.20 66 1.9 (0.7) 0.00 -0.01 0.10 0.13
Health behaviours
1
Physical activity 66 3.5(1.1) 0.11 -0.04 0.09 -0.07 70 3.0(1.3) 0.24* -0.31* -0.29* -0.18
Skips breakfast 66 2.4(1,2) -0.32* 0.22 0.29* 0.30* 70 3.0(1.3) -0.24 0.30* 0.20 0.04
TV hours 62 4.7 (2.7) -0.12 0.11 0.15 0.26* 69 4.3(2.9) 0.22 -0.17 -0.13 -0.16
Daily smoking 61 1.8 (1.3) -0.34* 0.17 0.20 0.24* 69 2.1(1.3) -0.18 0.04 0.20 0.08
Henje Blom et al. Health and Quality of Life Outcomes 2010, 8:58
/>Page 10 of 13
Objective health parameters
2
Body Mass Index 66 22.2(3.6) -0.08 0.04 0.04 0.02 67 21.3 (3,9) -0.04 -0.01 -0.10 0.06
P-glucose 66 5.5 (0.7) -0.07 0.17 -0.04 0.01 69 6.7 (2.2) 0.07 -0.04 0.10 -0.01
Saliva cortisol AUC-b 46 2.1 (0.3) -0.32* 0.27 0.21 0.14 35 1.7 (0.7) -0.30 0.18 0.04 0.22
Blood pressure systolic 65 111 (9.7) 0.03 0.17 0.14 0.00 69 109 (16.6) -0.15 0.01 -0.01 0.20
Blood pressure diastolic 65 67 (7.5) 0.07 -0.06 -0.08 -0.15 68 68 (9.2) 0.06 -0.01 -0.02 0.09
HRV high frequency (HF) 53 5.9 (0.83) 0.32* -0.19 -0.16 -0.15 60 5.5 (0.86) -0.09 0.03 -0.05 0.09
HRV low frequency (LF) 53 5.9 (0.87) 0.15 -0.06 -0.06 -0.06 60 5.5 (0.86) -0.04 0.01 -0.04 0.06
HRV st d of inter-beat int (SDNN) 53 4.1 (0.32) 0.20 -0.14 -0.07 -0.08 60 3.88 (0.34) -0.13 0.04 0.01 0.11
HRV HF adjusted for HR 42 5.9 (0.84) 0.41** -0.32* -0.30 -0.43** 49 5.4 (0.88) -0.05 0.06 0.03 0.17
HRV LF adjusted for HR 42 6.0 (0.90) 0.17 -0.20 -0.13 -0.28 49 5.5 (0.91) 0.01 0.04 0.04 0.08
HRV SDNN adjusted for HR 42 4.1 (0.33) 0.28 -0.35* -0.28 0.44** 49 3.88 (0.35) -0.09 0.08 0.12 0.17
Socio-demographic factors
1
Parent unemployment 65 25% -0.15 0.15 0.22 0.25* 70 31% 0.03 0.02 0.07 0.14
Parent non Swedish ethnicity 66 24% -0.02 0.08 0.14 0.14 70 6% 0.15 0.00 -0.05 -0.29*
Single parent family 62 27% 0.06 -0.02 -0.07 0.06 70 47% 0.09 -0.09 -0.02 -0.28*
*** significant at the p < 0.001 level, ** p < 0.01, * p < 0.05
1
Spearman rank correlations,
2
Pearson product correlations,
3
When adjustments were done also for systolic blood pressure SBP, diastolic bloodpressure DBP, body mass index, p-glucose and
physical activity the significant correlations between HF and SDNN and self-assessment scales remained (SOC: HF 0.42**,SDNN 0.24 ns; BDI: HF -0.36**, SDNN-0.32**, BAI: HF -0.36*, SDNN -0.29 ns,
SDQ-em: HF -0.40*, SDNN -0.33*)
Table 4: Showing Pearson correlation coefficients calculated with pair-wise exclusion between SOC, BDI, BAI and SDQ-em and self-assessed and physiological
health-related parameters in the non-clinical (N = 66) and clinical sample (N = 73). (Continued)
Henje Blom et al. Health and Quality of Life Outcomes 2010, 8:58
/>Page 11 of 13
The loss of salivary cortisol on the contrary must be
regarded as a non-random error since it was more fre-
quent in the clinical sample (non clinical 20/66 and in the
clinical 38/73) creating an asymmetric loss in the sam-
ples. The loss of cortisol data may be linked to the
depressed mood of the patients. However, the primary
aim of including the salivary cortisol in table 1 was to
compare the correlation between AUC-b cortisol and
SOC, BDI, BAI and SDQ-em respectively.
Conclusions
The SOC-scale appears to be an inverse measure of per-
sistent depressive symptoms and generalized anxiety
when applied to adolescent girls rather than a measure of
a specific salutogenic construct. The symptoms captured
by the SOC scale are similar to the diagnostic criteria for
MDD, dysthymic disorder, GAD and SAD according to
DSM-IV. These disorders are not adequately identified by
the specialized self-assessment scales for anxiety and
depression that are currently available in validated Swed-
ish versions.
We can no longer rely on the assumptions that low
SOC is a trait measure from late adolescence and that it
measures a salutogenic construct separated from anxiety
and depression. On the contrary active identification of
adolescent girls with MDD, dysthymic disorder, GAD and
SAD should be emphasized. Comorbidity of these disor-
ders corresponds to increased symptom severity and high
negative impact on quality of life and global functioning.
Future research should aim to identify individuals with
increased vulnerability for depressive and anxious prob-
lems and try out preventive methods. Early identification
and treatment of depressive and anxious problems may
prevent recurrent episodes and life-long suffering.
List of abbreviations
BAI: Beck's Anxiety Inventory; BDI: Beck's Depression
Inventory; DAWBA: Development and Wellbeing Assess-
ment; GAD: Generalized Anxiety Disorder; HPA: Hypo-
thalamic-Pituitary-Adrenal; HRV: Heart Rate Variability;
MDD: Major Depressive Disorder; SAD: Social Anxiety
Disorder; SDNN Standard Deviation of Inter Beat Inter-
vals; SDQ-em: Strengths and Difficulties Questionnaire-
emotional subscale; SOC: Sense of Coherence
Competing interests
The authors declare that they have no competing interests.
Authors' contributions
All authors contributed to and have approved the final manuscript. EHB was
the "project leader" of the study, responsible for the data collection and wrote
the first draft of the manuscript. ES contributed with recruitment and diagnos-
tic issues of the clinical sample. TT contributed to the original outlines of the
project and was responsible for the saliva cortisol analyses. JOL was responsi-
ble for psychometric references and literature search. MI was responsible for
the over-all design of the study and for methodological issues.
Acknowledgements
Funding for this study was obtained from the Osher Center for Integrative
Medicine at Karolinska Institutet, public health grants from Stockholm County
Council, the Swedish Society of Medicine, the National Board of Health and
Welfare, the Söderström-Königska Foundation and the Stockholm Center for
Psychiatric Research and Education. None of them had any involvement in the
collection, analysis or interpretation of the data, in writing the report, or in the
decision to submit the paper for publication. Thanks to all the students,
patients, school nurses and staff at the clinics, who have contributed to this
study and to assistant professor Granath for statistical support.
Author Details
1
Department of Clinical Neuroscience, Karolinska Institutet, Sweden,
2
Department of Woman and Child Health, Karolinska Institutet, Sweden and
3
The Stress Research Institute, Stockholm University, Sweden
References
1. Antonovsky: Unraveling the Mystery of Health, How People Manage
Stress and Stay Well. Jossey Bass Social and Behavioral Science Series, San
Francisco 1987.
2. Eriksson M, Lindstrom B: Validity of Antonovsky's sense of coherence
scale: a systematic review. J Epidemiol Community Health 2005,
59(6):460-466.
3. Antonovsky A: The structure and properties of the sense of coherence
scale. Soc Sci Med 1993, 36(6):725-733.
Received: 22 December 2009 Accepted: 10 June 2010
Published: 10 June 2010
This article is available from: 2010 Henje Blom et al; licensee BioMed Central Ltd. This is an Open Access article distributed under the terms of the Creative Commons Attribution License ( which permits unrestricted use, distribution, and reproduction in any medium, provided the original work is properly cited.Health and Qu ality of Life Out comes 2010, 8:58
Table 5: Correlations and paired sample t-tests of self assessment scores comparing measurement 1 and 2 (6 months
interval). (Wilcoxon sign rank test is provided in addition since normal distribution was not present in all cases).
NMean (SD)
Corr. Coeff
1
t-value
2
Z-value
3
SOC 1 46 138.3 (27.8)
SOC 2 46 138.5 (27.6) 0.90*** -0.15 ns -0.03 ns
BDI 1 62 9.9 (8.7)
BDI 2 62 7.8 (7.7) 0.84*** 3.5** 3.29**
BAI 1 62 13.8 (9.8)
BAI 2 62 10.2 (8.7) 0.83*** 5.1*** 4.87***
SDQ-em 1 62 3.63 (2.4)
SDQ-em 2 62 3.39 (2.3) 0.72*** 1.1 ns 0.89 ns
*** significant at the p < 0.001 level, **p < 0.01
1
Pearson product correlations,
2
Paired sample t-test,
3
Wilcoxon signed ranks test
Henje Blom et al. Health and Quality of Life Outcomes 2010, 8:58
/>Page 12 of 13
4. Eriksson M, Lindstrom B: Antonovsky's sense of coherence scale and the
relation with health: a systematic review. J Epidemiol Community Health
2006, 60(5):376-381.
5. Flensborg-Madsen T, Ventegodt S, Merrick J: Why is Antonovsky's sense
of coherence not correlated to physical health? Analysing
Antonovsky's 29-item Sense of Coherence Scale (SOC-29).
ScientificWorldJournal 2005, 5:767-776.
6. Endler PC, Haug TM, Spranger H: Sense of coherence and physical
health. A "Copenhagen interpretation" of Antonovsky's SOC concept.
ScientificWorldJournal 2008, 8:451-453.
7. Geyer S: Some conceptual considerations on the sense of coherence.
Soc Sci Med 1997, 44(12):1771-1779.
8. Carstens JA, Spangenberg JJ: Major depression: a breakdown in sense of
coherence? Psychol Rep 1997, 80(3 Pt 2):1211-1220.
9. Kristenson M, Olsson AG, Kucinskiene Z: Good self-rated health is related
to psychosocial resources and a strong cortisol response to acute
stress: the LiVicordia study of middle-aged men. Int J Behav Med 2005,
12(3):153-160.
10. Konttinen H, Haukkala A, Uutela A: Comparing sense of coherence,
depressive symptoms and anxiety, and their relationships with health
in a population-based study. Soc Sci Med 2008, 66(12):2401-2412.
11. Myrin B, Lagerstrom M: Sense of coherence and psychosocial factors
among adolescents. Acta Paediatr 2008, 97(6):805-811.
12. Edwards MJ, Holden RR: Coping, meaning in life, and suicidal
manifestations: examining gender differences. J Clin Psychol 2001,
57(12):1517-1534.
13. Honkinen PL, Aromaa M, Suominen S, Rautava P, Sourander A, Helenius H,
Sillanpaa M: Early childhood psychological problems predict a poor
sense of coherence in adolescents: a 15-year follow-up study. J Health
Psychol 2009, 14(4):587-600.
14. Priebe G, Hansson K, Svedin CG: Sexual abuse and associations with
psychosocial aspects of health. A population-based study with
Swedish adolescents. Nord J Psychiatry 64(1):40-48.
15. Honkinen PL, Suominen S, Helenius H, Aromaa M, Rautava P, Sourander A,
Sillanpaa M: Stability of the sense of coherence in adolescence. Int J
Adolesc Med Health 2008, 20(1):85-91.
16. Nilsson KW, Leppert J, Simonsson B, Starrin B: Sense of coherence and
psychological well-being: improvement with age. J Epidemiol
Community Health 2009, 64(4):347-352.
17. Lindmark U, Stenstrom U, Gerdin EW, Hugoson A: The distribution of
''sense of coherence'' among Swedish adults: a quantitative cross-
sectional population study. Scand J Public Health 2009, 38(1):1-8.
18. Hendrikx T, Nilsson M, Westman G: Sense of coherence in three cross-
sectional studies in Northern Sweden 1994 1999 and 2004 - patterns
among men and women. Scand J Public Health 2008, 36(4):340-345.
19. Majumdar M, Grossman P, Dietz-Waschkowski B, Kersig S, Walach H: Does
mindfulness meditation contribute to health? Outcome evaluation of a
German sample. J Altern Complement Med 2002, 8(6):719-730. discussion
731-715
20. Breslau N, Schultz L, Peterson E: Sex differences in depression: a role for
preexisting anxiety. Psychiatry Res 1995, 58(1):1-12.
21. Nolen-Hoeksema S, Larson J, Grayson C: Explaining the gender
difference in depressive symptoms. J Pers Soc Psychol 1999,
77(5):1061-1072.
22. Buddeberg-Fischer B, Klaghofer R, Schnyder U: Sense of coherence in
adolescents. Soz Praventivmed 2001, 46(6):404-410.
23. Lewinsohn PM, Rohde P, Klein DN, Seeley JR: Natural course of
adolescent major depressive disorder: I. Continuity into young
adulthood. J Am Acad Child Adolesc Psychiatry 1999, 38(1):56-63.
24. Pine DS, Cohen P, Gurley D, Brook J, Ma Y: The risk for early-adulthood
anxiety and depressive disorders in adolescents with anxiety and
depressive disorders. Arch Gen Psychiatry 1998, 55(1):56-64.
25. Last CG, Hansen C, Franco N: Anxious children in adulthood: a
prospective study of adjustment. J Am Acad Child Adolesc Psychiatry
1997, 36(5):645-652.
26. Blom EH, Larsson JO, Serlachius E, Ingvar M: The differentiation between
depressive and anxious adolescent females and controls by
behavioural self-rating scales. J Affect Disord 2009, 122(3):232-240.
27. Henje Blom E, Olsson EM, Serlachius E, Ericson M, Ingvar M: Heart rate
variability (HRV) in adolescent females with anxiety disorders and
major depressive disorder. Acta Paediatr 2010, 99(4):604-611.
28. Antonovsky A, Sagy S: The development of a sense of coherence and its
impact on responses to stress situations. J Soc Psychol 1986,
126(2):213-225.
29. von Bothmer MI, Fridlund B: Self-rated health among university
students in relation to sense of coherence and other personality traits.
Scand J Caring Sci 2003, 17(4):347-357.
30. Beck AT, Ward CH, Mendelson M, Mock J, Erbaugh J: An inventory for
measuring depression. Arch Gen Psychiatry 1961, 4:561-571.
31. Beck AT, Epstein N, Brown G, Steer RA: The Beck Anxiety Inventory. An
inventory for measuring clinical anxiety: psychometric properties. J
Consult Clin Psychol 1988, 56:893-897.
32. Goodman R: Psychometric properties of the strengths and difficulties
questionnaire. J Am Acad Child Adolesc Psychiatry 2001,
40(11):1337-1345.
33. Svedin CG, Priebe G: The Strengths and Difficulties Questionnaire as a
screening instrument in a community sample of high school seniors in
Sweden. Nord J Psychiatry 2008, 62(3):225-232.
34. Goodman R, Ford T, Richards H, Gatward R, Meltzer H: The Development
and Well-Being Assessment: description and initial validation of an
integrated assessment of child and adolescent psychopathology. J
Child Psychol Psychiatry 2000, 41(5):645-655.
35. Alyahri A, Goodman R: Validation of the Arabic Strengths and
Difficulties Questionnaire and the Development and Well-Being
Assessment. East Mediterr Health J 2006, 12(Suppl 2):S138-146.
36. Mullick MS, Goodman R: The prevalence of psychiatric disorders among
5-10 year olds in rural, urban and slum areas in Bangladesh: an
exploratory study. Soc Psychiatry Psychiatr Epidemiol 2005, 40(8):663-671.
37. von Scheele I, von Scheele B, Hansson G, Winman A, Theorell T:
Psychosocial factors and respiratory and cardiovascular parameters
during psychophysiological stress profiling in working men and
women. Appl Psychophysiol Biofeedback 2005, 30(2):125-136.
38. Camm AJ: Heart rate variability. Standards of measurement,
physiological interpretation, and clinical use. Task Force of the
European Society of Cardiology and the North American Society of
Pacing and Electrophysiology. Eur Heart J 1996, 17(3):354-381.
39. Berntson GG, Bigger JT Jr, Eckberg DL, Grossman P, Kaufmann PG, Malik M,
Nagaraja HN, Porges SW, Saul JP, Stone PH, et al.: Heart rate variability:
origins, methods, and interpretive caveats. Psychophysiology 1997,
34(6):623-648.
40. Porges SW: The polyvagal perspective. Biol Psychol 2007, 74(2):116-143.
41. Banauch D, Brummer W, Ebeling W, Metz H, Rindfrey H, Lang H, Leybold K,
Rick W, Staudinger HJ: A glucose dehydrogenase for the determination
of glucose concentrations in body fluids (author's transl). Z Klin Chem
Klin Biochem 1975, 13(3):101-107.
42. Berk RA: Regression Analysis: A Constructive Critique: v. 11 (Advanced
Quantitative Techniques in the Social Sciences). Sage Publications,
Thousand Oaks, CA; 2004.
43. Jolliffe I: Principal Component Analysis. 2nd edition. Springer, New York,
NY; 2002.
44. Everitt BDG: Applied Multivariate Data Analysis. 2nd edition. Arnold,
London; 2001.
45. Blom EH, Larsson JO, Serlachius E, Ingvar M: The differentiation between
depressive and anxious adolescent females and controls by
behavioural self-rating scales. J Affect Disord 2009.
46. Edbom T, Malmberg K, Lichtenstein P, Granlund M, Larsson JO: High
sense of coherence in adolescence is a protective factor in the
longitudinal development of ADHD symptoms. Scand J Caring Sci .
47. Angold A, Costello EJ, Erkanli A: Comorbidity. J Child Psychol Psychiatry
1999, 40(1):57-87.
48. Hettema JM: What is the genetic relationship between anxiety and
depression? Am J Med Genet C Semin Med Genet 2008, 148C(2):140-146.
49. Axelson DA, Birmaher B: Relation between anxiety and depressive
disorders in childhood and adolescence. Depress Anxiety 2001,
14(2):67-78.
50. Phillips AC, Batty GD, Gale CR, Deary IJ, Osborn D, MacIntyre K, Carroll D:
Generalized anxiety disorder, major depressive disorder, and their
comorbidity as predictors of all-cause and cardiovascular mortality:
the Vietnam experience study. Psychosom Med 2009, 71(4):395-403.
51. Greaves-Lord K, Ferdinand RF, Oldehinkel AJ, Sondeijker FE, Ormel J,
Verhulst FC: Higher cortisol awakening response in young adolescents
with persistent anxiety problems. Acta Psychiatr Scand 2007,
116(2):137-144.
Henje Blom et al. Health and Quality of Life Outcomes 2010, 8:58
/>Page 13 of 13
52. Greaves-Lord K, Ferdinand RF, Sondeijker FE, Dietrich A, Oldehinkel AJ,
Rosmalen JG, Ormel J, Verhulst FC: Testing the tripartite model in young
adolescents: is hyperarousal specific for anxiety and not depression? J
Affect Disord 2007, 102(1-3):55-63.
53. Licht CM, de Geus EJ, Zitman FG, Hoogendijk WJ, van Dyck R, Penninx BW:
Association between major depressive disorder and heart rate
variability in the Netherlands Study of Depression and Anxiety
(NESDA). Arch Gen Psychiatry 2008, 65(12):1358-1367.
54. Licht CM, de Geus EJ, van Dyck R, Penninx BW: Association between
anxiety disorders and heart rate variability in The Netherlands Study of
Depression and Anxiety (NESDA). Psychosom Med 2009, 71(5):508-518.
doi: 10.1186/1477-7525-8-58
Cite this article as: Henje Blom et al., Low Sense of Coherence (SOC) is a mir-
ror of general anxiety and persistent depressive symptoms in adolescent girls
- a cross-sectional study of a clinical and a non-clinical cohort Health and
Quality of Life Outcomes 2010, 8:58