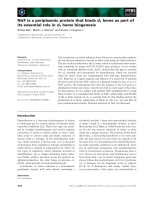
báo cáo khoa học:" Validation of a computer-adaptive test to evaluate generic health-related quality of life" ppsx
Bạn đang xem bản rút gọn của tài liệu. Xem và tải ngay bản đầy đủ của tài liệu tại đây (469.75 KB, 8 trang )
RESEARC H Open Access
Validation of a computer-adaptive test to
evaluate generic health-related quality of life
Pablo Rebollo
1*
, Ignacio Castejón
1
, Jesús Cuervo
1
, Guillermo Villa
1
, Eduardo García-Cueto
2
, Helena Díaz-Cuervo
1
,
Pilar C Zardaín
1
, José Muñiz
2
, Jordi Alonso
3,4
, the Spanish CAT-Health Research Group
Abstract
Background: Health Related Quality of Life (HRQoL) is a relevant variable in the evaluation of health outcomes.
Questionnaires based on Classical Test Theory typically require a large number of items to evaluate HRQoL.
Computer Adaptive Testing (CAT) can be used to reduce tests length while maintaining and, in some cases,
improving accuracy. This study aimed at validating a CAT based on Item Response Theory (IRT) for evaluation of
generic HRQoL: the CAT-Health instru ment.
Methods: Cross-sectional study of subjects aged over 18 attending Primary Care Centres for any reason. CAT-
Health was administered along with the SF-12 Health Survey. Age, gender and a checklist of chronic conditions
were also collected. CAT-Health was evaluated considering: 1) feasibility: completion time and test length; 2)
content range coverage, Item Exposure Rate (IER) and test precision; and 3) construct validity: differences in the
CAT-Health scores according to clinical variables and correlations between both questionnaires.
Results: 396 subjects answered CAT-Health and SF-12, 67.2% females, mean age (SD) 48.6 (17.7) years. 36.9% did
not report any chronic condition. Median completion time for CAT-Health was 81 seconds (IQ range = 59-118) and
it increased with age (p < 0.001). The median number of items administered was 8 (IQ range = 6-10). Neither
ceiling nor floor effects were found for the score. None of the items in the pool had an IER of 100% and it was
over 5% for 27.1% of the items. Test Information Function (TIF) peaked between levels -1 and 0 of HRQoL.
Statistically significant differences were observed in the CAT-Health scores according to the number and type of
conditions.
Conclusions: Although domain-specific CATs exist for various areas of HRQoL, CAT-Health is one of the first IRT-
based CATs designed to evaluate generic HRQoL and it has proven feasible, valid and efficient, when administered
to a broad sample of individuals attending primary care settings.
Background
Health-Related Quality of Life (HRQoL) is among the
most used variables in Health Outcomes Research
(HOR) in the academic field, as well as in clinical trials
and post-authorisation studies. It refers to the subjective
valuation of the influence of health on the individuals’
ability of having a normal functioning which makes it
possible to perform all the activities which are important
for them and which affect their well-being [1]. Although
during the last 35 years HRQoL assessment has had an
enormous development worldwide, several barriers limit
its use in the clinical practice. These barriers had been
described by Deyo and Patrick in 1989 [2] and were
revised in Spain in 2005 [3]. Classi cal Test Theory
(CTT) cannot solve certain practical issues, such as the
high number of questions needed to complete a multi-
dimensional HRQoL questionnaire and the lack of accu-
racy when dealing with the change of individual scores
over time. Item Response Theory (IRT) [4,5] overcomes
some of the lim itations that may affect instruments
developed under the CTT. CAT instruments based on
IRT, clearly increase “measurement efficiency” (the rat io
of a measure’s psychome tric soundness to the response
burden the measures imposes). A greater measurement
precision can be achieved through the selection of a few
items from a calibrated item pool that combines high
* Correspondence:
1
BAP Health Outcomes Research, Calle Azcárraga 12 A, 33010, Oviedo, Spain
Full list of author information is available at the end of the article
Rebollo et al. Health and Quality of Life Outcomes 2010, 8:147
/>© 2010 Rebollo et a l; licensee BioMed Central Ltd. This is an Open Access artic le distributed under the terms of the Creative Commons
Attribu tion License (h ttp://creativecommons.org/licenses/by/2.0), which perm its unrestricted use, distribu tion, and reproduction in
any medium, provided the original work is properly cited.
quality items from multiple instruments into a single
data resource [6]. Since each item is independently
described by parameters such as difficulty or discrimina-
tion [7], they can be combined as necessary, therefore,
there is no questionnaire as such but different combina-
tions of items which provide comparable scores.
Through IRT, an Item Characteristic Curve (ICC) is
constructed f or each item; t his curve reflects the prob-
ability of the answer to each item for each HRQoL level.
Using ICC, t he HRQoL level of a given subject can b e
estimated after answering any number of items. Further-
more, IRT allows us to estimate the contribution each
item make s to the assessment for each level of the vari-
able: the Information Function. Measurement error is
inversely linked to the information used and hence an
error estimate is available for each assessment.
Based on this theory, Computer Adaptive Tests
(CATs) arise as a psychometric assessment technique
administered through a computer. For each respondent,
the selection of items is adapted to the prior estimates
of the construct being assessed [7]. These tests have
been successfully used in Education and Psychology
fields [8] and they allow a more practical assessment
and a more accurate estimation of the variable being
measured, in this case, HRQoL. CATs result in the indi-
vidual administration of questionnaires, as well as in the
collection and computation of responses, providing
instant results [9].
Since the 90 s, when some authors recommended
CAT applications for health [10], a variety o f CATs
have been developed in the Health field, as those for
migraine [11,12], rheumatoid arthritis [13], osteoarthritis
[14], back pain [15], physical therapy [16,17], anxiety
[18], cancer [19] and paediatrics [20]. All these CATs
focus on one specific condition or HRQoL domain, but
they cannot measure generic HRQoL in healthy or ill
subjects from the general population. As it is well
known, HRQoL is essentially a multidimensional con-
cept. This fact could make it difficult to accomplish the
unidimensionality required for the application of IRT
[21]. Despit e this fact, we t hink it is possible to develop
a calibrated item pool to measure the underlying con-
struct of generic HRQoL. Pursuing this aim, in a pre-
vious study [22], an expert panel proposed a pool of 140
five-level Likert items, chosen among several HRQoL
questionnaires validated in Spain. That pool was first
administered to a pilot sample and later to a general
sample of patients belonging to 7 Primary Health cen-
tres. Two administration options were offered to the
later sample: 1) on paper 2) on a touch panel. Item
Response Theory psychometric properties (discrimina-
tion, reliability and validity) were evaluated by means of
a Factorial Analysis and other methods. The Informa-
tion Function was analyzed and an application method
was tested by means of simulation: a minimum of
5 items and a maximum of 15 were shown; the first
item was randomly selected among 13 which deal with
generic health aspects and covered a broad HRQoL
range. These 13 initial items were selected among the
most informative items by an expert panel. The result
was a calibrated pool of 96 items [22]. This pool of items
showed a factorial structure in one dimension (with 45%
of the variance explained and a lowest loading of 0,224)
and evidenced high reliability (Cronbach’s alfa = 0.99).
This manuscript presents the validation of CAT-
Health: a CAT based on the described calibrated item
pool, using the mentioned application method and
implemented with a touch screen interface. This valida-
tion study, gathering information from a sample of sub-
jects from the Spanish general population, pursues the
goal of obtaining a feasible and accurate instrument to
measure generic HRQoL in the clinical setting.
Methods
A cross-sectional study of subjects aged over 18 attend-
ing one of the four participant Primary Care Centres
(PCC) for any reason was carried out, in order to assess
the validity of CAT-Health. The study hence included
subjects with chronic conditions or acu te pathologies
but also h ealthy subjects, for instance, patients’ healthy
relatives at the PCC. Before their inclusion, all patients
were informed and provided written informed consent,
in accordance with the ethical principles of the Declara-
tion of Helsinki and the Good Clinical Practice
guidelines.
Data were collected during three consecutive days in
each PCC, between February and March 2007, by using
two methods: a tablet PC (electronic pencil required)
and a touch screen panel (neither mouse nor pencil
necessa ry). Subjects completed a very short initial ques-
tionnaire about their age, sex and whether they had suf-
fered any of the chronic conditions presented in a
checklist including: anxiety, depression, acute disease,
arterial hypertension, cardiac disease, diabetes, joint
pain, migraine, pulmonary disease and “other diseases”.
The patients filled this chronic conditions checklist on
their own. In addition, the SF-12 Health Survey was
administered using the same devices [23-25]. CAT-
Health and SF-12 completion times were automatically
recorded.
The CAT-Health system
The CAT-Health system evaluates the ge neric HRQoL
of healthy or ill subjects from the general population by
showing a variable number of items (between 5 and 15),
extracted from a unidimensional calibrated pool of 96
items which had been previously developed [22]. All the
items in the pool have 5 response categories. The first
Rebollo et al. Health and Quality of Life Outcomes 2010, 8:147
/>Page 2 of 8
item is randomly selected among 13 initial items which
cover a broad r ange of the measured construct
(HRQoL) and which focus on generic health aspects.
These 13 initial items were selected among the most
informative items by an expert panel Based on the
response to this first question, the system selects the
most informative item to be presented as the following
question, iteratively. The sys tem stops when either: 1)
the maximum number of items (n = 15) has been pre-
sented to the subject; or 2) the minimum number of
items has been achieved, the estimation error is below
the unity and the percentage of reduction of the error,
with respect to the previous estimatio n, is below 5%.
This application method was theoretically tested by
meansofasimulationstudy[22]anditprovidedan
accurate score for moderately low or high HRQoL levels
(ne ar to general population mean score). The score cal-
culated by CAT-Health system has a theoretical range
between -3.85 and +3.87, but it was normalized to a
50 ± 10 distribution, in order to facilitate its interpreta-
tion:(CATscore-mean)/SD*10+50.Thehigherthe
score, the better the HRQoL.
Evaluation of the CAT-Health system
CAT-Health was evaluated considering three dif ferent
criteria: 1) feasibility of the system in the clinical prac-
tice, in terms of completion time and test length, paying
special attention to elderly subjects (fourth quartile of
the distribution). 2) Psychometric evaluation, including
content range coverage, Item Exposure Rate (IER) and
test precision; and 3) Validity assessment of CAT-
Health. Construct validity was studied through the ana-
lysis of differences in CAT-Health scores depending on
sex (females were expecte d to have worse scores than
males), age (elderly people were expected to show worse
scores) and the presence of reported chronic conditions
(the higher the number of conditions, the worse the
score). It was also hypothesized that subjects with one
of the listed pathologies should have a wors e score than
subjects without them. Migraine, acute pathology,
hypertension and “other pathologies”, however, were not
considered to be associated to HRQoL a priori, because
the content of the items was not designed to take into
account acute or silent pathologies. Finally, CAT-Heal th
convergent validity was evaluated with respect to SF-12
physical and mental component scores. A moderate cor-
relation between both questionnaires was expected (cor-
relation coefficients between 0.3 and 0.6), as it is usually
found when HRQoL generic questionnaires are com-
pared [26-28]
Statistical analysis
Absolute and relative frequencies were used to describe
the sample distribution with respect to the nominal
variables (sex and declared pathologies). Mean and stan-
dard deviation were used for the continuous variables
(age, CAT-Health and SF-12 scores, and number of
declared pathologies). Quartiles were used in the case of
the CAT-Health completion times and test length. Dif-
ferences in the number of items shown to subjects,
according to age and chronic conditions, were assessed
by means of a Kruskal-Wallis test. Differences according
to sex were evaluated by means of a Mann-Whitney
test.
Content range coverage of CAT-Health was studied
through the analysis of floor and ceiling effects. Item
Exposure Rate (IER) was defined as the ratio of the total
number of times a given item is shown to the number
of times CAT-Health was administered. Test precision
was studied through the analysis of the Test Information
Function (TIF), which is an aggregate of the information
provided by each item. Considering the adaptive nature
of the system and that the number of items shown
within each test were limited to 15, a TIF using all the
items in the pool is not representative of a typical test,
so a TIF was constructed by using just the 15 items
which provided more information at each level (given
this was a continuous range, a process of discretization
was ne cessary and 800 HRQoL levels w ere considered).
Note that the selection of items might change within
the HRQoL range.
Differences in CAT-Health scores between males and
females and between subjects who declared having any
of the listed pathologies were assessed by means of a
t test. Lineal regression analysis was performed to con-
firm the association of e ach of the pathologies ind epen-
dently with the CAT-Health score. Correlation between
CAT-Health scores and age and the number of patholo-
gies was analyzed by means of Pearson and Spearman
correlation coefficients, respectively. The sample was
divided into 4 groups, according to the number of
declared pathologies (none, 1, 2, 3 or more) and also
according to the quartiles of the distribution of age;
CAT-Health and SF-12 scores were compared among
these groups by means of One-Way ANOVA. Effect size
was computed for CAT-Health score and the physical
and mental components of SF-12, when comparing
mean differences between groups (age, sex and number
of pathologies): Cohen’s d in the case of a t test and eta
square inthecaseofANOVA.Followingtheguidelines
proposed by Cohen [29], for t te sts, an effect size of 0.1
was considered small, 0.3 was considered medium
and 0.5 was large. In the case of ANOVA, 0.01, 0.06
and 0.14 were considered small, medium or large,
respectively.
Correlations between the CAT-Health score and the
SF-12 physical and mental components were assessed by
means of Pearson correlation coefficients.
Rebollo et al. Health and Quality of Life Outcomes 2010, 8:147
/>Page 3 of 8
Results
The characteristics of the sample (N = 396) are
described in Table 1. The mean age (SD) was 48.6
(17.7) years and two thirds of the subjects were f emale.
Moreover, one third of the participants did not report
any chronic condition from the list.
Regarding the analysis of the practical use of CAT-
Health, the median completion time of CAT-Health was
81 seconds (IQ range = 59 seconds-118 seconds),
increasing with age (p < 0.001) from 66 seconds in the
group of subjects aged under Pc25 to 107 seconds in
the group of subjects aged over Pc75. The median num-
ber of the CAT-Health items shown to subjects was 8
(IQ range = 6-10). There were not statistically signifi-
cant differences (p > 0.05) in the number of items
shown to males and females, to subjects from different
age groups and to subjects according to the number of
declared pathologies.
The CAT-Health non-normalized score ranged
between -2.4 and +2.8 (theoretical range between -3.8
and +3.8). Neither ceiling nor floor effects were found.
The mean normalized score was 50.88 (6.02), with a
minimum of 34.71 and a maximum of 80.89. The mean
Physical Component Summary (PCS) score of SF-12 was
46.84 (10.1) and it ranged between 19.12 and 67.06; the
mean Mental Component Summary (MCS) score was
46.88 (10.96), ranging between 11.18 and 67.83.
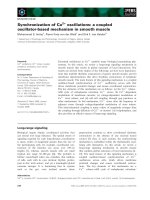
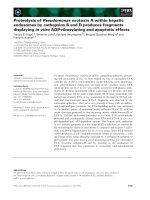
Figure 1 shows CAT-Health Item Exposure Rate (IER).
None of the items in the pool had an exposure rate of
100%, while 36 items (37.5% ) were not shown at any
time (20 of them could not be shown with the chosen
application method). IER was over 5% for 26 items
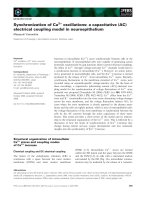
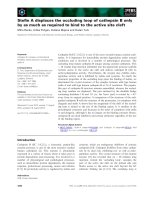
(27.1%). The best-15 TIF is shown in F igure 2 along
with the standard error f or each level of the scale. The
Test Information Function (TIF) peaked between leve l
-1 and 0 of HRQoL, which corresponds to the normal-
ized scores 35.58 and 52.19. In this part of the scale, the
error was below 0.2.
Regarding construct validity, in Table 2 the compari-
son of CAT-Health and SF-12 scores is shown with
respect to sex, age and the number of declared patholo-
gies. CAT-Health and SF-12 MCS scores were higher
for males than for females (p < 0.0001). The effect size
(ES) of CAT-Health (0.46) was similar to that of MCS
(0.51) and higher than that of PCS (0.12). The CAT-
Health score showed a negative statistically significant
correlation with age (r = -0.351; p < 0.001) as SF-12
PCS did (r = -0.255; p < 0.001); SF-12 MCS did not
show a statistically significant correlation with age. By
dividing the sample in four age groups (under 34.27
years; 34.27-46.26; 46.27-61.19; over 61.19), ANOVA
analysis showed statistically significant differences (p <
0.0001) among age groups for CAT-Health and PCS
scores. The CAT-Health score also showed a negative
statistically significant correlation with the number of
pathologies declared by the respondents (r = -0.548; p <
0.01), like PCS and MCS (r = -0.337 and r = -0.262,
respectively; p < 0.01). The ES of CAT-Health (0.12)
was higher than those of PCS (0.06) and MCS (0.01).
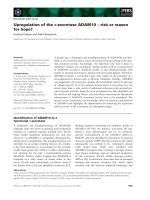
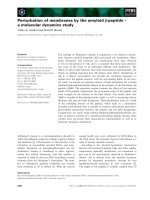
Figure 3 shows the CAT-Health scores of subjects
who declared suffering from any of the listed patholo-
gies and of those who did not. Differences were all sta-
tistically significant (p < 0.05), except that of acute
pathology and migraine. These differences remained
Table 1 Sample description (N = 396)
Sample description
All (N = 396) Male (N = 130) Female (N = 266)
Mean age (SD) 48.61 (17.67) 49.03 (18.45) 48.40 (17.30)
Frequency of declared pathologies: n (%)
Anxiety 70 (17.7%) 11 (8.5%) 59 (22.2%)
Depression 56 (14.1%) 5 (3.8%) 51 (19.2%)
Acute pathology 98 (24.7%) 31 (23.8%) 67 (25.2%)
Arterial hypertension 66 (16.7%) 23 (17.7%) 43 (16.2%)
Cardiac disease 32 (8.1%) 13 (10%) 19 (7.1%)
Diabetes 37 (9.3%) 19 (14.6%) 18 (6.8%)
Joint pain 125 (31.6%) 32 (24.6%) 93 (35%)
Migraine 36 (9.1%) 5 (3.8%) 31 (11.7%)
Pulmonary disease 31 (7.8%) 13 (10%) 18 (6.8%)
Other pathology 85 (21.5%) 34 (26.2%) 51 (19.2%)
Number of self-reported conditions
0 36.9% 43.1% 33.8%
1 33.8% 36.2% 32.7%
2 16.4% 12.3% 18.4%
3 or more 12.9% 8.4% 15.1%
Rebollo et al. Health and Quality of Life Outcomes 2010, 8:147
/>Page 4 of 8
statistically significant when analysing each of the
pathologies adjusting by the re st of them in a regression
analysis. SF-12 PCS did not detect differences between
patients with or without anxiety, depression, acute dis-
ease, pulmonary disease and migraine; neither did SF-12
MCS detect differences in the case of diabetes, acute
disease, cardiac disease, pulmonary disease, arterial
hypertension and “other disease”.
The correlation coefficients between CAT-Health
scores and SF-12 PCS (r = 0.547) and MCS (r = 0.346)
were moderate and statistically significant (p < 0.001).
Discussion
Several computer-adaptive tests (CAT) evaluating health
outcomes have been developed and validated in recent
years, but, to our knowl edge, the CAT-Health system is
one of the first CATs designed to evaluate generic
HRQoL.Theresultsofthepresentstudyshowthat
CAT-Health is feasible, valid and efficient for HRQoL
evaluation: its psychometric propert ies were satisfactory
when evaluating HRQoL in a wide range of subjects
attending primary care settings.
The use of HRQoL as a health outcome measure is
becoming more important in the evaluation of patient
care and health services. It is usually evaluated using
questionnaires based on CTT, administered through
pencil and paper. Once the answers of a subject are
collected, the questionnaire has to be coded and
scored, and then the results have to be interpreted.
This is a time consuming process and, therefore, it is
expensive, especially for follow-ups in clinical prac-
tice. These problems constitute a barrier that prevents
the evaluation of HRQoL in the clinical setting [3].
CAT instruments clearly increase “measurement effi-
ciency” (the ratio of a measure’ s psychometric
Figure 1 The CAT-Health Item Exposure Rate (IER). The IER is the ratio of the total number of times one item is presented to the number of
times CAT-Health is administered.
Figure 2 The CAT-Health best-15 Test Information Function
(TIF). The TIF is used to evaluate the test precision for different
HRQoL levels.
Rebollo et al. Health and Quality of Life Outcomes 2010, 8:147
/>Page 5 of 8
soundness to the response burden the measures
imposes) [7]. CAT instruments decrease the response
burden, diminishing the number of questions to be
answered by the subject; they have small floor and
ceiling effects, when they use an extensive item bank;
they reduce the error of measurement and so they
measure much more accurately; they are flexible,
adapting themselves to the trait level of the respon-
dent and also to specific measurement contexts
[11-20].
Table 2 Comparison of the CAT-Health and SF-12 scores according to sex, age and number of self-reported conditions
Comparison of the CAT-Health and SF-12 scores according to sex, age and number of declared pathologies
CAT-Health SF-12 PCS SF-12 MCS
Sex Male (N = 130) 52.68 (6.51) 47.65 (9.43) 50.89 (9.45)
Female (N = 266) 49.99 (5.56) 46.44 (10.40) 44.92 (12.57)
p(t test) < 0.0001 0.262 < 0.0001
Effect size (Cohen’s d) 0.455 0.120 0.513
Age < 34.27 years (N = 100) 53.96 (5.69) 50.46 (7.98) 47.59 (11.19)
34.27-46.26 years (N = 98) 51.33 (5.53) 47.82 (10.42) 47.24 (11.65)
46.27-61.19 years (N = 99) 49.66 (5.29) 44.83 (10.32) 45.36 (12.30)
> 61.19 years (N = 99) 48.54 (6.18) 44.20 (10.36) 47.34 (12.70)
p (ANOVA) < 0.0001 < 0.0001 0.537
Effect size (eta square) 0.116 0.062 0.006
Number of self-reported conditions None (N = 146) 54.23 (5.72) 50.56 (7.84) 50.80 (9.04)
1 pathology (N = 134) 50.89 (4.86) 46.74 (10.23) 46.52 (12.40)
2 pathologies (N = 65) 47.75 (7.42) 44.14 (10.81) 42.78 (12.70)
3 or more pathologies (N = 51) 45.24 (4.66) 39.85 (9.97) 41.86 (13.59)
p (ANOVA) < 0.0001 < 0.0001 < 0.0001
Effect Size (eta square) 0.272 0.124 0.082
t test: *
(
p<0.05
)
**
(
p<0.001
)
Figure 3 Differences in the CAT-Health scores according to self-reported conditions (means and 95% confidence intervals).
Rebollo et al. Health and Quality of Life Outcomes 2010, 8:147
/>Page 6 of 8
Historically, HRQoL has been considered a multi-
dimensional concept. Some authors argue, however, that
there is an underlying construct that affects all them
and can be directly measured [30]. In a previous paper,
we presented the development and calibrati on of a gen-
eric HRQoL item bank, so that the assessment of
HRQoL with a single dimension was feasible [22]. Using
that item bank, we developed one of the first IRT-based
CATs for the evaluation of generic HRQoL, t he valida-
tion of which we have presented in this manuscript.
The evaluation of CAT-Heal th has shown that CAT-
Health system median completion time i s really short
(under1minuteandahalf).Eventhoughwehave
shown that the completion time was associated with the
age of the respondents (it must be taken into account
that elderly people are not familiar with the interfaces
used to fill in the questionnaire), the median completion
time for the group of individuals in the last quartile of
age (over 61.19 years) w as still well beneath 2 minutes.
Also, the evaluation of generic HRQoL with CAT-health
required a median of 8 items, a test length similar to
that of published CATs for specific groups of patholo-
gies: AM-PAC-CAT [16], for post-acute care, showed a
mean of 6.6 items; each of the 5 domains of the CAT-
5D-QOL [15], for back pain, 4.4 to 6.6 items; and the
Anxiety-CAT [18] 6 to 8 items.
In this validation study, 60 items were shown a t least
once, which represents the 79% of the items in the pool
that could be shown, according to the chosen applica-
tion method (at least 20 items will never appear, as they
are not amongst the 15 most informative for any
HRQoL level). The fact that none of the items had an
IER of 100% and that the number of different items
used at some point was high indicates that the system
actually adapted the items presented to the individuals
in the sample, pointing to the adequacy of a CAT for
HRQoL measurement.
With respect to the content range coverage of CAT-
Health, the frequency distributions of the non-normal-
ized scores of the subjects under study were normally
distributed, with no floor nor ceiling effects, as
expected for a generic instrument in this sample. On
the contrary, the abovementioned domain-specific
CATs presented ceiling effects: 10% for AM-PAC-
CAT [16] (that presented a roughly normally distribu-
ted score) and 0% to 6.1% for the different CAT-5D-
QOL scales [15]. Normalized CAT-Health scores (50
± 10) had a similar range to those of SF-12 PCS and
slightly narrower than those of MCS. The perfor-
mance of CAT-Health in HRQoL assess ment in the
studied sample, which covered a broad spectrum of
individuals attending primary care settings, indicates a
good potential for the evaluation of the general
population.
The analysis of the TI F showed th at CAT-Health is a
very discriminative measurement tool in the range of
scores between 35 and 52, which corresponds to a nor-
mal or slightly deteriorated HRQoL, the most frequent
status in people who demand health care at a primary
care centre. Future research is needed in order to add
new items to the pool which would allow CAT-Health
to cover a broader range of HRQoL.
The analysis of validity demonstrated that the CAT-
Health score is a valid generic measure of HRQoL.
CAT-Health adequately detects the hypothesized differ-
ences between male and female subjects, as well as
between different age groups and among groups by the
number of declared pathologies.
Recently, the Adaptive Measurement of Change
(AMC) has been proposed as a feasible and effective
method for measuring individual c hange using CATs
[31]. The avail ability of an error estimate for each sub-
ject, in this type of measurements, turns high the preci-
sion of CATs, like CAT-Health, into useful instruments
for monitoring HRQoL. The sensitivity to change of
CAT-Health will be addressed in the future by means of
a longitudinal study. The validation of the system in a
broader random sample of the general population and
the adaptation fo r its use in English are also planned.
These studies will include a larger number of clinical
variables to allow for a detailed evaluation of the con-
struct validity of the system.
Conclusions
Although domain specific CATs exist for various areas of
HRQoL, CAT-Health is one of the first IRT-based CAT
designed to evaluate generic HRQoL and it has proven
feasible, valid and efficient, when administered to a broad
sample of individuals attending primary care settings.
The reduced number of items required for HRQoL
evaluation and the resulting shortened completion time,
together with the characteristics inherent to computer-
ized instruments, such as automa tic scoring and inter-
pretation of results, make of CAT-Health a practical
instrument for clinical settings, as Primary Care Centres.
These two facts, along with its sound psychometric
properties, which open the possibility of evaluating
HRQoL changes at the individual level, are important
advantages of the CAT-Health system over other gen-
eric questionnaires based on CTT.
Note
The Spanish C.A.T-Health group is formed by research-
ers from:
BAP Health Outcomes Research, Oviedo, Spain; 4
th
Area Primary Care Centers, Principality of Asturias
Health Service, Oviedo, Spain; Universidad de Oviedo,
Psychology Department, Ovie do, Spain; Universidad
Rebollo et al. Health and Quality of Life Outcomes 2010, 8:147
/>Page 7 of 8
Complutense de Madrid, Methodology Department,
Madrid, Spain; Institut Municipal d’Investigació Mèdica
(IMIM-Hospital del Mar), Health Research Unit Ser-
vices, Barcelona, Spain.
Acknowledgements
The authors would like to thank the Health Director of the 4th Area Primary
Care Canters of Asturias and all the GPs and pollsters of the Primary Care
Centres that participated in this study: “El Cristo”, “Colloto”, “Paulino Prieto”,
“Pumarín”, “Teatinos”, “Vallobín-Concinos” and “Ventanielles”. Thanks, also, to
all the patients who kindly spent some minutes of their time to complete
the questionnaire and to Adriana Pérez for the proofreading of this article.
Author details
1
BAP Health Outcomes Research, Calle Azcárraga 12 A, 33010, Oviedo, Spain.
2
Universidad de Oviedo, Psychology Department, Plaza Feijoo s/n, 33003,
Oviedo, Spain.
3
Institut Municipal d’Investigació Mèdica (IMIM-Hospital del
Mar), Doctor Aiguader 88, 08003, Barcelona, Spain.
4
CIBER en Epidemiología
y Salud Pública (CIBERESP), Doctor Aiguader 88, 08003, Spain.
Authors’ contributions
All authors are responsible for the reported manuscript and have
participated in its concept and design, analysis and interpretation of data
and, finally, in its drafting and review.
Competing interests
The authors hereby declare that there is no conflict of interests, financial
agreement or other involvement with any company whose product figures
in the submitted work. Pablo Rebollo, Ignacio Castejón, Jesús Cuervo,
Guillermo Villa and Helena Díaz-Cuervo work at BAP Health Outcomes
Research, which is the Applicant of a Spanish patent application
(P200701072) and a European patent application (EPO8013312) related to
the CAT-Health system.
Received: 4 June 2010 Accepted: 3 December 2010
Published: 3 December 2010
References
1. McHorney CA: Health status assessment methods for adults: past
accomplishments and future challenges. Annu Rev Public Health 1999,
20:309-335.
2. Deyo RA, Patrick DL: Barriers to the use of health status measures in
clinical investigation, patient care, and policy research. Med Care 1989,
27:S254-S268.
3. Rebollo P, Valderas JM, Ortega F: [Progress in Spain of the described
barriers to the use of perceived health status measures in the clinical
practice]. Med Clin (Barc) 2005, 125:703-705.
4. Hambleton RK, Swminathan J, Rogers HJ: Fundamentals of item response
theory Newbury Park, CA: Sage Publications; 1991.
5. Hambleton RK: Item Response Theory: introduction and bibliography.
Psicothema 1990, 1:97-107.
6. Hambleton RK: Applications of item response theory to improve health
outcomes assessment: developing item banks, linking instruments, and
computer-adaptive testing. In Outcomes assessment in cancer. Edited by:
Lipscomb J, Gotay CC, Snyder C. Cambridge, U.K.: Cambridge University
Press; 2005:445-464.
7. Cook KF, O’Malley KJ, Roddey TS: Dynamic assessment of health
outcomes: time to let the CAT out of the bag? Health Serv Res 2005,
40:1694-1711.
8. Ware JE Jr: Conceptualization and measurement of health-related quality
of life: comments on an evolving field. Arch Phys Med Rehabil 2003, 84:
S43-S51.
9. Harniss M, Amtmann D, Cook D, Johnson K: Considerations for developing
interfaces for collecting patient-reported outcomes that allow the
inclusion of individuals with disabilities. Med Care 2007, 45:S48-S54.
10. Revicki DA, Cella DF: Health status assessment for the twenty-first
century: item response theory, item banking and computer adaptive
testing. Qual Life Res 1997, 6:595-600.
11. Bjorner JB, Kosinski M, Ware JE Jr: Using item response theory to calibrate
the Headache Impact Test (HIT) to the metric of traditional headache
scales. Qual Life Res 2003, 12:981-1002.
12. Ware JE, Kosinski M, Bjorner JB, Bayliss MS, Batenhorst A, Dahlof CG, et al:
Applications of computerized adaptive testing (CAT) to the assessment
of headache impact. Qual Life Res 2003, 12:935-952.
13. Martin M, Kosinski M, Bjorner JB, Ware JE, Maclean R, Li T: Item response
theory methods can improve the measurement of physical function by
combining the modified health assessment questionnaire and the SF-36
physical function scale. Qual Life Res 2007, 16:647-660.
14. Kosinski M, Bjorner JB, Ware JE, Sullivan E, Straus WL: An evaluation of a
patient-reported outcomes found computerized adaptive testing was
efficient in assessing osteoarthritis impact. J Clin Epidemiol 2006,
59:715-723.
15. Kopec JA, Badii M, McKenna M, Lima VD, Sayre EC, Dvorak M:
Computerized adaptive testing in back pain: validation of the CAT-5D-
QOL. Spine 2008, 33:1384-1390.
16. Jette AM, Haley SM, Tao W, Ni P, Moed R, Meyers D, et al: Prospective
evaluation of the AM-PAC-CAT in outpatient rehabilitation settings. Phys
Ther 2007, 87:385-398.
17. Haley SM, Gandek B, Siebens H, Black-Schaffer RM, Sinclair SJ, Tao W, et al:
Computerized adaptive testing for follow-up after discharge from
inpatient rehabilitation: II. Participation outcomes. Arch Phys Med Rehabil
2008, 89:275-283.
18. Walter OB, Becker J, Bjorner JB, Fliege H, Klapp BF, Rose M: Development
and evaluation of a computer adaptive test for ‘Anxiety’ (Anxiety-CAT).
Qual Life Res 2007, 16(Suppl 1):143-155.
19. Petersen MA, Groenvold M, Aaronson N, Fayers P, Sprangers M, Bjorner JB:
Multidimensional computerized adaptive testing of the EORTC QLQ-C30:
basic developments and evaluations. Qual Life Res 2006, 15:315-329.
20. Allen DD, Ni P, Haley SM: Efficiency and sensitivity of multidimensional
computerized adaptive testing of pediatric physical functioning. Disabil
Rehabil 2008, 30:479-484.
21. Reckase MD: Unifactor latent trait models applied to multifactor test:
results and implications. Journal of Statistics 1979, 4:207-230.
22. Rebollo P, García-Cueto E, Zardain PC, Cuervo J, Martínez I, Alonso J, et al:
[Development of the CAT-Health, the first Adaptive Computerized Test
(CAT) for the evaluation of Health-Related Quality of Life in Spain. Med
Clin (Barcelona) 2009, 133:241-251.
23. Vilagut G, Valderas JM, Ferrer M, Garin O, Lopez-Garcia E, Alonso J:
[Interpretation of SF-36 and SF-12 questionnaires in Spain: physical and
mental components]. Med Clin (Barc) 2008, 130:726-735.
24. Gandek B, Ware JE, Aaronson NK, Apolone G, Bjorner JB, Brazier JE, et al:
Cross-validation of item selection and scoring for the SF-12 Health
Survey in nine countries: results from the IQOLA Project. International
Quality of Life Assessment. J Clin Epidemiol 1998, 51:1171-1178.
25. Vilagut G, Ferrer M, Rajmil L, Rebollo P, Permanyer-Miralda G, Quintana JM,
et al: [The Spanish version of the Short Form 36 Health Survey: a decade
of experience and new developments.]25. Gac Sanit 2005, 19:135-150.
26. Badia X, Alonso J: Validity and reproducibility of the Spanish Version of
the Sickness Impact Profile. J Clin Epidemiol 1996, 49:359-365.
27. Schrag A, Selai C, Jahanshahi M, Quinn NP: The EQ-5D–a generic quality
of life measure-is a useful instrument to measure quality of life in
patients with Parkinson’s disease. J Neurol Neurosurg Psychiatry 2000,
69:67-73.
28. Brazier J, Roberts J, Tsuchiya A, Busschbach J: A comparison of the EQ-5 D
and SF-6 D across seven patient groups. Health Econ 2004, 13:873-884.
29. Cohen J: Statistical Power Analysis for the Behavioral Sciences. second edition.
Lawrence Erlbaum Associates; 1988.
30. Fryback DG, Palta M, Cherepanov D, Bolt D, Kim JS: Comparison of 5
health-related quality-of-life indexes using item response theory
analysis. Med Decis Making 2010, 30:5-15.
31. Kim-Kang G, Weiss DJ: Adaptive Measurement of Individual Change.
Journal of Psychology 2008, 216:49-58.
doi:10.1186/1477-7525-8-147
Cite this article as: Rebollo et al.: Validation of a computer-adaptive test
to evaluate generic health-related quality of life. Health and Quality of
Life Outcomes 2010 8:147.
Rebollo et al. Health and Quality of Life Outcomes 2010, 8:147
/>Page 8 of 8