báo cáo khoa học:" Predialysis therapeutic care and health-related quality of life at dialysis onset (The pharmacoepidemiologic AVENIR study)" ppsx
Bạn đang xem bản rút gọn của tài liệu. Xem và tải ngay bản đầy đủ của tài liệu tại đây (298.4 KB, 8 trang )
RESEARCH Open Access
The effect of time of onset on community
preferences for health states: an exploratory study
Eve Wittenberg
Abstract
Background: Health state descriptions used to describe hypothetical scenarios in community-perspective utility
surveys commonly omit detail on the time of onset of a condition, despite our knowledge that among patients
who have a condition, experience affects the value assigned to that condition. The debate regarding whose values
to use in cost utility analysis is based in part on this observed difference between values depending on the
perspective from which they are measured. This research explores the effect on community preferences for
hypothetical health states of including the time of onset of a heal th condition in the health state description, to
investigate whether this information induces community respondents to provide values closer to those of patients
with experience with a condition. The goal of the research is to bridge the gap between patient and community
preferences.
Methods: A survey of community-perspective preferences for hypothetical health states was conducted among a
convenience sample of healthy adults recruited from a hospital consortium’s research volunteer pool. Standard
gambles for three hypothetical health states of varyin g severity were compared across three frames describing
time of onset: six months prior onset, current onset, and no onset specified in the description. Results were
compared within health state across times of onset, controlling for respondent characteristics known to affect
utility scores. Sub-analyses were conducted to confirm results on values meeting inclusion criteria indicating a
minimum level of understanding and compliance with the valuation task.
Results: Standard gamble scores from 368 completed surveys were not significantly different across times of onset
described in the health state descriptions regardless of health condition severity and controlling for respondent
characteristics. Similar results were found in the subset of 292 responses that excluded illogical and invariant
responses.
Conclusions: The inclusion of information on the time of onset of a health condition in community-perspective
utility survey health state descriptions may not be salient to or may not induce expression of preferences related
to disease onset among respondents. Further research is required to understand community preferences regarding
condition onset, and how such information might be integrated into health state descriptions to optimize the
validity of utility data. Improved understanding of how the design and presentation of health state descriptions
affect responses will be useful to eliciting valid preferences for incorporation into decision making.
Background
As demands to improve efficiency of health care expen-
ditures increase, valid and accurate measures of the
effectiveness of health interventions are becoming
increasingly important [1]. Primary among such mea-
sures are health utilities, the basis for quality adjusted
life years (QALYs) [2]. Methods of measuring health
utilitieshavebeenevolvingsincetheywereoriginally
proposed by von Neumann and Morgenst ern [3], wit h
improvements, refinements and adaptations occupying
investigators from psychology to economics [4]. This
paper addresses one specific aspect of utility elicitation,
the time of onset of il lness, and how its inclusion in
health state descriptions developed specifically for the
elicitation of community perspective preferences affects
the articulation of those preferences. The goal of the
study was to illuminate utility survey design elements
Correspondence:
Heller School for Social Policy and Management, Brandeis University,
Waltham, MA
Wittenberg Health and Quality of Life Outcomes 2011, 9:6
/>© 2011 Wittenberg; licensee BioMed Central Ltd. This is an Open Access article distributed under the terms of the Creative Commons
Attribution License (http: //creativecommons.org/licenses/by/2.0), which permits unrestricted use, distribution, and reproduction in
any medium, provided the original work is properly cited.
underlying well-documented differences between patient
and community-perspective values.
A health state may be defined as an event that begins
with an occurrence, sometimes develops and changes
over time, and usually has a resolution, includi ng death.
Acute states have a short time span from beginning to
end while chronic states t ake many turns over long
duration from start to finish. Quality adjusted life years
incorporate the duration of each ph ase of an illness into
a calculation that results in the overall value of the
course of disease, including changes in severity and
quality of life over time. A specific health state occurring
at one point in time during the course of a n illness or
health condition is valued through the utility assigned to
that state, and duration is incorporated into the QALY
calculation through a multiplication of time (duration)
and utility.
It may be, however, that individuals’ utility for a cer-
tain state depends both on when that state began and
how long it persists (as well as what preceded and fol-
lows it). When it began, or time of onset, may deter-
mine the level o f adaptation that the individual is
experiencing at the point in time that the health state is
occurring, with greater time since onset often indicating
greater adaptation to a state and hence higher utility
[5,6]. In addition, it may be that the transition from
healthy to ill, meaning the time surrounding the onset
of a disease or condition, infers a transition process that
has an altogether different utility value from that
assigned to a state once it has been underway for some
period of time. Hence health states of recent occurrence
may include this transition factor in their utility while
those of longer time since inception may not. States of
longer duration may instead include emotional elements
associated with the passage of time, including hope, des-
pair, and inference of prognosis. In all, the time of onset
of an illness or condition may affect the utility assigned
to a particu lar state separate from the time-independent
assessment of the state.
Experienced utilities, meaning those elicited from
persons who have a particular condition (i.e., “patient-
perspective” utilities) likely i ncorporate these and per-
haps other elements of value in the scores assigned to
them. Community-perspective utilities d o not benefit
from experience with a state, and therefore rely on the
info rmation provi ded in de scriptions used in the elicita-
tion process to convey all aspects of value re lated to a
condition [6,7]. Time since onset is generally not
included in the health state descriptions used in
community-perspective utility surveys, suggesting a
potential bias of omission.
In the elicitation of community-perspective utilities,
those preferred for cost-effectiveness analysis [8], the ques-
tion arises of whether these elements that accompany the
patient-perspective are salient or can be incorporated into
elicited values, or both, and by what mechanism thi s can
be achieved. This paper addresses the specific question of
how the statement of disease onset affects utility values for
hypothetical states evaluated by community members:
whether the general practice of omitting this information
from health state descriptions biases utility scores by omit-
ting details that would otherwise be informative to com-
munity-perspective evaluations. To an inexperienced (i.e.,
community) evaluator, the time of on set of a condition
may imply adaptation to disease, the fear of transi tion to
dis ease, or the dread and hopelessness that accompanies
long-term illness. While descriptors used in community-
perspective valuations that increase the accuracy of health
state descriptions are desirable, time of onset is not usually
mentioned in utility surveys. This study attempted to
integrate information on the experience with a condition
into hypothetical health state descriptions in order to
allow community-perspe ctive respondents to use this
information in their valuations. We hypothesized that the
inclusion of time of onset information in community-
perspective surveys would allow respondents to incorpo-
rate coping, adjustment, and affective components of fear,
hope and dread into their valuations and therefore more
closely parallel an experienced (patien t) perspective. Our
goal was to inform the design of utility surv eys and the
interpretation of results.
Methods
Design
We conducted a cross-sectionalutilitysurveyofcom-
munity members for hypothetical health stat es with a
three-part split sample by time of onset of the condi-
tions. Each respondent valued the same three hypotheti-
cal health states using the standard gamble, with their
randomly assigned onset frame. The three states
described different levels of disability, including mild,
moderate and severe, in terms of a generic, unspecified
disease described using the forma t of the Quality of Life
Index (five dimensions of health (ability to w ork, self
care, energy l evel, social support, anxiety/depression),
each of which is described in one of three levels of
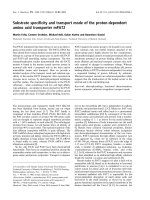
severity [9]; Figure 1). The three randomly-assigned
onset frames were described as follows: one-third were
told that each of the three health states commenced six
months prior ("prior onset” ), one-third were told they
began one week ago ("current onset”), and one-third
were presented with the descriptions with no a dditional
information about their time of onset ("unspecified
onset”).
The survey was administered over the internet, with
recruited participants directed to the web site and all
answers provided anonymously. The standard gamble
(SG) was presented in iterative form using a bisection
Wittenberg Health and Quality of Life Outcomes 2011, 9:6
/>Page 2 of 8
pattern with endpoints of d ead and perfect health. Both
numerical probabilities and visual aids were presented
for the gamble, and up to two repeats of the SG
response were permitted and the f inal answer was used
for analyses. The study was approved by the Institu-
tional Review Board of Partners Healthcare System.
Sample
A community sample was approximated by employing a
sampling frame developed from a pre-existing volunteer
pool of individuals recruited for clinical research by a
major hospital consortium in the Boston, MA area.
Names and either electronic or postal mail addresses of
individuals who self-identified as “healthy volunteers”
were maintained by the hospital, and recruitment mes-
sages were sent by the respondent’s preferred method of
contact. Recruitment was conducted by a hospital inter-
mediary to maintain participant anonymity, and informa-
tiononundeliveredmailwasnotprovidedtothe
investigator. Respondents were invited to visit a website
for the survey only once to minimize respondent recruit-
ment burden. The study was designed to recruit 40
respondents per time of onset group, or 120 respondents
in total, which would provide 80% power to detect differ-
ences in mean utility scores between groups of 0.13,
based on 5% significance and an expected standard devia-
tion in mean utility score of 0.2. Utility scores are highly
variable and a difference of 0.15 or more between groups
would be considered a meaningful difference [10]. In fact,
recruitment exce eded expectations and the resulting
sample was far larger, resulting in greater power to detect
differences between groups.
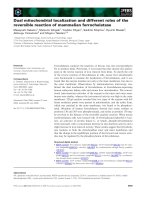
Ti
me of onset
d
escr
i
pt
i
on
(
ran
d
om
i
ze
d
across respon
d
ents; prece
d
e
d
eac
h
scenar
i
o
d
escr
i
pt
i
on
)
:
Current onset
: “You have had a sudden onset of a health condition that just developed in
the last week. You describe your health as follows:”
Prior onset
: “You developed a health condition six months ago. You describe your healt
h
as follows:”
Unspecified onset
: “You describe your health as follows:”
Scenario A (“mild”):
You need a lot of help to work full time or manage household, or only work part time,
You are able to eat, wash, etc. and drive car without assistance,
You lack energy some of the time,
You receive only limited support from family and/or friends,
You are sometimes troubled, anxious and depressed.
Scenario B (“moderate”):
You need a lot of help to work full time or manage household, or only work part time,
You can travel and perform daily activities only with assistance but cannot perform light
tasks around the house,
You feel very ill or “lousy” most of the time,
You receive only limited support from family and/or friends,
You feel frightened and completely confused about things in general.
Scenario C (“severe”):
You are not able to work in any capacity,
You are confined to your home or an institution and cannot manage personal care or light
tasks at all,
You feel very ill or “lousy” most of the time,
You receive almost no support from family and/or friends,
You feel fri
g
htened and completel
y
confused about thin
g
s in
g
eneral.
Figure 1 Health state scenario descriptions.
Wittenberg Health and Quality of Life Outcomes 2011, 9:6
/>Page 3 of 8
Analysis
The analysis focused on identifying any potential effect
of time of onset on community values for the health
states. Both the entire survey sample and a subset of
individuals who met criteria indicating a minimum level
of understanding and compliance with the valuation
task were used for analysis. Descriptive statistics were
calculated to characterize the sample and the utility
scores provided for the three different hypothetical
health states. Regression models were built to test two
hypotheses regarding the effect of time of onset on com-
munity-perspective SG scores for hypothetical states:
(1) that prior onset conditions would be valued higher
than current on set conditions, and (2) that the inclusion
of a specified onset in the description, either current or
prior, would be valued differently than no information
regarding onset (i.e., unspecified onset).
A subset analysis based on response criteria was con-
ducted to explore the stability of the main analysis
results when potentially questionable survey results were
excluded. The exclusion of illogical and “non-trader”
(i.e., invariant) responses from utility surveys has been
debate d in the field, with som e suggesting that omission
increases the validity of results [11-13]. We therefore
conducted our analyses including and excluding these
responses to provide confirmation of our results. Our
inclusion criteria w ere logic and variance: logical
responses were those in which the SG value for the
mild state was greater than that for the moderate state,
which was greater than that for the severe state. Illogical
responses violate this ordering and su ggest miscompre-
hension of the valuation task or confusion. Responses
demonstrating variance were those in which at least one
SG score was di fferent than others, in contrast to invar-
iant responses in which the same score is given for
every state. Such responses are often considered “pro-
test” responses in which the respondent is a verse to the
premise of the valuation task and therefore refuses to
trade any risk of death for improved health, or are
expressions of extreme risk aversion or a lack of sensi-
tivity of the instrument [11,14,15]. Both illogical and
invariant responses may introduce noise or bias into
results.
Generalized linear modeling was used to analyze the
entire sample and the logical/variant subsample. A model
was built for each of the three health states: the depen-
dent variable was the SG score and the main independent
variable was the time of onset frame. Time of onset was
coded as three dummy variables, “unspecified onset,”
“prior on set” and “cu rrent onset,” with prior as the refer-
ence group to test the hypothesis that prior > current
and unspecified as the reference group to test the
hypothesis that unspecified ≠ current or prior. Covariates
believed a priori to affect valuations were included in the
models as control variables, including age (continuous),
education (college or higher education versus less),
gender (female versus male), race (white versus all other),
health status (categorical with 1 = excellent and higher
values = worse health status), religiosity (identify as reli-
gious versus do not), and dependent children (childre n <
18 years in household versus not). Statistical significance
was assessed w ith two-sided tests and p-values of 0.05.
Analyses were conducted using SAS version 9.2 (SAS
Institute, Cary, NC).
Results
A total of 8,380 volunteer names were identified in the
hospital database and used for re cruitment. Six hundred
and twenty-one visits to the web site resulted in 368
complete responses, of which 292 met logic and var-
iance criteria for inclusion in the subset analysis.
Respondents w ere primarily female (76%), white (88%),
and well-educated (72% completed college or higher
education), with a mean age of 40 years (Table 1). Com-
pared with the US popula tion, the study sample con-
tained more women, more white and fewer black
individuals, more individuals with high educational
attainment, more middle-income-level individuals, and
fewer individuals who identified as religious. Of all
respondents with complete data, 26 reported SG scores
that were all equal (i.e., were invariant), and 50 reported
SG scores that were illogica l, for a total of 76 who were
excluded from the subset analysis. Respondents included
in the subset sample were slightly younger, more edu-
cated, less religious, and more often white than those in
the entire survey sample (Table 1).
Mean standard gamble scores for the health states
decreased as the severity of the states increased, in both
the entire sample a nd the subsample (Table 2). Mean
scores for the mild state ranged from 0.84-0.86 for the
complete sample and the subsample, 0.68-0.67 fo r the
moderate state, and 0.45-0.38 for the severe state,
respectively. In adjusted analyses, SG scores were not
significantly affected by the added description of time of
onset to the health state scenario compared with omis-
sion of this information, with the exception of the mild
health state in the logical/variant subsample (Table 2).
For this state, SG scores were slightly lower for those
respondents for whom the state was described as begin-
ning 6 months prior ("prior onset” )comparedwith
respondents who were given no indication of the time
of onset (regression coefficient = -0.07, 95% CI = [-0.13,
-0.01]). For all states and samples, t here was no signifi-
cant difference between states described as prior onset
comp ared with th ose described as current onset (results
not shown). Age was the only res pondent characteristic
that had a consistently significant association with SG
scores, with increased age associated with lower scores
Wittenberg Health and Quality of Life Outcomes 2011, 9:6
/>Page 4 of 8
across health state severity and sample. The presence of
dependent children in the household was associated
with higher scores for the mild health state in both sam-
ples (Table 2).
Discussion
Utility measurement is a fundamentally complex task,
both for investigators designing tools and respondents
providing values [16]. In the context of eliciting commu-
nity-perspective preferences for hypothetical health
states, the way in which a health state is described can
have substantial impact on how a state is valued [17], as
can the valuation technique used [8]. This research
explored one specific element of the health state descrip-
tion for the valuation of hypothetical states, how the tim-
ing of the health state’ s occurrence is described, a nd
specifically, whether the time of onset is included in the
description and whether that onset was recent. This
question ad dresses the kno wn distinction between
patient and community-perspective values for the same
health state by a ttempting to decipher the inferred
meaning of omitted health state description information
in community-perspective valu ations. Time of onset of a
condition may infer adaptationtodisease,thetransition
between healthy and ill, and affective states such as hope-
less and despair associated with long-term conditions.
These elements may contribute to the observed differ-
ence in values between patient and community perspec-
tive values, and hence the inclusion of this information in
hypothetical health state descriptions may increase
understanding of the condition for individuals lacking
experience with it. While exploratory, this research found
that the inclusion of this detail in health state descrip-
tions did not have a measureable effect on the values pro-
vided, even when excluding utility survey responses that
demonstrate elements of misunderstanding or miscom-
prehension, a procedure likely to improve the validity of
results. We speculate that the common practice of omit-
ting time of onset in descriptions of health state scenarios
for the elicitation of commun ity-perspective utilities may
not induce bias into results, either because such informa-
tion is not salient to community values or that the
Table 1 Sample characteristics and US population comparison
All survey respondents n = 368 Logical, variant subset n = 292 US population 2000-2008 estimates
No.(%) No.(%) % (source)
Age, years (mean, sd) 39.5 (14.7) 38.0 (14.5) 36.6 [22]
Female 279 (76%)
1
222 (76%) 50.7% [23]
Race
White 322 (88%) 263 (90%) 79.8% [23]
Black/African American 23 (6%) 13 (4%) 12.8%
Asian 8 (2%) 8 (3%) 4.5%
Other races/multiracial 15 (4%) 8 (3%) 2.9%
Education
High school or less 11 (3%)
1
2 (1%) 45.2% [23]
Some college 91 (25%) 66 (23%) 27.9%
4-year college graduate 93 (25%) 81 (28%) 17.8%
More than college 173 (47%) 142 (49%) 9.1%
Annual household income
<$25,000 52 (14%)
1
38 (13%) 24.8% [24]
≥$25,000 and <$50,000 113 (31%) 92 (32%) 24.9%
≥$50,000 and <$100,000 121 (34%) 96 (34%) 29.9%
≥$100,000 73 (21%) 59 (21%) 20.5%
Children < 18 years in household 123 (33%) 86 (29%) 50% [25]
Religious (yes) 205 (56%)
1
151 (52%) 85% [26]
Health status
Excellent 80 (22%) 68 (23%) 35% [27]
Very good 172 (47%) 138 (47%) 30%
Good 97 (26%) 73 (25%) 24%
Fair 19 (5%) 13 (4%) 7%
Poor 0 0 2%
No = number; sd = standard deviation.
Percentages may not sum to 100 due to rounding.
1
Missing items from respondents: 1 respondent skipped gender question, 1 skipped education question, 2 skipped religion question, and 9 skipped income
question.
Wittenberg Health and Quality of Life Outcomes 2011, 9:6
/>Page 5 of 8
inferred information used by respondents is already accu-
rate. In either case, we cannot provi de evidence from this
study in favor of inclusion or exclusion and suggest
further exploration of these preference elements.
Our results suggest a number of hypotheses about the
community-perspective utility elicitation process that
may be useful for preference assessment methods. First,
it may be that time of onset is not salient to commu-
nity-perspective survey respondents when face d with a
utility survey of average complexity. Survey elements or
formats specifically designed to focus attention or con-
sideration on onset were intentionally omitted from this
survey to mim ic conventional survey design. Attention
may have to be drawn specifically to time of onset for
respondents to consider this in valuations. Further
research could explore whether increased attention
alters values.
Second, community members may recognize d iffer-
ences in onset, but may not be able to forecast differ-
ences in valuation depending on e xperience with a state
or adaptation, and hence may genuinely value states of
different onset similarly [18,19]. There is contradictory
evidence in the literature regarding the relative value of
states of different onset, but supportive of respondents’
ability to distinguish across timing and to assign value.
Damschroeder and others compared “pre-existing” and
“new onset” conditions and found the “new onset” condi-
tions were valued l ower (i.e., worse) in person trade-offs
[5]. These comparative results imply that survey respon-
dents may anticipate adapt ation to disease that occurs
with pre-existing conditions, or may otherwise believe
that newly-occurring conditions are worse than those
that have existed over time. On the other hand, Lieu and
others found evidence that recent onset conditions were
inferred as temporary and thus possibly better (i.e., less
negative) than those that are permanent [20]. Some of
our data support the hypothesis that long-term condi-
tions are worse to endure rather than better, as indicated
by the negative premium placed on prior onset for mild
conditions in our subset analysis. This finding runs coun-
ter to the prevailing notion of adaptation to disease that
is observed among patient-perspective valuations.
Table 2 Generalized linear model predicting standard gamble scores by health state severity, all respondents and
subset meeting logic and variance criteria: regression coefficients and 95% confidence intervals
Mildly severe state Moderately severe state Severe state
Variable estimate (95% CI) estimate (95% CI) estimate (95% CI)
All respondents (n = 368; current onset n = 122, prior onset n = 117, unspecified onset n = 129)
Mean(sd) = 0.84(0.25) Mean(sd) = 0.68(0.32) Mean(sd) = 0.45(0.37)
Time of onset*:
Prior -0.05 (-0.12, 0.01) -0.07 (-0.15, 0.01) -0.09 (-0.18, 0.01)
Current -0.01 (-0.08, 0.05) -0.03 (-0.11, 0.05) -0.05 (-0.14, 0.04)
Health status 0.01 (-0.02, 0.05) 0.00 (-0.05, 0.04) -0.03 (-0.08, 0.01)
Age (years) -0.003 (-0.005, -0.001) -0.004 (-0.006, -0.001) -0.002 (-0.005, 0.001)
White race 0.01 (-0.07, 0.09) -0.04 (-0.14, 0.06) -0.15 (-0.26, -0.03)
Female 0.02 (-0.05, 0.08) 0.00 (-0.04, 0.10) 0.01 (-0.08, 0.10)
Dependent children 0.11 (0.05, 0.18) 0.06 (-0.03, 0.14) 0.03 (-0.06, 0.13)
College educated 0.04 (-0.02, 0.10) -0.03 (-0.11, 0.04) -0.05 (-0.03, 0.04)
Religious 0.0 (-0.05, 0.05) 0.03 (-0.04, 0.10) 0.07 (-0.01, 0.14)
Logical, variant subset (n = 292; current onset n = 100, prior onset n = 93, unspecified onset n = 99)
Mean(sd) = 0.86(0.21) Mean(sd) = 0.67(0.30) Mean(sd) = 0.38(0.33)
Time of onset*:
Prior -0.07 (-0.13, -0.01) -0.04 (-0.13, 0.04) -0.07 (-0.17, 0.02)
Current -0.02 (-0.08, 0.04) -0.00 (-0.09, 0.08) -0.04 (-0.14, 0.05)
Health status 0.01 (-0.02, 0.04) -0.01 (-0.05, 0.04) -0.06 (-0.10, -0.01)
Age (years) -0.002 (-0.004, -0.000) -0.004 (-0.007, -0.002) -0.006 (-0.009, -0.003)
White race 0.03 (-0.05, 0.12) -0.05 (-0.17, 0.07) -0.04 (-0.17, 0.08)
Female 0.00 (-0.06, 0.06) 0.01 (-0.08, 0.09) -0.03 (-0.12, 0.06)
Dependent children 0.08 (0.01, 0.15) 0.04 (-0.05, 0.14) 0.05 (-0.05, 0.15)
College educated -0.03 (-0.10, 0.03) -0.04 (-0.13, 0.05) -0.03 (-0.13, 0.06)
Religious -0.01 (-0.06, 0.04) 0.03 (-0.04, 0.10) 0.02 (-0.06, 0.09)
* No time of onset specified (“unspecified onset”) is reference.
CI = confidence interval; sd = standard deviation.
Bold = significant at p ≤ 0.05.
Wittenberg Health and Quality of Life Outcomes 2011, 9:6
/>Page 6 of 8
Anecdotal evidence from commentary provided in our
survey suggested that some respondents associated prior
onset with increased hopelessness and dread, and there-
fore assigned lower utilities to pre-existing conditions. In
sum, while patient-perspective utilities generally demon-
strate adaptation to disease, community-perspective
values show more varied response to the i nclusion of
health state descriptors that approximate longer-term
conditions, such as prior onset a nd pre-existing condi-
tions, and it is not yet clear whether adaptation can or is
incorporated into community-perspective values elicited
using hypothetical health state descriptions.
An alternative explana tion for a difference in values
due to time of onset is that the actual transition
between healthy and i ll represents an immediate loss i n
health that individuals value disproportionately nega-
tively, as posited by prospect theory [21]. This hypoth-
esis would be supported by lower scores for current
compared with prior onset condition s, which was not
seen in our data but was supported by Damschroeder’s
findings [5]. The literature confirms that time of onset
has an effect on values among some community-
perspective respondents using some measurement
techniques, so is clearly an important element of the
elicitation task. Our results add to this debate but do
not offer conclusive evidence for or against the inclusion
of time of onset in descriptions. Further research into
the cognitive mechanisms underlying the d istinctions in
processing or assessment of health state descriptions
may illuminate the optimal elements to be included in
health state descriptions.
Though suggestive of areas for further research and
hypotheses, our results should of course be considered
exploratory in nature due to acknowledged limitations
in our design and sample. We attempted t o mimic typi-
cal utility survey design in question framing, and to pro-
vide decision-support through warm-up questions,
opportunities to revise answers and visual aids, but in
doing so did not specifically draw respondents’ attention
to the time of onset element of the descriptions. Our
intent was to study utility elicitation as it is currently
conducted, and provide insight into the conventional
process. Our approach may have sacrificed measurement
precision for practical applicability. Moreover, we used
internet administration for our survey because of its
convenience and the increasing reliance on this mode in
the utility measurement field. Internet format allows
respondents to proceed at their desired pace through
the survey, but as a self-administered format, may per-
mit inattention to details compared with in-person
administration. And finally, our sample was selected of
convenience, and while typical of internet survey sam-
ples, was substantially different from the US population
on factors that affect preferences and utility responses
(such as education). We do not know whether the
observed sample differences are relevant to how indivi-
duals consider onset of disease in preferences, or
whether other, unobserved differences with our sample
relative to the US population have biased our results.
Our results should be considered as informative for sur-
vey design rather than definitive regarding the inclusion
of onset information in health state description.
Conclusion
In conclusion, the goal of this paper was to motivate
additional exploration of how communit y-perspective
respondents assign value to transitioning into a health
state versus l iving in it over time, and how timing of
health states’ occurrence are reflected in values for
hypothetical health state descriptions. These elements of
disease are important to patients’ decisio n making but
may be overlooked by traditional community-perspective
utility elicitation techniques that ignore onset, and by
impl ication the transition between states. Perfecting our
methods of community-perspective preference assess-
ment will provide a stronger and more valid basis for
evaluations that depend on these inputs, and lead to
improved analyses and hence decision making.
Acknowledgements
Research conducted in part at Massachusetts General Hospital, Boston, MA,
USA. This project was supported by grant number 7 K02 HS014010 from the
Agency for Healthcare Research and Quality. The funding agreement
ensured the independence of the work. Preliminary results from this study
were presented at the 29
th
Annual Meeting of the Society for Medical
Decision Making, October, 2007, Pittsburgh, PA.
The author is grateful to Joey Kong, PhD and Romona Rhodes, MA for
extensive programming assistance, and to Melissa Gardel for assistance with
data coding and analysis, and interviewing. Appreciation is also extended to
the individuals participating in the Partner’s Healthcare RSVP for Health
volunteer pool who responded to the survey. And finally, Lisa Prosser, PhD
provided helpful comments on an earlier version of this paper.
Competing interests
The authors declare that they have no competing interests.
Received: 8 September 2010 Accepted: 20 January 2011
Published: 20 January 2011
References
1. Institute of Medicine: Initial National Priorities for Comparative
Effectiveness Research. Institute of Medicine of the National Academies:
Washington, DC; 2009.
2. Drummond M, Sculpher M, Torrance G, et al: Methods for the Economic
Evaluation of Health Care Programmes. New York: Oxford University
Press;, 3 2005.
3. von Neumann J, Morgenstern O: Theory of Games and Economic
Behavior. Princeton, NJ: Princeton University Press; 1947.
4. Miller W, Robinson L, Lawrence R, eds: Valuing Health for Regulatory Cost-
Effectiveness Analysis. The National Academies Press: Washington, DC;
2006.
5. Damschroeder L, Zikmund-Fisher B, Ubel P: The impact of considering
adaptation in health state valuation. Soc Sci Med 2005, 61(267-77).
6. Ubel P, Lowenstein G, Jepson C: Whose quality of life? A commentary
exploring discrepancies between health state evaluations of patients
and the general public. Qual Life Res 2003, 12:599-607.
Wittenberg Health and Quality of Life Outcomes 2011, 9:6
/>Page 7 of 8
7. Stiggelbout A, de Vogel-Voogy E: Health state utilities: a framework for
studying the gap between the imagined and real. Value in Health 2008,
11(1):76-87.
8. Gold M, Patrick D, Torrance D, et al: Identifying and Valuing Outcomes. In
Cost-effectiveness in Health and Medicine. Edited by: Gold M. Oxford
University Press: New York; 1996:82-134.
9. Spitzer W, Dobson A, Hall J: Measuring the quality of life of cancer
patients. A concise QL-Index for use by physicians. J Chronic Disease
1981, 34:585-97.
10. Wyrwich KW, Bullinger M, Aaronson N, et al: Estimating clinically
significant differences in quality of life outcomes. Qual Life Res 2005,
14(2):285-95.
11. Craig B, Ramachandran S: Relative risk of a shuffled deck: a generalizable
logical consistency criterion for sample selection in health state
valuation studies. Health Econ 2006, 15(8):835-48.
12. Lenert L, Sturley A, Rupnow M: Toward improved methods for
measurement of utility: automated repair of errors in elicitations. Med
Decis Making 2003, 23:67-75.
13. Lenert L, Treadwell J: Effects on preferences of violations of procedural
invariance. Med Decis Making 1999, 19(4):473-81.
14. Fowler F, Cleary P, Massagli M, et al: The role of reluctance to give up life
in the measurement of the values of health states. Med Decis Making
1995, 15:195-200.
15. Rutten-van Molken M, Bakker C, van Doorslaer E, et al: Methodological
issues of patient utility measurement. Experience from two clinical trials.
Med Care 1995, 33(9):922-37.
16. Fischhoff B: Value elicitation Is there anything there? Amer Psychologist
1991, 46(8):835-47.
17. Tversky A, Kahneman D: The framing of decisions and the psychology of
choice. Science 1981, 211(4481):453-8.
18. Ubel P, Lowenstein G, Jepson C: Disability and sunshine: can hedonic
predictions be improved by drawing attention to focusing illusions or
emotional adaptation? Journal of Experimental Psychology: Applied 2005,
11(2):111-23.
19. Ubel P, Lowenstein G, Schwarz N, et al: Misimagining the unimaginable:
the disability paradox and health care decision making. Health Psychol
2005, 24(4 Suppl):S57-S62.
20. Lieu T, Ortega-Sanchez I, Ray G,
et al: Community and patient values for
preventing herpes zoster. Pharmacoeconomics 2008, 26(3):235-49.
21. Kahneman D, Tversky A: Prospect theory: an analysis of decision under
risk. Econometrica 1979, 47:263-91.
22. US Census Bureau: Resident Population Estimates of the United States by
Sex, Race, and Hispanic Origin: April 1, 1990 to July 1, 1999. 2001
[ cited
2010 January 4.
23. US Census Bureau: State and County Quick Facts. 2009
[ cited 2010 January 4.
24. US Census Bureau: Annual Social and Economic Supplement. Current
Population Survey 2008 [ />032009/hhinc/new06_000.htm], cited 2010 January 4.
25. US Census Bureau (b): America’s Families and Living Arrangements: 2008.
2008 [ />html], cited 2010 January 4.
26. US Census Bureau (b): The 2010 Statistical Abstract: The National Data
Book. 2009 [ cited 2010 January
4.
27. Centers for Disease Control and Prevention, Summary Health Statistics for
the U. S.: Population: National Health Interview Survey, 2008. Vital and
Health Statistics Hyattsville, MD; 2009.
doi:10.1186/1477-7525-9-6
Cite this article as: Wittenberg: The effect of time of onset on
community preferences for health states: an exploratory study. Health
and Quality of Life Outcomes 2011 9:6.
Submit your next manuscript to BioMed Central
and take full advantage of:
• Convenient online submission
• Thorough peer review
• No space constraints or color figure charges
• Immediate publication on acceptance
• Inclusion in PubMed, CAS, Scopus and Google Scholar
• Research which is freely available for redistribution
Submit your manuscript at
www.biomedcentral.com/submit
Wittenberg Health and Quality of Life Outcomes 2011, 9:6
/>Page 8 of 8