báo cáo khoa học:" Evaluating oral health-related quality of life measure for children and preadolescents with temporomandibular disorder" potx
Bạn đang xem bản rút gọn của tài liệu. Xem và tải ngay bản đầy đủ của tài liệu tại đây (337.35 KB, 9 trang )
RESEARCH Open Access
Are patients’ judgments of health status really
different from the general population?
Paul FM Krabbe
1*
, Noor Tromp
2
, Theo JM Ruers
3
and Piet LCM van Riel
4
Abstract
Background: Many studies have found discrepancies in valuations for health states between the general
population (healthy people) and people who actually experience illness (patients). Such differences may be
explained by referring to various cognitive mechanisms. However, more likely most of these observed differences
may be attributable to the methods used to measure these health states. We explored in an experimental setting
whether such discrepancies in values for health states exist. It was hypothesized that the more the measurement
strategy was incorporated in measurement theory, the more similar the responses of patients and healthy people
would be.
Methods: A sample of the general population and two patient groups (cancer, rheumatoid arthritis) were included.
All three study groups judged the same 17 hypothetical EQ-5D health states, each state comprising the same five
health domains. The patients did not know that apart from these 17 states their own health status was also
included in the set of states they were assessing. Three different measurement strategies were applied: 1) ranking
of the health states; 2) placing all the health states simultaneously on a visual analogue scale (VAS); 3) separately
assessing the health states with the time trade-off (TTO) technique. Regression analyses were performed to
determine whether differences in the VAS and TTO can be ascribed to specific health domains. In addition, effect
of being member of one of the two patient groups and the effect of the assessment of the patients’ own health
status was analyzed.
Results: Except for some moderate divergence, no differences were found between patients and healthy people
for the ranking task or for the VAS. For the time trade-off tech nique, however, large differences were observed
between patients and healthy people. The regression analyses for the effect of belonging to one of the patient
groups and the effect of the value assigned to the patients’ own health state showed that only for the TTO these
patient-specific parameters did offer some additional information in explaining the 17 hypothetical EQ-5D states.
Conclusions: Patients’ assessment of health states is similar to that of the general population when the judgments
are made under conditions that are defended by modern measurement theory.
Introduction
Health status or health-related quality of life (HRQoL)
can be measured by two distinct methods. The first pro-
duces descriptive profile measures encompassing multi-
ple health domains. Examples of descriptive health
measurement instruments are the SF-36 and, in the field
of cancer, the EORTC QLQ C-30. In the second
method, overall HRQoL is quantified as a single metric
figure. The latter is referred to as a value-based metho-
dology or index approach. Several different techniques
(e.g., standard gamble, time trade-off, visual analogue
scale, discrete choice models) are used to derive such
values (variously called utilities, preferences, strength of
preference, index, or weights).
In sc ie nce it is essential t o focus on two f undament al
measurement properties: reliability and validity. Both are
important, the latter even crucial; valid measurement
implies that health outcome measures are meaningful
and measure what they are supposed to measure. Prefer-
ably, health outcome measur es should also be suited to
computational procedures and statistical testing. For
* Correspondence:
1
Department of Epidemiology, Unit Health Technology Assessment,
University Medical Center Groningen, University of Groningen, Groningen,
The Netherlands
Full list of author information is available at the end of the article
Krabbe et al. Health and Quality of Life Outcomes 2011, 9:31
/>© 2011 Krabbe et al; licensee BioMed Central Ltd. This is an Open Access a rticle distributed under the terms of the Creative Commons
Attribution License (http://crea tivecommons.org/licenses/by/2.0), which pe rmits unrestricted use, distribution, and re prod uction in
any medium, provide d the original work is properly cited.
tha t reason, informative (i.e., metric) outcome measures
should be at least at the interval level. This means that
measures should lie on a unidimensional continuous
scale, whereby the differences between values reflect
true differences (i.e., if a patient’s score increases from
40 to 60, this increase is the same as from 70 to 90).
Such measures can provide vital information for health
outcomes research, economic evaluations, clinical moni-
toring, and disease modeling studies.
Conventionally, the values for different health states
used in economic evaluations are derived from a repre-
sentative community sample [1]. Subjects who value the
hypot hetical health states need not be familiar with spe-
cific illnesses. However, it is reasonable to assume that
in many situations healthy people may be inadequately
informed or lack good imagination to make an appropri-
ate judgment about the impact of (severe) health states.
For this and other reasons it is not surprising that the
field of HRQoL research is engaged in debate about
which values are more valid. Many authors assert that
individuals are the best judges of their own health sta-
tus. Therefore, in a health-care context, it is the patient’s
judgment that should be elicited, not that of a sample of
unaffected members of the general population.
Several investigators have noted that patients who
have experienced a particular health state often assign
higher values to their own state than do members of the
general population for the same state [2-4]. A number
of studies report discrepancies in the values obtained
from patients and the general population [5,6]. Nonethe-
less, a recent meta-analysis demonstrates the absence of
systematic differences [7]. Other studies c onclude that
people attach different values to hypothetical health
states, depending on their own health condition [8,9].
Prominent though not necessarily mutually exclusive
explanations for such discrepancies include ‘adaptation
mechanisms’ [10-12], ‘response shift’ [13,14], ‘cognitive
dissonance’ [15,16], and the implications of ‘pr ospect
theory’ [17]. The most frequent proposition holds that
the difference is largely related to the level of ‘experi-
ence’ of the assessor, implying that adaptation (and
therefore redefinition of what i s good health) comes
with experience.
However, most of these observations are not based on
direct comparisons of patients’ valuations with those of
the general population. Furthermore, many of the
patients in these studies were not confronted with a
variety of health states, ranging from mild to severe, but
were only assessing a few disease-related or treatment-
related health-state outcomes [18-22]. Moreover, in
most of these studies health states were assessed in a
monadic approach. This means tha t health states were
assesses state-by-state. Yet, discrimination is a basic
operation of judgment and of generating knowledge
which explains that the core activity of the quantifica-
tion of subjective phenomena in measurement theory is
to compare two or more entities in such a way that the
data yiel ds compelling i nformation [23-25]. C onse-
quently, much of the observed difference between
patients’ valuations of their own health state and the
values assigned to health states by healthy people may
be attributed to the applied measurement framework.
Our objective was twofold i) to explore in an experi-
mental way whether discrepancies in values for health
states exist between the general population and people
who actually experience specific illness (patients); ii),
whether such discrepancies depends on the applied
measurement approach. It was hypothesized that the
more measurement strategies were supported by mea-
surement theory, the more similar the responses of
patients and healthy people would be.
Methods
Subjects
Two different patient groups from the Radboud Univer-
sity Nijmegen Medical Centre (Netherlands) participated
in the study, which was approved by the Central Com-
mittee on Research Involving Human Subjects (region
Arnhem-Nijmegen). We deliberately selected two
patients groups that were quite different to create a con-
trast in our experimental study. (For that reason back-
ground characteristics are expected to be different and
no statistical adjustments are made for them.) One
group included patients that were diagnosed with cancer
within a time frame of 4-6 weeks before they partici-
pated in the study. Since all cancer patients were
planned to undergo surgery, meaning that the stage of
their disease was comparable, differences in life expec-
tancy were limited. The other group consisted of chroni-
cally ill patients living with the symptoms of rheumatoid
arthritis (RA) for at least 3 years. A ll patients were
approached in the clinic by their physician. Informed
consent was obtained by the physician (TJMR, PLCMR)
and interviewer. Representative general population
(healthy people) data were obtained from a Dutch valua-
tion study in which the principal investigator (PFMK)
participated [26]. In this study with healthy people
exactly the same study protocol was followed as in the
study with the patients, which guaranties that the mea-
surement conditions were similar in the two study
groups. Only the general population group received a
gift voucher worth 20 euros for participation.
Health states
The EuroQol-5D (EQ-5D) classification describes health
status according to five attributes: mobility; self-care;
usu al activities; pain /discomfort and anxiety/depression.
Each attribute has three l evels: level 1 ‘no problems’ ;
Krabbe et al. Health and Quality of Life Outcomes 2011, 9:31
/>Page 2 of 9
level 2 ‘ some problems’;andlevel3‘ severe problems’
[27]. Health-state descriptions are constructed by taking
one level for each attribute, thus defining 243 (3
5
)dis-
tinct health states (’ 11111’ represents the best health
state). A fix set of 17 EQ-5D health-state descriptions
were selected. This set comprised 5 very mild, 4 mild, 4
moderate, and 3 severe states and also state ‘33333’ .
These states were selected on the grounds of the Dutch-
based EuroQol tariff design developed in 2006 [26]. All
EQ-5D health-state descriptions were printed on cards.
Respondents were instructed that for a health state to
be considered unchangeable, it had to persist for ten
years and be followed by dead.
Judgmental tasks
The study protocol was administered face-to-face by a
trained interviewer (NT) at the homes of the patients.
All patients (as well as the general population sample)
assessed the same set of 17 EQ-5D health states by per-
forming the same three judgmental tasks in exactly the
same way. Two weeks in advance (postal), to record
their current health state all patients described their
own health status using the standard EQ-5D classifica-
tion. Additionally, each patient unknowingly assessed his
or her own health status in all three judgmental tasks as
the own EQ-5D health-state description had been incor-
porated i n the set. Instructions were repeated until the
interviewer judged that the respondent understood the
task. For each judgmental tasks all states were presented
in random order to control for potential biases due to
presentation order or respondent fatigue.
Ranking
The first and most elementary judgmental task consisted
of ranking the 17 EQ-5D health states, supplemented
with the patient’ s own EQ-5D description, ‘dead’ ,and
state ‘11111.’ (note: ‘dead’ and ‘11111’ were not judged
in the time trade-off task. See below). This task can be
considered a s tep-by-step paired comparison task, fea-
turing a distinct comparative or discrimination mechan-
ism[28].Eachpatientrankedthesesame20health
states by puttin g the card with the ‘best’ health state on
top and the ‘worst’ at the bottom.
Multi-item visual analogue scale (VAS)
After the ranking task, patients were instructed to place
the 20 cards on the standard EuroQol (multi-item) VAS
(EQ-VAS). T he standard EQ-VAS consists of a 20 cm
thermometer-like vertical line with end-points (anchors)
of 100 for the ‘best imaginable health state’ and 0 for
the ‘worst imaginable health state’. The respondent rates
the desirability of each health state by placing its card at
some point along the scale. This VAS exercise employed
a bisection method [29]. First, the state ranked ‘best’
waslocatedontheVAS,followedbytheoneranked
‘worst ’ , and then the state closest to lying half-way on
the scale (i.e., between the two extreme states already in
place). Subsequently, two states were located between
the half-way sta te and the two extreme states. Finally,
all residual states were located simultaneously on the
VAS. The instruction was to locate the cards in such
way that the intervals between the positions of the
health states corresponded with their perceived differ-
ences. A critical assumption underlying the multi-item
VAS task is that respondents are not only implicitly
comparing health states and making decisions about
which ones are preferable (ranking), but are also adjust-
ing the distances between the array of states in such a
way that the positions reflect the differences in prefer-
ences for these states.
Time trade-off (TTO)
The VAS valuation task was followed by the TTO valua-
tion of the same set of EQ-5D states, except for state
‘1111 1’ and ‘ dead’. These two states cannot be directly
valued, as in TTO their values are pre-assigned to 1 and
0 respectively. TTO requires respondents to trade l ong-
evity for improved health in choices between certain
prospects [30]. T he TTO task was executed by a Com-
puter Assisted Personal Interviewing (CAPI) method.
Computer software integrated the TTO study protocol,
scoring administration, and the visual aid. The program
presented the standardized health states (including the
patient’s health state) in r andom order and re placed the
classic TTO boards of the original UK study protocol
[31]. Respondents were led by a process of outward
titration to select a length of time t in state ‘11111’ (full
health) that they regarded as equivalent to 10 years in
the target state. The shorter the ‘equivalent’ length of
time in full health, the worse the target state is. The
interviewer handled each TTO session by giving instruc-
tions to the respondent and operating the software
buttons.
Analyses
Respondents were excluded if 1) fewer than 3 health
states were valued, 2) all health states were given the
same value, and 3) state 11111 or dead was not valued
or dead > state 11111 [26]. This last exclusio n criterion
was only applied for the VAS. It is necessary when
rescaling “raw” VAS scores to values on the 0 (dead) to
1 (full health) ‘utility’ scale. Rescaling (e.g., calibration)
was performed at the respondent level on the basis of
the observed VAS scores for the various health states,
and the scores that were recorded for “ dead” and “full
health” (e.g., state 11111), using the following equation:
VAS
health state - rescaled
=VAS
health state - raw
− Dead
raw
/
11111
r
aw
− Dead
r
aw.
Krabbe et al. Health and Quality of Life Outcomes 2011, 9:31
/>Page 3 of 9
Transformation of the TTO scores was based on the
standard EuroQol approach. For states regarded as bet-
ter than dead, the TTO value (v) is t/10; for states
worse than dead, values are computed as -t/(10 - t).
These negative he alth states were subsequent ly bounded
at minus 1 with the commonly used transformati on v’ =
v/(1 - v).
Descriptive statistics were calculated for the back-
ground characteristics of the three samples. Then fre-
quency distributions were made for the classification of
the patients’ health state. Mean scores and standard
errors of the mean were calculated for the various
assessments of the (hypothetical) health states. For the
non-patient group, ranks were adjusted for the fact that
this group assessed one health state less (own state)
than the two patient groups. Regression analyses were
performed for the VAS and TTO data to estimate the
effect of the different domains, the effect of being mem-
ber of one of the two patient groups, and the effect of
the assess ment of the patients’ own EQ-5D health state.
In these regression analyses we applied the standard
EuroQol model which is based on variables for the 5
domains (for e ach domain 2 dummies expressing the
step from level 1 to level 2, and the step from level 2 to
level 3) extended with the N3 dummy variable. This N3
parame ter is a nonmultiplicative interaction term that is
frequently used in EuroQol valuation models. It allows
for measuring the “ extra” disutility when reporting
severe (level 3) problems on at least one EQ domain.
All statistical analyses were performed with SPSS (ver-
sion 17.0), the diagrams were drawn with SigmaPlot
(version 11).
Results
Respondents
In total 75 patients were interviewed (approx. 1.5 - 2.5
hours). Of the 50 cancer patients (36 colorectal cancer,
14 breast cancer) approached for participation, 48 gave
their consent (96% response). The RA patients’ response
rate was 75%, with 27 of the 36 patients approached
consenting to participation. Reasons to refuse were ‘not
interested ‘ or ‘no time’. The general population (healthy
people) consists of 212 respondents. The main charac-
teristics of the three samples are presented in Table 1.
The mean ages for the cancer patients and the RA
patients were simi lar (63.1 vs. 64.5). The patients were
on average 20 years older than the general population.
Overall, the RA patients had more problems on all
dimensions except anxiety. For example, 70.4% of the
RA patients reported mobility problems, compared with
only 22.9% of the cancer group. Education levels were
equally distributed in the general population, whereas
for the patient groups the lowest category was over-
represented. Cancer patients showed better EQ-5D
classifications of their own health condition than the RA
patients (Table 2). Almost 80% of the general population
sample had EQ-5D health states with no complaints or
only moderate complaints in one of the five health
domains.
Health state judgments
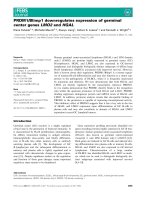
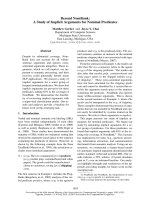
We found almost parallel lines between the three study
groups for the mean ranking scores of the assessed
hypothetical health states (Figure 1A). The patients’ own
state was ranked as less severe than state ‘11312’ by can-
cer patients and as almost comparable to this state by
the RA group. It is also clear that cancer patients and
RA patients ranked state ‘ 21111’ (some mobility pro-
blems) as less severe than healthy people did. In the
compari son of the VAS values, RA patients show a pat-
tern closely resembling the general population (Figure
1B). For the states with only one domain at level 2,
Table 1 Demographic characteristics and health
condition of the study populations
Cancer
patients
(n = 48)
Rheumatoid
Arthritis
patients
(n = 27)
General
population
(n = 212)
Gender (male, %) 58.7 34.6 50.0
Age (Mean, sd) 63.1 (9.7) 64.5 (9.1) 44.0 (16.3)
Educational level (%)
Low 47.8 63.0 35.8
Middle 23.9 14.8 35.4
High 28.3 22.2 28.8
Marital Status (%)
Single 4.3 3.7 33.2
Married/living
together
84.8 74.1 53.6
Widowed 10.9 14.8 6.6
Divorced 0.0 7.4 6.6
Religious (%) 63.0 70.4 46.9
Reporting problems own health (EQ-5D, %)
Mobility 22.9 70.4 13.3
Self-care 0.0 44.4 1.9
Usual Activities 29.2 85.2 14.2
Pain/discomfort 35.4 88.9 33.0
Anxiety/depression 25.0 14.8 13.2
VAS value own health
state (Mean, sd)
84.1 (2.4) 60.9 (4.2) -
TTO value own health
state (Mean, sd)
0.93(0.02) 0.74 (0.09) -
Krabbe et al. Health and Quality of Life Outcomes 2011, 9:31
/>Page 4 of 9
however, it seems that RA patients assign slightly higher
values to these states. Compared with the general popu-
lation, cancer patients seem to respond more negatively
to health states associated with problems in the domains
of pain/discomfort and anxiety/depression. Apart from
the deviation shown by the cancer group, a gradient
decline c an be observed over the 17 EQ-5D states. The
TTO values (Figure 1C) show higher patient values for
almost all health states. Differences among the three
study groups are substantially greater for the TTO data
than for the rank and VAS data. Furthermore, the TTO
values for the EQ-5D health states cannot be described
as a gradient decline; the plot looks more like a step
function.
Separate regressio n analyses on the VAS data for the
three study groups showed that states with mobility at
level 2 (some problems) were systematically assigned
lower values by the general population (Table 3). This
Table 2 Number (%) of EuroQol-5D descriptive
classifications of study populations
EuroQol-5D
classification
Cancer
patients
(n = 48)
Rheumatoid
Arthritis
patients
(n = 27)
General
population
(n = 211)
11111 19 (39.6) 2 (7.4) 123 (58.3)
11112 4 (8.3) - 8 (3.8)
11121 4 (8.3) 2 (7.4) 29 (13.7)
11211 2 (4.2) - 4 (1.9)
11212 1 (2.1) - 1 (0.5)
11221 2 (4.2) 3 (11.1)
11122 - - 7 (3.3)
11222 5 (10.4) - 3 (1.4)
12221 - 1 (3.7)
12223 - - 1 (0.5)
21111 5 (10.4) - 4 (1.9)
21112 - - 1 (0.5)
21121 1 (2.1) - 7 (3.3)
21122 1 (2.1) - 1 (0.5)
21221 3 (6.3) 7 (25.9) 5 (2.4)
21222 1 (2.1) 1 (3.7) 4 (1.9)
21223 - - 1 (0.5)
21223 - - 2 (0.9)
22121 - - 1 (0.5)
22221 - 4 (14.8) 1 (0.5)
22222 - - 1 (0.5)
22231 - 1 (3.7) -
22232 - 2 (7.4) -
22311 - 1 (3.7) -
22321 - 1 (3.7) -
22331 - 1 (3.7) -
22332 - 1 (3.7) -
Figure 1 Mean scores (added with standard error of means) of
the set of EuroQol-5D health states derived by three different
measurement methods (ranking, VAS, TTO) presented for the
general population and for the two patient groups (For the
VAS and the TTO the EuroQol-5D state ‘ 11111’ is set to 1.0 and
the condition ‘dead’ to 0.0 by definition).
Krabbe et al. Health and Quality of Life Outcomes 2011, 9:31
/>Page 5 of 9
indicates that healthy people value the lack of mobility
limitation as more important than the two disease
groups. Furthermore, states with multiple domains with
severe problems (N3 parameter) were assessed lower
(-0.28) by the cancer group than by the other two
groups. The proportion of explained variance ( R
2
)was
higher for the two patient groups (cancer: 0.76, RA:
0.83) than for the general population (0.58). An addi-
tional regression analysis showed that neither member-
ship of one of the patient groups was an important
factor to explain the valuations of 17 hypothetical EQ-
5D states nor the value assigned to the patients’ own
health state.
Similar regression analysis on the TTO data sho wed
that states with some prob lems (level 2) on the domains
self-care (-0.10) and anxiety/depression (-0.13) were sys-
tematically assigned lower values by the general popula-
tion (Table 4). F or the two patient groups severe
problems (level 3) on mobility produced lower values in
comparison with the group of healthy people. For both
patient groups, t he coefficients for the N3 parameter
(-0.12) were about half the weight of that for the general
population (-0.25). The proportion of explained variance
for the TTO data was lower than fo r the VAS data, and
differences between the three study groups were less
pronounced (cancer 0.45, RA 0.49, general population
0.40). The regression analyses for the effect of belonging
to one of the patient groups a nd the effect of the value
assigned to the patients’ own health state showed that
these patient-specific parameters did offer additional
information in explaining the 17 hypothetical EQ-5D
states. In particular, patients who rated themselves bet-
ter in comparison with other patients rated the hypothe-
tical health states higher. However, this effect was not
expressed in the overall amount of explained variance
(0.49).
Discussion
Many studies have found discrepancies in valuations for
health states between the general population (healthy
people) and people who actually experience illness
(patients). Such differences may be explained by refer-
ring to various cognitive mechanisms. However, more
likely most of these observed differences may be attribu-
table to the approach used to measure t hese health
states. In this study we compared different measurement
strategies. One method based on the separate assess-
ment of each health state, and two other methods that
incorporated a comparative element by making judg-
ments of at least pairs of states. Also, in contrast to
Table 3 Coefficients (standard error) of different regression analyses on VAS values for the general population and for
the two patient groups based on variables for the 5 domains (for each domain 2 dummies expressing the step from
level 1 to level 2 (2), and the step from level 2 to level 3 (3))
Parameters Coefficients
Effect of EQ-5D domains Additional effect of
patient groups
Additional effect of
valuation own health
Cancer RA General population Cancer + RA + Gen. pop. Cancer + RA
Constant 0.87 (0.01)* 0.91 (0.01)* 0.87 (0.01)* 0.88 (0.01)* 0.94 (0.02)*
Mobility (2) -0.09 (0.02)* -0.06 (0.02)* -0.13 (0.01)* -0.11 (0.01)* -0.08 (0.02)*
Self-care (2) -0.10 (0.02)* -0.11 (0.02)* -0.10 (0.01)* -0.10 (0.01)* -0.10 (0.02)*
Usual activities (2) 0.00 (0.02) -0.03 (0.02) -0.04 (0.01)* -0.03 (0.01)* 0.01 (0.02)
Pain/discomfort (2) -0.12 (0.02)* -0.08 (0.02)* -0.08 (0.01)* -0.09 (0.01)* -0.10 (0.01)*
Anxiety/depression (2) -0.07 (0.02)* -0.08 (0.02)* -0.06 (0.01)* -0.06 (0.01)* -0.07 (0.02)*
Mobility (3) -0.21 (0.03)* -0.19 (0.03)* -0.22 (0.02)* -0.22 (0.01)* -0.20 (0.02)*
Self-care (3) -0.07 (0.03)* -0.10 (0.03)* -0.07 (0.02)* -0.08 (0.01)* -0.08 (0.02)*
Usual activities (3) -0.02 (0.03) -0.06 (0.03)* -0.09 (0.02)* -0.08 (0.01)* 0.03 (0.02)
Pain/discomfort (3) -0.19 (0.02)* -0.15 (0.02)* -0.18 (0.01)* -0.18 (0.01)* -0.17 (0.02)*
Anxiety/depression (3) -0.17 (0.02)* -0.17 (0.02)* -0.15 (0.01)* -0.16 (0.01)* -0.17 (0.02)*
N3 -0.28 (0.02)* -0.24 (0.02)* -0.17 (0.01)* -0.20 (0.01)* -0.26 (0.02)*
Cancer patients - - - -0.05 (0.01)* -
RA patients - - - 0.01 (0.01) -
VAS value own state - - - - <0.01 (0.00)
R
2
0.76 0.83 0.58 0.62 0.78
*statistically significant (p
<
0.05)
Krabbe et al. Health and Quality of Life Outcomes 2011, 9:31
/>Page 6 of 9
many previous studies, patients did not assess a limited
number of health states but agreed to judge a bundle of
hyp othetical heal th states. Such a strategy based on sets
of health states better contextualizes the judgmental
task for each separate health state.
For values attached to hypothetical health states, no
general p attern could be detected that shows deviation
between healthy people and ill people. Judgments based
on ranks were rather similar for the two patient groups
and the group of h ealthy people. In regard to the VAS
and TTO methods, in which respondents are required
not only to compare but also to express strength of pre-
ference, these two methods showed different values
between healthy people and patients, though t hese dif-
ferences were moderate for the VAS and large for the
TTO. In addition, regression analyse s showed that the
own health condition seems to affect TTO valuations
but not the VAS valuations.
The reduction of discrepancies between patients and
the general population for the VAS may be largely due
to characteristics of the judgmental (multi-item) task
[32]. Other measurement methods with a comparative
element have been introduced for the valuation of
health states. Important methods in this area are paired
comparisons [33], discrete choice analysis [34], and
multidimensional scaling [35]. The popular TTO techni-
que adopted from the field of health e conomics reveals
far more deviation between patients and the general
population. In an earlier study, the application of a basic
mathematical routine also revealed deviating response
behavior in health-state valuations elicited with the
TTO tec hnique [36]. It is above all the central element
time that likely induce different values for different
respondents in the TTO. For example, many people
show unwillingness to sacrifice any life expectancy in
TTO tasks. It is conceivable that the time-frame of 10
years f or the TTO in this study has lead to very differ-
ent value judgments between patients and the general
population because the general population in our study
is,onaverage,20yearsyoungerthanthepatients.TTO
seems contaminated by an appraised element (i.e., time)
that is unrelated to the health status of a individual.
Measurement theory notifies that the TTO method can-
not be classified as an accurate (unidimensional) mea-
surement method for health states, because two distinct
phenomena (health status, longevity) are measured
simultaneously. In general, distortions of health-state
values, if elicited with the TTO and the more traditional
standard gamble technique, are widely recognized
[37,38].
Table 4 Coefficients (standard error) of different regression analyses on TTO values for the general population and for
the two patient groups (for each domain 2 dummies expressing the step from level 1 to level 2 (2), and the step from
level 2 to level 3 (3))
Parameters Coefficients
Effect of EQ-5D domains Additional effect
of patient groups
Additional effect of
valuation own health
Cancer RA General population Cancer + RA + Gen. pop Cancer + RA
Constant 0.96 (0.03) 0.98 (0.04) 0.93 (0.02) 0.94 (0.01)* 0.78 (0.03)*
Mobility (2) -0.04 (0.06) -0.02 (0.07) -0.04 (0.03) -0.04 (0.02)* -0.03 (0.04)
Self-care (2) -0.03 (0.05)* -0.02 (0.06) -0.10 (0.03) -0.07 (0.02)* -0.02 (0.04)
Usual activities (2) -0.04 (0.06)* -0.02 (0.07) -0.02 (0.03) -0.04 (0.02)* -0.03 (0.04)
Pain/discomfort (2) -0.10 (0.04)* -0.08 (0.05)* -0.09 (0.02) -0.09 (0.01)* -0.09 (0.03)*
Anxiety/depression (2) -0.06 (0.05)* -0.03 (0.06) -0.13 (0.03) -0.11 (0.02)* -0.05 (0.04)
Mobility (3) -0.32 (0.07)* -0.38 (0.08)* -0.17 (0.04)* -0.18 (0.02)* -0.35 (0.05)*
Self-care (3) -0.07 (0.06)* -0.16 (0.07) -0.14 (0.03)* -0.15 (0.02)* -0.10 (0.04)
Usual activities (3) -0.09 (0.07)* -0.06 (0.08) -0.06 (0.04) -0.07 (0.02)* -0.08 (0.05)
Pain/discomfort (3) -0.44 (0.05)* -0.35 (0.06)* -0.32 (0.03)* -0.34 (0.02)* -0.40 (0.04)*
Anxiety/depression (3) -0.28 (0.05)* -0.22 (0.06)* -0.30 (0.03)* -0.33 (0.02)* -0.26 (0.04)*
N3 -0.12 (0.05)* -0.12 (0.06) -0.25 (0.03) -0.21 (0.02)* -0.11 (0.04)*
Cancer patient - - - 0.07 (0.02)* -
RA patient - - - 0.12 (0.02)* -
TTO value own state - - - - 0.22 (0.03)*
R
2
0.45 0.49 0.40 0.41 0.49
*statistically significant (p < 0.05)
Krabbe et al. Health and Quality of Life Outcomes 2011, 9:31
/>Page 7 of 9
Several previous studies have investigated the relation-
ship between healt h-state values deriv ed from patien ts
versus the general population. An overview article [6]
identified nine study designs that have been used to
study this issue. In general, the designs could be differ-
entiated in terms of the type of health states, selection
of study population, valuation task etc. Health states
were divided into hypo theti cal states and actual states.
Most studies compared patients’ values for their own
actual health state, as experienced at the time of mea-
sureme nt, with values fo r hypothetical health states per-
taining to treatment outcomes or particular stages of
disease [39-41]. In most cases, general pop ulation values
were obtained by using an existing social tariff [42-45].
A few studies took an indirect approach to compare
valuations for actua l and hypothetical states [46]. Other
studies analyzed values from different groups, values
derived with different valuation t echniques, or asse ss-
ments of different conditions.
A r esearch design that comes close to ours was used
by Badia et al. [47]. In their study, 14 hypothetical EQ-
5D health states were valued (EuroQol-VAS) by a sam-
ple of the general population and chronically ill patients.
Their results show higher values from patients com-
pared with the general population, especially for worse
states. This difference persisted when controlling for
age, gender, education level, health status, and self-rated
health (See also: [48]). Their study design differed from
ours in various ways. Their patient group was more het-
erogeneous, and patients did not assess their own EQ-
5D description. A factor that may largely explain why
they found large differences between patients and
healthy people is that in their study th e raw VAS scores
have not been rescaled (e.g., calibrated to 0 = dead, 1 =
full health). Unknowing asses sment of the patient’sown
health state had been used earlier by Llewellyn-Thomas
[41] for breast cancer. In this study patients’ values for
health states related to breast cancer scenarios were
compared with the patients’ actual stage of disease.
A potential limitation of our experimental study is the
sample size of the patient group s. In particular, the
group o f rheumatoid arthritis patients was moderate in
size. It was too small to allow us to use rank data as
input for scaling models, e.g., Thurstone scaling [28] or
extended rank-based models (e.g., discrete choice mod-
els), to arrive at aggregated metric (interval) values.
Nevertheless, the mean statistics for the rank and VAS
data show relatively small standard errors of the mean,
and the mean values for the set of health states show a
clear overall pattern. The interviewer may have inf lu-
enced the obtained results from the patients, though we
have no indication that this may have led to notable
biases.
Conclusions
Theresultsofthisstudyindicatethatdifferences
between patients and non-patients can be largely
reduced and eventually eliminated if the deriving of
health state values is worke d out in a recognized mea-
surement framework. Our findings also imply that
instead o f patients, people from the general population
may be interviewed to quantify hypothetical health
states. The only requirement is that the assessment of
health states should take place under rigorous condi-
tions. Essentially, this stipulates that a wide array of
health states should be judged or assessed by simple
comparative response tasks that are embedded in an
established theoretical measurement framework.
Acknowledgements
We would like to thank the participating patients for their co-operation. This
work has also been presented during an oral presentation at the 7th World
Congress on Health Economics (iHEA), Beijing, China, July 12-15, 2009. This
research was made possible by a grant from the EuroQol Group.
Author details
1
Department of Epidemiology, Unit Health Technology Assessment,
University Medical Center Groningen, University of Groningen, Groningen,
The Netherlands.
2
Radboud University Nijmegen Medical Centre,
International Center for Health Systems Research and Education, (NICHE),
Department of Primary and Community Care, P.O. Box 9101 6500 HB
Nijmegen, The Netherlands.
3
Antoni van Leeuwenhoek Hospital, Department
of Surgery, Plesmanlaan 121, 1066 CX Amsterdam, The Netherlands.
4
Radboud University Nijmegen Medical Centre, Department of
Rheumatology, P.O. Box 9101, 6500 HB Nijmegen, The Netherlands.
Authors’ contributions
Conception and design: PFMK, NT. Provision of study materials and/or
patients: PFMK, NT, TJMR, PLCMR. Collection and assembly of data: PFMK, NT.
Data analysis and interpretation: PFMK, NT. Manuscript writing: PFMK, NT,
TJMR, PLCMR. Final approval of manuscript: PFMK, NT, TJMR, PLCMR. All
authors read and approved the final manuscript.
Competing interests
The authors declare that they have no competing interests.
Received: 23 September 2010 Accepted: 11 May 2011
Published: 11 May 2011
References
1. Gold MR, Siegel JE, Russel LB, et al: Cost-Effectiveness in Health and
Medicine. New York: Oxford University Press; 1996.
2. Boyd NF, Sutherland HJ, Heasman KZ: Whose utilities for decision
analysis? Med Decis Making 1990, 10:58-67.
3. Ubel PA, Loewenstein G, Jepson C: Whose quality of life? A commentary
exploring discrepancies between health state evaluations of patients
and the general public. Qual Life Res 2003, 12:599-607.
4. Jansen SJT, Stiggelbout AM, Wakker PP: Unstable preferences: a shift in
valuation or an effect of the elicitation procedure? Med Decis Making
2000, 20:62-71.
5. Zethraeus N, Johannesson MA: Comparison of patient and social tariff
values derived from the time trade-off method. Health Econ 1999,
8:541-545.
6. Wit de GA, Busschbach van JJV, Charro de FTH: Sensitivity and perspective
in the valuation of the health status: whose values count? Health Econ
2000, 9:109-126.
7. Dolders MGT, Zeegers MPA, Groot W, et al: A meta-analysis demonstrates
no significant differences between patient and population preferences. J
Clin Epidemiol 2006, 59:653-664.
Krabbe et al. Health and Quality of Life Outcomes 2011, 9:31
/>Page 8 of 9
8. Kind P, Dolan P: The effect of past and present illness experience on the
valuations of health states. Med Care 1995, 33:AS225-AS263.
9. Lenert LA, Treadwell JR, Schwartz CE: Associations between health status
and utilities: implications for policy. Med Care 1999, 37:479-489.
10. Allison PJ, Locker D, Feine JS: Quality of Life: A dynamic construct. Soc Sci
Med 1997, 45:221-230.
11. Solomon JA, Murray CJL: A conceptual framework for understanding
adaptation, coping, and adjustment in health state valuations. In
Summary Measures of Population Health: Concepts, Ethics, Measurement and
Applications. Volume 0000. Edited by: Murray CJL, Salomon JA, Mathers CD,
Lopez AD. Geneva: World Health Organization; 2002:619-626.
12. Dolan P, Kahneman D: The interpretation of utility and their implications
for the valuation of health. The Economic Journal 2008, 118:215-234.
13. Sprangers MAG, Schwartz CE: Integrating response shift into health-
related quality of life research: a theoretical model. Soc Sci Med 1999,
48:1507-1515.
14. Postulart D, Adang EM: Response shift and adaptation in chronically ill
patients. Med Decis Making 2000, 20:186-193.
15. Festinger L, Rieken HW, Schachter S: When Prophecy Fails: A social and
psychological study of a modern group that predicted the destruction
of the world. New York: Harper Torchbooks; 1956.
16. Festinger L: A Theory of Cognitive Dissonance. Stanford: Stanford
University Press; 1957.
17. Kahnemann D, Tversy A: Prospect Theory: An analysis of decision under
risk. Econometrica 1979, 47:263-392.
18. Clarcke AE, Goldstein MK, Michelson D, et al: The effect of assessment
method and respondent population on utilities elicited for Gaucher
Disease. Qual Life Res 1997, 6:169-184.
19. Jansen SJT, Kievit J, Nooij M, Stiggelbout AM: Stability of patients’
preferences for chemotherapy: the impact of experience. Med Decis
Making 2001, 21:295-306.
20. Murphy R, Sackley CM, Miller P, et al: Effect of experience of severe stroke
on subjective valuations of quality of life after stroke. J Neurol Neurosurg
Psychiatry 2001, 70:678-681.
21. McPherson K, Myers J, Taylor WJ, et al: Self-valuation and societal
valuations of health state differ with disease severity in chronic and
disabling conditions. Med Care 2004, 42:1143-1151.
22. Happich M, Von Lengerke T: Valuing the health state ‘tinnitus’:
Differences between patients and the general public. Hear Res 2005,
207:50-58.
23. Thurstone LL: A law of comparative judgments. Psychol Rev 1927,
34:273-286.
24. Luce RD, Tukey JW: Simultaneous conjoint measurement: a new type of
fundamental measurement. J Math Psychol 1964, 1:1-27.
25. McFadden D: Conditional logit analysis of qualitative choice behavior. In
Frontiers in Econometrics. Edited by: Zarembka P. New York, NY: Academic
Press; 1974.
26. Lamers LM, Mc Donnell J, Stalmeier PFM, et al: The Dutch tariff: results
and arguments for an effective design for national EQ-5D valuation
studies. Health Econ 2006, 15:1121-1132.
27. Rabin R, Charro de F: EQ-5D: a measure of health status from the
EuroQol Group. Ann Med 2001, 33:337-343.
28. Krabbe PFM: Thurstone scaling as a measurement method to quantify
subjective health outcomes. Med Care 2008, 46:357-365.
29. Lamers LM, Stalmeier PFM, Krabbe PFM, et al: Inconsistencies in TTO and
VAS values for EQ-5D health states. Med Decis Making 2006, 26:173-181.
30. Torrance GW, Thomas WH, Sackett DL: A utility maximization model for
evaluation of health care programs. Health Serv Res 1972, 3:118-133.
31. Dolan P: Modeling valuations for EuroQol health states. Med Care 1997,
35:1095-1108.
32. Krabbe PFM, Stalmeier PFM, Lamers LM, et al: Testing the interval-level
measurement property of multi-item visual analogue scales. Qual Life Res
2006, 15:1651-1661.
33. McKenna SP, Hunt SM, McEwen J: Weighting the seriousness of perceived
health problems using Thurstone’s method of paired comparisons. Int J
Epidemiol 1981, 10:93-97.
34. Hakim Z, Pathak DS: Modelling the Euroqol data: a comparison of
discrete choice conjoint and conditional preference modelling. Health
Econ 1999, 8
:103-116.
35. Krabbe PFM, Salomon JA, Murray CJL: Quantification of health states with
rank-based nonmetric multidimensional scaling. Med Decis Making 2007,
27:395-405.
36. Krabbe PFM: Valuation structures of health states revealed with singular
value decomposition. Med Decis Making 2006, 26:30-37.
37. Stalmeier PFM, Busschbach van JJ, Lamers LM, et al: The gap effect:
discontinuities of preferences around dead. Health Econ 2005, 14:679-685.
38. Doctor JN, Bleichrodt H, Lin HJ: Health utility bias: a systematic review
and meta-analytic evaluation. Med Decis Making 2010, 30:58-67.
39. Christensen-Szalanski JJJ: Discount functions and the measurement of
patients’ values. Women’s decisions during childbirth. Med Decis Making
1984, 4:47-58.
40. O’Connor AM, Boyd NF, Warde P, et al: Eliciting preferences for alternative
drug therapies in oncology: influence of treatment outcome description,
elicitation technique and treatment experience on preference. J Chronic
Dis 1987, 40:811-818.
41. Llewellyn-Thomas HA, Sutherland HJ, Thiel EC: Do patients’ evaluations of
a future health state change when they actually enter that state? Med
Care 1993, 31:1002-1012.
42. Hurst NP, Jobanputra P, Hunter M, et al: Validity of EuroQol - a generic
health stature instrument - in patients with rheumatoid arthritis. Br J
Rheumatol 1994, 33:655-662.
43. Jenkinson C, Gray A, Doll H, et al: Evaluation of index and profile
measures of health status in a randomized controlled trial. Comparison
of the Medical Outcomes Study 36-item Short Form health survey,
EuroQol, and disease specific measures. Med Care 1997, 35:1109-1118.
44. Suarez-Almazor ME, Conner-Spady B: Rating of arthritis health states by
patients, physicians, and the general public: Implications for cost-utility
analyses. J Rheumatol 2001, 28:648-656.
45. Janssen KJM, Goris RJA, Hazenberg CEVB, et al: Discrepancies between the
EuroQol-5D societal index and patient derived valuations. In Proceedings
of the 20th Plenary Meeting of the EuroQol Group 11th - 14th September.
Edited by: Prevolnik Rupel V. Bled, Slovenia; 2003:111-17.
46. Dolan P:
The effect of experience of illness on health state valuations. J
Clin Epidemiol 1996, 49:551-564.
47. Badia X, Herdman M, Kind P: The influence of ill-health experience on the
valuation of health. Pharmacoeconomics 1998, 13:687-696.
48. Badia X, Rué M, et al: Measuring health and health state preferences
among critically ill patients. Intensive Care Med 1996, 22:1379-1384.
doi:10.1186/1477-7525-9-31
Cite this article as: Krabbe et al.: Are patients’ judgments of health
status really different from the general population? Health and Quality of
Life Outcomes 2011 9:31.
Submit your next manuscript to BioMed Central
and take full advantage of:
• Convenient online submission
• Thorough peer review
• No space constraints or color figure charges
• Immediate publication on acceptance
• Inclusion in PubMed, CAS, Scopus and Google Scholar
• Research which is freely available for redistribution
Submit your manuscript at
www.biomedcentral.com/submit
Krabbe et al. Health and Quality of Life Outcomes 2011, 9:31
/>Page 9 of 9