Oceanography and Marine Biology: An Annual Review (Volume 43) - Chapter 6 ppsx
Bạn đang xem bản rút gọn của tài liệu. Xem và tải ngay bản đầy đủ của tài liệu tại đây (4.19 MB, 68 trang )
3597_book.fm Page 211 Friday, May 20, 2005 6:26 PM
Oceanography and Marine Biology: An Annual Review, 2005, 43, 211-278
© R. N. Gibson, R. J. A. Atkinson, and J. D. M. Gordon, Editors
Taylor & Francis
ZONATION OF DEEP BIOTA ON CONTINENTAL MARGINS
ROBERT S. CARNEY
Oceanography and Coastal Sciences, Louisiana State University,
Baton Rouge, Louisiana, U.S.
E-mail:
Abstract Pioneering deep-sea surveys established that the fauna of the continental margins is zoned
in the sense that individual species and assemblages occupy restricted depth bands. It has been
speculated that the causes of this wide-spread pattern might involve cold temperatures, high
pressures and limited food availability. Increased sampling over the past two decades has confirmed
the global presence of depth zonation. Well-defined zonation in the cold polar oceans and the warm
Mediterranean indicate that temperature per se may be of less importance on ecological timescales
than originally proposed. Strong alternatives are range restriction by pressure and food availability.
Understanding of pressure physiology has advanced greatly, and it is to be expected that all deep
organisms possess some form of genetic adaptation for pressure tolerance. Since high pressure and
low temperatures affect membrane and enzyme systems similarly, combined piezo-thermal thresholds may limit depth ranges. There is a negative, exponential gradient of food availability caused
by the decrease in labile carbon influx to bottom. The TROX model linking carbon influx with
interstitial oxygen levels has been successful in explaining deep distributions of benthic Foraminifera
and may be more broadly applicable. Current efforts to relate metazoan ranges to food availability
are, however, hindered by limited understanding of how organisms recognise and utilise the
nutritious content of detritus. Thus, the exact controls of depth zonation remain conjectural. Zonation studies are gaining in importance due to the increasing availability of deep fauna databases
and the need to establish regulatory boundaries. Future studies may benefit from a growing body
of biogeographic theory, especially the understanding of bounded domains. It is proposed that
continental slope fauna may be more effectively studied if viewed as the overlapping of three
components: species extending down from the shelf, species extending up from the abyss and
species truly restricted to the slope.
Introduction
Justification
At the end of the first century of deep-sea ecological studies, comparatively scant trawling, dredging
and coring had provided preliminary sketches of three large-scale patterns that seemed to widely
characterise the biology of continental margins and abyssal plains (Mills 1978). The first pattern
was that abundance measured as either population density or biomass decreased rapidly with depth
similar to a negative exponential curve (Rowe 1983). The second pattern was zonation, a progression
with depth of changing species such that continental slope fauna was distinct from that of the shelf
above and abyssal plain below (Carney et al. 1983). Finally, a pattern that along a wide depth
transect, the greatest diversity of species lay at some mid or deeper level on the slope (Rex 1973,
1983). In the following decades, the global generality of the first pattern, biomass decrease, has
211
© 2005 by R.N Gibson, R.J.A. Atkinson and J.D.M. Gordon
3597_book.fm Page 212 Friday, May 20, 2005 6:26 PM
ROBERT S. CARNEY
been repeatedly confirmed. However, the generality of diversity patterns continues to be debated
(Gray 1994, Ugland et al. 2003), and convincing causal mechanisms remain elusive (Gage 1996,
Snelgrove & Smith 2002). In contrast, the validity of the zonation pattern has gone virtually
unchallenged with the main discussion centering on causes.
The primary intent of this review is to place the accumulated findings about deep-sea faunal
zonation into the similar scientific contexts of contemporary biogeography and oceanography. The
timeliness for the review, however, arises less from scientific advancement than from the rapidly
increasing need for scientific-based management of deep-sea habitats and the rapidly changing
mode of information synthesis. Scientifically, the oceanographic community is making rapid
progress toward whole-ocean syntheses of geology, geophysics and geochemistry. The initial
‘generic bug’ phase of incorporating biological processes into these models is coming to an end
as temporal and spatial variation must be understood. The study of species distributions is part of
the process of understanding what happens where and when. Organisms of differing capabilities
interact with their environment differently at different times and different places. Depth zonation
is directly relevant to understanding the processes on the deep-sea floor.
Resource exploitation for petroleum and fisheries beyond the depths of the continental shelf is
now routine and advancing faster than any new understanding of how that environment functions
(Glover & Smith 2003, Thiel 2003). Ideally, the effective management of any ecosystem should
be based upon a full understanding of ecological processes (Carney 1997, Gage 2001). At a
minimum, management requires maps: maps that delineate regions for use from regions of conservation, and maps that assign authority for regulation. Extensively on land and to a lesser degree
in the shallow (<200 m depth) coastal ocean, the mapping of ecological boundaries has assumed
a major regulatory role. In responding to the importance of maps, landscape ecologists are seeking
to develop broadly applicable theories of ecological boundaries (Cadenasso et al. 2003). It is highly
likely that regulatory mapping of the deep-sea floor will be based upon a combination of knowledge
about faunal zonation and these emerging theories, making it extremely important for oceanographers to know what patterns actually exist and to participate in theories appropriate for deep-sea
management.
Whether for understanding oceanographic processes or developing effective management, the
mode in which syntheses are developed from species distribution data is rapidly changing. This
may be the last review of deep-sea zonation that depends upon the published conclusions of experts.
Increasingly, dependence on the syntheses of others is being replaced by direct examination of
datasets. The great power of this ‘informatics’ mode (Soberon & Peterson 2004) is the ease with
which old data can be re-examined in the light of new concepts and methods. The great weakness
is that datasets alone do not fully convey the history of concepts that lead to their creation. Faunal
data are seldom free from patterns embedded by the assumptions of design or the oversimplifications
and errors inherent in taxonomies. It is the intent of this review to minimise the errors of future
re-analyses by establishing the current state of understanding about faunal zonation.
Scope and organisation
This review is primarily focused upon the biota of the continental margin from the outer edge of
the continental shelf to the base of the slope and a small portion of the adjacent continental rise
and abyssal plain. This is the region of the steepest slope and over which many factors are highly
correlated with depth. Across the much larger areas of the abyssal plains, correlations with depth
break down and discussion of biotic patterns in terms of depth has little ecological relevance. This
review makes no claim to comprehensiveness. Most published information on the depth distribution
of deep-sea species is found in the systematic literature where it is reported with varying degrees
of analysis and detail. Species-by-species compilation of ranges from this literature is of obvious
212
© 2005 by R.N Gibson, R.J.A. Atkinson and J.D.M. Gordon
3597_book.fm Page 213 Friday, May 20, 2005 6:26 PM
ZONATION OF DEEP BIOTA ON CONTINENTAL MARGINS
value (Macpherson 2002, 2003), but this review draws more upon the comparatively few studies
that directly examine zonation on the basis of multispecies samples. The included references have
been selected to illustrate key points and to compile results from ocean regions of special interest.
The literature in three highly relevant areas of inquiry is simply too extensive to be considered in
any single review and has only been sampled herein. The first is biogeographic theory as it pertains
to the distribution of species along gradients in any environment. The second is the distribution of
potentially commercial fish and crustaceans. The data from ground fish surveys extending beyond
the continental slope are a rich source of published information. The third is the literature of
classification and ordination analyses. A critical review of their application in biogeographic studies
is needed.
When scientists try to explain the factors causing a pattern observed in nature there is an
understandable tendency to favour both the most understood and the most easily measured options.
Therefore, this review starts with a history of observation and explanation. Then it considers the
greatly advanced current state of knowledge about possible causal factors. The faunal depth patterns
found at seven selected sites are next presented as case histories bearing upon the importance of
factors. The contrast and similarities among case histories are then discussed in the context of
recurrent questions and methodological limitations.
Historical drawing of boundaries and identification of factors
Pioneering marine naturalists of the mid to late nineteenth century were heavily influenced by
Baron Von Humbolt’s determination that large-scale plant distributions are controlled by the associated factors of climate, latitude and altitude. A half a century later Lyell’s dynamic view of earth
history published in 1830 acknowledged a strong climatic influence on marine distributions and
established the value of invertebrate fossils as indicators of past climates (Blundell & Scott 1998).
Pursuing historical reconstruction, mid nineteenth century European dredging studies, many carried
out by Edward Forbes (Mills 1978), with a few similar efforts in the western Atlantic (Agassiz
1863–1869), consistently identified temperature, salinity, bottom type and food levels as factors
that had a strong influence on distributions at shelf depths. These distributions manifest themselves
as cross-shelf biotic zones with locally fixed depth ranges, but shallowing or deepening over larger
scales in response to latitudinal temperature.
By the 1860s, the obvious economic value of submarine telegraph communication produced a
highly effective partnership between navies and naturalists as progressively ambitious cable routes
were surveyed. Culminating in the scientific voyage of the HMS CHALLENGER (Corfield 2003),
this partnership produced a wealth of new knowledge about the topography, sediments, and large
species from the deep-ocean floor, along with an appreciation of global ocean thermal structure.
Beneath the warm upper ocean, temperature and salinity that were so important in Forbes’ shelf
biotic zones were found to be uncoupled from local surface climate and to vary little with additional
depth. It was also obvious that there were two extreme types of biota, that on the shelves and that
in the abyss, with a zone of transition in between (Agassiz 1888, Murray 1895). Drawing lines that
separated this ‘archibental zone of transition’ from the distinct shelf and distinct abyss was the first
task of deep-sea distribution studies.
Subsequent syntheses treated the archibenthic region differently. Some stressed it was a region
characterised by a transition between shelf and slope, while others treated it as a region with its
own distinct fauna. The former approach can be seen in the first synthesis of distributions based
upon the CHALLENGER and MICHAEL SARS expeditions, presented by Murray and Hjort
(1912). They used megafauna distributions, topography and temperature to place the archibenthic
transition zone between an upper boundary of 600–800 m and a lower boundary of 2000–3000 m.
Ekman’s comprehensive treatment of marine zoogeography (Ekman 1953), first published in 1935,
213
© 2005 by R.N Gibson, R.J.A. Atkinson and J.D.M. Gordon
3597_book.fm Page 214 Friday, May 20, 2005 6:26 PM
ROBERT S. CARNEY
benefited from additional global data and treated the archibenthic as a distinct region. Ekman was
a strong advocate for setting zonal boundaries in regions of maximum species turnover. The upper
slope had been relatively well sampled allowing the lower boundary of the shelf fauna to be set at
200–400 m. Identifying deeper transitions was hindered by a lack of samples, but Ekman placed
the line between the archibenthic and abyssal somewhat arbitrarily at 1000 m. Ekman speculated
that the actual faunal transition might prove to be associated with the somewhat deeper transition
from hemipelagic to eupelagic sediments. The sedimentary transition was known to be a proxy for
organic carbon deposition. Le Danois (1948) examined meso-scale distributions off the western
European coast more analytically, and placed the beginning of a relatively uniform abyssal fauna
at 2500 m. He also noted that many ecological subdivisions were possible above that depth.
By the conclusion of the Danish GALATHEA Expedition in 1952, general distribution patterns
of megafauna beyond the continental shelf, global ocean thermal structure and acoustically determined bathymetry were sufficiently well known. All three effectively combined to produce generally
accurate characterisations of faunal zones. Anticipating distribution control via physiological
effects, Bruun (1957) elected to set faunal boundaries along global isotherms. The psychrosphere
is at or below the 10°C isotherm and was divided into a bathyal (archibental) and abyssal segments
by the 4°C isotherm. Between 55ºN and 55ºS the psychrosphere is overlain by the warmer thermosphere, and within this wide latitude band the thermal zones generally coincide with shelf and
upper slope (thermosphere), middle and lower slope (bathyal psychrosphere) and abyssal plain
(abyssal psychrosphere). At higher latitudes, the psychrosphere rises to the surface losing the
relation to margin topography. East to west across major basins, the defining 10°C isotherm may
lie as shallow as 100 m under eastern upwelling or be as deep as 700 m along the western edge
of basins at mid latitudes. Relying on temperature, topography and faunal distributions, Bruun
divided the psychrosphere into three zones. The bathyal zone was thermally defined and lay between
the 10 and 4°C isotherms. The upper boundary of the abyssal zone was set at the 4°C isotherm,
and the lower boundary was set bathymetrically at 6000 m. This junction between the abyssal and
the hadal zone was largely based on the topography of deep-ocean trenches.
Menzies et al. (1973) strongly objected to drawing boundaries on the basis of a mixture of
faunal, thermal, and topographic feature analysis. Their preferred method would be the identification
of depths of maximum faunal change with special emphasis placed upon isopods in the order
Asellota often at the level of genus and above. As with the pioneering studies, a major division
into shelf and abyssal provinces was recognised. The transitional nature of the intervening archibenthic was stressed by naming it the archibenthal zone of transition (AZT). The exact depth of
the AZT was seen as varying widely throughout the oceans in response to temperature and due to
less obvious factors. Reflecting the presence of typically abyssal Asellota on polar shelves, it was
proposed that the Arctic possessed only a narrow shallow band of shelf fauna. The AZT fauna was
seen as beginning at 12 m and extending over the shelf break to 360 m. The deeper abyssal fauna
began with widening and poorly defined subdivisions: upper abyssal (425–570 m), mesoabyssal
(610–869 m), and lower abyssal (1000–2600 m). In the Antarctic, the shelf fauna extended to
100 m. The AZT began on the geological shelf at 150 m and extended over the deep shelf edges
to 900 m. The abyssal province was set between 950 and 5450 m subdivided into broad upper
(950–3475 m) and lower (3800–5449 m) zones with a narrow mesoabyssal (3510–3800 m).
Between the polar extremes, studies at middle latitudes in the western Atlantic put the lower
extent of shelf fauna at 440 m, well below the 80 m shelf break. On the steep slope off Peru, the
shelf fauna extended to 1240 m. In the Arctic, the upper slope fauna emerges far onto the shelf at
a depth of only 10 m. Largely on the basis of isopod data form the Arctic, Antarctic, the western
north Atlantic and the Peruvian coast at 12°C, a global pattern was proposed in which shelf fauna
extended deeper down the continental slope in the tropics, with the AZT and abyssal fauna beneath
214
© 2005 by R.N Gibson, R.J.A. Atkinson and J.D.M. Gordon
3597_book.fm Page 215 Friday, May 20, 2005 6:26 PM
ZONATION OF DEEP BIOTA ON CONTINENTAL MARGINS
it. From mid to high latitudes, these faunal boundaries paralleled shallowing cold water isotherms.
From mid latitudes to the equator, where the thermocline narrows, the faunal boundaries run counter
to isotherms. This speculative pattern and faunal zonation in the eurythermal Mediterranean led to
the proposition that temperature variation rather than absolute values might be the actual determinants of boundaries.
Syntheses of extensive Russian sampling (Zenkevitch 1963; Zezina 1997) have employed a
taxonomically wider range of species with emphasis on the Arctic and Pacific Oceans. The bathyal
(archibenthal) region is defined as lying between 200–3000 m, with shelf fauna above and abyssal
below that generally conform with the topography. The bathyal region is divided into upper and
lower subregions at approximately 700 m. Using brachiopods as an example, the 700 m line marks
the depth at which faunal change becomes relatively uniform. Physically, that depth also marks a
transition from seven climatically influenced latitudinal regions to only three. No deeper boundaries
are proposed, but it is noted that water mass properties, especially temperature, are viewed as
important zoogeographic factors down to a depth of 2000 m, where food supply becomes the most
important factor. The importance of food supply is detailed in a companion review of abyssal studies
by Sokolova (1997) that did not otherwise treat depth distribution. In partial agreement with Menzies
et al. (1973), down slope extensions of shelf species are noted for select taxa of brachiopods and
echinoderms in tropical regions. This is more pronounced on western basin margins than on eastern.
In many respects, observations and syntheses published in and before the 1970s reflected the
status of deep-sea studies prior to the last two biogeographic milestones, the development of modern
ecological theory and of relational database analysis. A great deal was known about the ocean,
more had been learned about its fauna, but there was little theory to help direct synthesis and few
tools with which to undertake multispecies analysis. A new ecological era of deep-sea studies began
in the 1960s marked by publication of the results of the Gay Head-Bermuda (Sanders et al. 1965).
More data were being gathered with an emphasis on the macrofauna and increasing access to
computers made multivariate analyses the logical tool for investigation of Hutchinson’s multidimensional niche. Hutchinson (1957) introduced the concept that a unified approach to the many
dissimilar factors controlling populations could be achieved if factors are treated as spatial dimensions. Accepting that there can be a geometric description of depth, pressure, temperature, food
availability, sediment properties and other factors, the geometric models underlying multivariate
statistics offer a powerful means of analysis and parsimonious description. Most importantly, there
was a rich body of theory emerging that sought to explain patterns in terms of resource utilisation
and biological interactions. In this newer context, Carney et al. (1983) presented a review of depth
patterns and approaches to pattern analysis. Data beyond that treated by Menzies et al. (1973) came
from megafauna and macrofauna in the northeast Pacific and northwest Atlantic. There was general
agreement that the shelf fauna extended slightly beyond the shelf break to 200–300 m. The AZT
(bathyal fauna) followed to a depth of 300–1700 m with a possible subdivision into upper and
lower parts at about 700–1000 m. Below these an abyssal zone started at 1400–1700 m and extended
to a depth of 5000 m. Less distinct subdivisions into upper abyssal and mesoabyssal could be found
in some datasets.
In their seminal synthesis of deep-sea information, Gage & Tyler (1999) provided a broad
review of the topic of zonation stressing the overall consistency of a bathyal-to-abyssal transition
and favouring a multiple-factor cause for the observed patterns of turnover. Since this review,
numerous deep faunal surveys have been undertaken. The transition from shelf to slope has been
described many times, and deeper faunal changes examined in somewhat fewer cases. There is still
too much difference in the analytical approaches used to confidently compare results. Tentative
comparisons are, however, cautiously possible due to some common use of inter-depth rates of
change as advocated by Ekman (1953) and intra-sample analysis of similarity by ordination and
215
© 2005 by R.N Gibson, R.J.A. Atkinson and J.D.M. Gordon
3597_book.fm Page 216 Friday, May 20, 2005 6:26 PM
ROBERT S. CARNEY
clustering as advocated by Carney at al. (1983). Before examining case histories, it is appropriate
to examine the refinement in ecological theory with respect to biogeography that has taken place.
Consistent definitions
A variety of terms have been used in terrestrial and marine biogeography to describe largely similar
aspects of distribution. The extent to which particular words are used neutrally or imply certain
ecological processes varies greatly among disciplines and workers. The intent of this review is to
use terms such as ‘zonation’ in an ecologically neutral sense and to avoid terms that imply function.
When discussing distributions on the continental margin, terms from geomorphology (i.e., ‘shelf’,
‘slope’, ‘rise’ and ‘abyss’) are preferred. Consistent with the usage of Gage and Tyler (1999),
‘bathyal’ refers to depths between 200 and 3000 m. ‘Abyssal’ refers to depths greater than 3000 m.
To avoid contributing to the ecological confusion the following definitions will be used:
Zonation — A pattern of species occurrence across space in which all or some species are
restricted to single zones smaller than the entire domain and crossing the domain in parallel.
The alignment of zones implies, but does not prove, the presence of controlling gradients
lying perpendicularly across the domain. In the case of continental margins, zones run
parallel to isobaths and causal gradients are aligned with depth.
Homogenous Zone — A region in a larger domain in which many species present share
common upper and lower boundaries, defining the overall boundaries of the zone. Few
species appear or drop out within the homogenous zone.
Transition Zone — a region in a larger domain in which few to none of the species present
share common upper or lower depth limits. Many species occur first, last or both across
the transition zone.
Biocoenosis — An interacting community of organisms in which the presence of all is to
some degree dependent upon some set of the others. An homogenous zone may be a
biocoenosis or not. Correct application of the term biocoenosis or community requires
knowledge of interactions, and both are avoided herein.
Ecotone — A transitional region between two biocoenoses. As a region of transition from
one set of species to another, it is assumed that structuring interactions within the ecotone
are different than within either of the adjacent biocoenosis. A transition zone may be an
ecotone or not. The term ecotone is avoided herein.
Coenocline — An ecosystem characterised across its entirety by changing conditions and
biota. Interactions among components change with the various gradients. The continental
margins may be most effectively conceptualised as coenoclines, but until structuring
processes are known, the term will be avoided.
Faunal Change — The gains and losses in species composition encountered across a domain
characterised by zonation. The expression species replacement (Rex 1983) is preferred when
the functional equivalence of species is known but is avoided herein due to a lack of certainty.
Controlling gradients
Suggestions as to the major environmental factors that might influence depth distribution have been
put forward since the earliest deep trawling results. Recognising the proven importance of physiology, the list includes the well-measured abiotic factors: absence of light, high hydrostatic pressure,
low temperature and an oxygen minimum zone. The declining availability of food with depth has
always been considered a very important factor, but one that has been very hard to quantify. Water
216
© 2005 by R.N Gibson, R.J.A. Atkinson and J.D.M. Gordon
3597_book.fm Page 217 Friday, May 20, 2005 6:26 PM
ZONATION OF DEEP BIOTA ON CONTINENTAL MARGINS
mass and nature of substrate have also been frequently suggested, but the causal mechanisms have
not been made clear. More recently, biotic factors have been proposed such as predation, competition, dispersion, etc. These, however, are very hard to take from their theoretical origins into an
acceptably rigorous field application in the great depths.
This review will focus upon light, temperature, hydrostatic pressure, and food availability. The
influence of water masses will be considered briefly in conjunction with temperature. Geological
processes and aspects of the sea floor are broadly important in deep-sea ecology (Etter & Grassle
1992, Glover et al. 2001, Escobar-Briones & Villalobos-Hiriart 2003) but manifest effects over such
a wide range of spatial and temporal scales that separate reviews are required. Biological factors
such as predation and competition will be considered but not discussed in detail. The most glaring
omission is a detailed consideration of the oxygen minimum zone. Low oxygen levels along large
portions of the upper continental slope are of proven ecological consequence, creating a zone of
characteristic processes and biota. This topic has been comprehensively reviewed and a new
synthesis of ideas developed by Levin (2003).
Focusing on only four factors, this review intends to assess the current state of knowledge and
to re-examine the likelihood that each factor alone may set boundaries on deep-sea distributions.
Special attention is given to hydrostatic pressure due to recent advances in the understanding of
pressure adaptation. Similarly, there has been a tremendous increase in knowledge about carbon
flux into the deep ocean, making it easier to discuss the role of food availability. The topic of
carbon flux leads to a brief consideration of deep high-sulphide environments (Tunnicliffe et al.
2002, Levin, 2005), a new area of research that is beginning to find commonality among hydrothermal vents, cold seeps, gas hydrate exposures and large carcass falls. These special habitats exist
against a much larger background of a depth-restricted biota.
Effects of decreasing light
Light is not often discussed as a factor in depth-range restriction since the deep environment is
generally viewed as lacking sunlight. In clear ocean water, however, sufficient light for visual
predation and predator avoidance may penetrate as deep as 1000 m (Denton 1990, Shelton et al.
1992, Johnson et al. 2002). Childress (1995) reviewed the topic of depth adaptation of metabolic
rates and put forward the novel hypothesis that evolutionary pressures in a lighted upper slope
region as compared with a dark region below 1000 m had a profound effect upon the types of
organisms found in the two regions. A marked metabolic rate decrease with depth beyond that
explained by lower temperatures was found in vision-dependent pelagic fishes, crustaceans and
squid. This decrease was absent from less vision-dependent pelagic invertebrates and benthic forms.
The possibility that the reductions were adaptations to low oxygen was dismissed due to phylogenetic
and geographic inconsistencies. Childress’ twilight hypothesis is that the meagre light penetrating
to the bottom at depths >500 m is sufficient for visual prey detection and predator avoidance. For
some species, evolutionary success in this twilight zone required retention or adoption of locomotor
capabilities of high metabolic cost. These same capabilities have been lost during the evolution of
fauna successful in deeper, dark waters. While Childress exempts the benthos from the twilight
hypothesis it may apply to some epifauna and benthopelagic forms.
Hydrostatic pressure and a piezo-barrier to distribution
Hydrostatic pressure is the only environmental variable of the deep sea directly related to depth
throughout the ocean. The hydrostatic pressure experienced at the seafloor is determined by the
weight of the overlying water column. Precise calculation of pressure requires integration of the
217
© 2005 by R.N Gibson, R.J.A. Atkinson and J.D.M. Gordon
3597_book.fm Page 218 Friday, May 20, 2005 6:26 PM
ROBERT S. CARNEY
water’s mass from surface to bottom. As defined by the equation of state (Feistal 2003), density
varies through this depth range due to temperature, salinity, compression and local gravity. The net
effect is that pressure is a curvilinear function of depth and latitude. A quadratic approximation
(Saunders 1981) has been developed assuming a standard ocean at 0ºC and 35 Practical Salinity
Units (PSU) from surface to bottom. The high precision of this approximation is considered
unnecessary for biological studies, and the common practice is to calculate pressure as a linear
function of depth equating 10 m with an increase of 101.3 kPa (1 atmosphere) assuming a uniform
water density of 1.028 103 kg m–3. The error associated with the simpler linear function vs. the
quadratic is only 1% at 1000 m and 2% at 10,000 m.
Basis for pressure effects
The primary effect of high hydrostatic pressure on living and abiotic systems can be expected to
cause shifts in chemical reaction rates because pressure is a thermodynamic parameter that accelerates or retards reaction rates. The theoretical effect of pressure is predicted from the partial molar
volume (volume of one mole) change during reaction. Formally termed the ‘Le Châtelier effect’
(Hamann 1980), the thermodynamic equation predicts that pressure promotes reactions in which
the molar volume of the products of a chemical reaction are less than the molar volumes of the
reactants. Pressure retards reactions in which there is a volume expansion. Conceptually, the Le
Châtelier effect applies to a wide range of biologically important reactions involving covalent
bonding, ionic dissociations and enzyme kinetics. The actual nature and extent of pressure effects,
however, may or may not be well predicted for macromolecules and other complex systems in
which structural conformations are important to reaction rates.
Pressure effects on abiotic chemical systems
Sea water is a solution of ions, many of which are biochemically important. The exact chemical
species in which these ions exist is determined by dissociation kinetics. As with other reactions,
hydrostatic pressure can be important in controlling ionic equilibria and may be a factor in
adaptation to great depth. Unfortunately, the full breadth of pressure effects on biologically important inorganic reactions can not be determined since very few reactions have been studied at greatly
elevated pressures. The known effects are effectively treated by Millero (2000). The most often
mentioned ionic equilibrium as a factor in depth restriction is the solubility of calcium carbonate.
Increased dissolution is promoted by hydrostatic pressure, due to a slightly reduced molar volume
of the dissociated ions Ca++ and CO4–. Therefore, the metabolic cost of maintaining calcium
carbonate shells and ossicles must be progressively greater in deep water. This could explain the
limited molluscan fauna below 3000 m which are typified by simple shell morphologies (McClain
et al. 2004), a decline in carbonate Foraminifera (Gooday 2002, 2003), and a similar decline in
heavily ossified echinoderms. It can be speculated that pressure also influences chemosynthesis
based upon H2S by altering the ionic equilibria among its chemical species.
Hydrostatic pressure is also a critical factor in the phases of gases. Usually in the deep sea,
biologically important gases like oxygen, carbon dioxide, methane and hydrogen sulphide exist in
under-saturated solutions, and gas/liquid/solid phase is not an issue. It is now very well established
that solid methane hydrates are stable and form outcrops on the deep-sea floor even when the source
solutions are very dilute (Sloan 2003). Hydrates consist of a cage of water molecules filled with
gas molecules. Methane hydrates are stable at temperatures below 5°C and at pressures greater
than 450 kPa (450 m depth). Exposed hydrates have been found to support dense, single species
populations of polychaetes (Fisher et al. 2000) and shrimp (Van Dover et al. 2003), presumably by
218
© 2005 by R.N Gibson, R.J.A. Atkinson and J.D.M. Gordon
3597_book.fm Page 219 Friday, May 20, 2005 6:26 PM
ZONATION OF DEEP BIOTA ON CONTINENTAL MARGINS
providing a rich microbial food source. A more conjectural relationship may exist between the
fauna at hydrocarbon seeps such that seeps associated with methane hydrates have greater longterm stability and an associated fauna (Carney 1994, Sahling et al. 2002, 2003).
Pressure effects on organic systems
Virtually all discussions of deep-sea distributions mention pressure as a possibly important factor.
Typically, a reference or two to the literature of high pressure physiology are made, and then the
discussion moves to another topic. Such polite brevity stemmed from two problems. First, there
was not much research to reference, and second, the most substantial studies were so molecular as
to have little immediate ecological application. Fortunately, the situation has now progressed to the
point at which such studies are becoming more prevalent and ecologically relevant. It is increasingly
obvious that the deep-sea fauna must have adaptations to high hydrostatic pressure. The absence
of such adaptation or pre-adaptation prevents shallow species from entering deep water. The reverse
may also be true; organisms adapted to high pressure may be unable to successfully expand upward
into lower pressure environments. What is still lacking, unfortunately, is a good sense of what
pressures and pressure changes are important to species depth limitation.
Pressure research on isolated biochemical systems has focused on enzymatic proteins and
lipoprotein membranes. Much of this research exploits pressure as a thermodynamic biotechnology
tool (Balny et al. 2002, Kornblatt & Kornblatt 2002) and has little apparent ecological value.
Somewhat greater relevance can be found in studies that seek biotechnical application for deepadapted organisms (Abe et al. 1999, Ludwig 1999, Heremans 2004). All these studies show dramatic
pressure effects that could restrict the depth range of organisms.
With respect to proteins, pressure denaturation of proteins caused by an unfolding from the
native form is well known. Thermodynamically, the transition is assumed to be associated with a
decrease in molar volume. The actual measured volume changes, however, appear to be too small
to account for the profound effect on protein function (Chalikian & Breslauer 1996), indicating
that a better theoretical model relating pressure to effect awaits development. Hydration of the
unfolded protein may be hiding a greater volume change (Hummer et al. 1998) and compressibility
may be a factor (Prehoda et al. 1998).
Coming closer to ecological application, a model of protein adaptations to low temperature
and high pressure has been proposed (Hochachka & Somero 2002, Somero 2003) that stresses the
necessity of adaptation to the deep-sea environment. Presently, the model is still descriptive and
does not lead to prediction about specific pressure barriers. According to the model, maintenance
of critical enzyme functionality under different conditions of temperature and pressure can be
accomplished through changes in the amino acid sequence of the enzyme, or may also be controlled
by stabilising compounds in the intercellular milieu.
Both types of pressure adaptation have been proven in vitro but for very few organisms and
enzyme systems. Functional depth adaptation has been shown in pressure studies on three categories
of dehydrogenases, and 600 m suggested as a critical threshold depth (Somero 1998). The effect
of pressure on reaction rates was minimal in deep-water species, but great on shallow-water species.
The genetic differences associated with these pressure adaptations have yet to be determined. The
presence and importance of compounds that stabilise enzymes in depth-adapted species has been
confirmed for osmolyte trimethylamine oxide (Yancey & Siebenaller 1999) and a variety of suspected pressure-mediating compounds has been reported from deep fish and invertebrates and
microbes (Yancey & Siebenaller 1999, Martin et al. 2002, Siebenaller & Garrett 2002).
The fluidity of bio-membranes is so greatly reduced by increased pressure and decreased
temperature that survival at depth requires homeoviscous (Siebenaller & Garrett 2002) adaptations
219
© 2005 by R.N Gibson, R.J.A. Atkinson and J.D.M. Gordon
3597_book.fm Page 220 Friday, May 20, 2005 6:26 PM
ROBERT S. CARNEY
in membrane structure and composition (Hazel & Williams 1990). One mode of adaptation to
elevated pressure is the accumulation of higher levels of lipid (Hazel 1995). The protein component
of membranes may show depth adaptations similar to the Somero model; pressure-influenced
changes in transmembrane signalling have been demonstrated (Siebenaller & Garrett 2002). With
respect to a whole organism, behaviour responses of a deep hydrothermal vent crab to pressure
and temperature were consistent with homeoviscous effects (Airriess & Childress 1994). Due to
the prevalence of gelatinous and membranous megafauna in the deep sea, it is interesting to speculate
that the bio-mechanical properties of these tissues are actually different at high pressure than at
low. Pressure may play an important role in the design of some abyssal fauna.
Independent of molecular results, researchers attempting to recover deep-sea organisms for
laboratory studies at one atmosphere or in pressure aquaria have acquired some practical experience
about pressure barriers. The findings are mixed; some organisms are strongly influenced by a
pressure decrease, while others are much more thermally sensitive (Childress et al. 1978). Some
hadal bacteria were found to die upon decompression, while other hadal and abyssal forms merely
remained inactive until recompressed (Yayanos 1995, Bartlett 2002). Benthic Foraminifera collected
above 2800 m survive and reproduce in cold aquaria at 1 atm, while deeper specimens do not
survive decompression. Only 6 of 421 specimens of scavenging amphipods survived decompression
from 1920 and 4420 m. (Heinz et al. 2002).
Acute pressurisation of shallow-water species has been attempted to test an organism’s ability
to survive in the deep sea (Menzies & George 1972a,b) but it remains unclear how to relate such
short-term mortality to long-term acclimation. The only long-term shallow-to-deep transplant study
appears to be that of Maldonado and Young (1998) who transplanted two species of keratose
sponges, normally limited to depths shallower than 40 m to 100, 200 and 300 m. Transplants below
200 m depth died, but some of the others survived for as long as 12 months, the duration of the
experiment. It was speculated that the observed depth restriction was due to pressure sensitivity of
larvae below 200 m and sensitivity of mature colonies below that depth.
A series of pressure studies on shallow- and deep-water echinoid larvae have produced very
interesting results. Larvae from shallow-water species remained viable at pressures of 10–15 MPa
(1000–1500 m). This was demonstrated for three Mediterranean species (Young et al. 1997) and a
single Antarctic species (Tyler et al. 2000). When three species of the echinoid genus Echinus were
studied, larvae of the shallower forms could also survive well below the depth limit of the adults.
Larvae of the deep form, E. echinus, to the contrary had pressure requirements similar to that of
the adult, and needed 10 MPa (1000 m depth) to develop (Tyler & Young 1998). Countering the
likelihood that all deep-sea animals have larvae restricted to high pressures is the finding of some
deep larvae in upper ocean samples (<200 m) (Pawson et al. 2003, Young 2003). The extent to
which other deep invertebrates disperse upward or are pressure restricted remains unknown. As a
cautionary note, however, survival at high pressures under experimental conditions may have little
correlation with settlement success.
In conclusion, there is a growing body of evidence that high hydrostatic pressure imposes lethal
limits on distribution by impacting biochemical or inorganic reactions. The nature and location of
piezo barriers remain speculative. Based upon the dramatic effect of pressure on enzyme systems
in shallower organisms, it can be suggested that there is an upper piezo barrier to downward
colonisation located between 500 and 1000 m. Except in high latitude oceans, this barrier coincides
with the cooling across the permanent thermocline. Based on larval and decompression studies,
some continental slope species may be prevented from deeper colonisation by a second piezo barrier
between 2000 and 3000 m. If true pressure insensitive enzyme systems have been selected in deepadapted organisms, then piezo barriers to upward colonisation should not exist.
220
© 2005 by R.N Gibson, R.J.A. Atkinson and J.D.M. Gordon
3597_book.fm Page 221 Friday, May 20, 2005 6:26 PM
ZONATION OF DEEP BIOTA ON CONTINENTAL MARGINS
Temperature and thermal barriers to distribution
Water temperature is an extremely appealing factor when seeking the cause of deep-sea distributions,
because its physiological importance has been so well established at the organism and biochemical
level. Over ecological and evolutionary timescales, it is a definite barrier in shallow water on a
global scale; cold and warm regions have very different biota. Temperature figured so prominently
in early zonation schemes that the 10 and 4°C isotherm were assigned special importance (Bruun
1957).
For many years, the compilation of Mantyla & Reid (1983) has been used to describe the
general physical properties of the deep sea. Generally accurate, that account provided a fairly static
picture of the depth gradient of temperature. A more dynamic view is now under development
based on studies like the World Ocean Circulation Experiment and other programmes that make
data available online through national oceanographic data centres. The thermal gradient of the
ocean reflects density stratification and changes in an orderly manner as determined by the local
aspects of the global thermohaline circulation pattern. Between 55°N and 55°S, a warmer layer of
low density water floats upon colder high density water. The warm layer is created by a net solar
heating and limited downward mixing. The cold layer is created by net heat loss where solar input
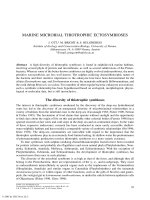
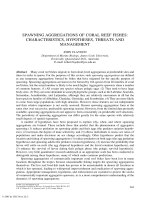
is diluted by the curvature of the Earth at latitudes above 55°N and 55°S (Figure 1). The sharp
transition with depth from warm to cold is termed the permanent thermocline. The temperature
change across the thermocline may be a barrier to upward colonisation of deep/cold species and
downward colonisation of shallow/warm species.
Basis for thermal effects
In this review only the direct physiological effects of temperature are considered. Indirect effects
caused by increased viscosity at low temperatures can be important on the micro-spatial scales of
larval movement and ciliary suspension feeding (Podolsky & Emlet 1993, Podolsky 1994), but
there is insufficient information for review. As a thermodynamic parameter, increasing temperature
increases chemical reaction rates. Deep animals moving upward across the thermocline must control
the temperature-induced metabolic rate increases and shallow animals moving deeper must adjust
the temperature-induced rate decreases.
The effect of temperature on rates of isolated and whole organism systems has been studied
for more than a century and found to fall within a narrow range. For each 10° temperature increase,
rates (expressed as Q10) change by a factor of ×2 to ×3. Thus, crossing a 10°C thermocline would
double or triple the rates for an organism moving upward and the converse for an organism moving
downward. Once below the thermocline, deeper penetration encounters only slightly reduced
temperatures.
The fact that the deep-sea and polar regions are inhabited by a diverse fauna makes it obvious
that temperature effects can be overcome. Three basic strategies seen in successful adaptation to
cold habitats are (1) increasing the concentration of enzymes, (2) adopting enzymes that are more
effective at low temperatures and (3) incorporating modulator compounds that help maintain enzyme
reactions over a range of temperatures (Hochachka & Somero 1973, Clarke 1998). This cold
adaptation model has been updated (Clarke 1998, Hochachka & Somero 2002, Somero 2003) with
greater emphasis on the nature of enzyme adaptation and rate modulation. Enzymatic reaction rates
can be maintained in cold-adapted organisms via selection for changes in relatively few amino
acids at critical positions in a protein chain. These replacements serve to lower the enthalpy
necessary for the reaction to proceed. Modulation of enzyme processes is seen as being dependent
upon low molecular weight, intercellular organic compounds. Categorised as osmolytes (in reference
221
© 2005 by R.N Gibson, R.J.A. Atkinson and J.D.M. Gordon
3597_book.fm Page 222 Friday, May 20, 2005 6:26 PM
ROBERT S. CARNEY
87°S
176°W
100 m
>0 0
1000 m
Chatham
Rise
20 25
15
5
10
5
2
88°N
166°W
00
151°E
5
>0
<0
1500 m
2
2
2000 m
4000 m
West Pacific Margin
88°S
71°W
100 m
1000 m
00
20 83°W
10
15
0
5
Cascadia
Basin
25
60°N
150°W
5
5
2
1500 m
2
2
2000 m
4000 m
East Pacific Margin
87°S
52°W
100 m
1000 m
0
<0
20
2
00
Caribbean
25 39°W Inflow
10
5
Cape
Hatteras
15
10
5
1500 m
2
2 2
78°N
75°W
0
<0
2
2000 m
4000 m
2
West Atlantic Margin
86°S
22°W
100 m
1000 m
20
0
2
5
00
25 06°E
10
Straits of
Gibraltar
15
10
1500 m
2000 m
4000 m
Porcupine 88°N
Seabight 03°W
5
2 0
<0
5
0
<0
East Atlantic Margin
Figure 1 Continental margin temperature sections. If faunal zonation is primarily due to density stratification
of the ocean, zones should follow isotherms with marked high latitude shallowing. Average annual temperature
along continental margins varies with depth as a function of latitude and whether the margin is the eastern or
western edge. The greater width of the Pacific and its isolation from the Arctic Ocean result in more
geographically uniform temperature gradients than are found in the Atlantic. The irregular sections follow
continental contours from north to south and are based on the World Ocean 2001 High Resolution (1/4 degree)
Temperature and Salinity Analysis (Anonymous 2004). The depth scale exaggerates conditions at upper slope
depths. Arrows indicate locations where faunal zonation is discussed in detail.
to a possible osmoregulatory role), these compounds are critical to maintaining a variety of cellular
functions in the face of stresses such as temperature and pressure. Given the low food availability
in deep water, the possibility of incomplete temperature compensation for protein synthesis is
especially intriguing. As summarised by Clarke (1998), there is evidence that the rates of protein
222
© 2005 by R.N Gibson, R.J.A. Atkinson and J.D.M. Gordon
3597_book.fm Page 223 Friday, May 20, 2005 6:26 PM
ZONATION OF DEEP BIOTA ON CONTINENTAL MARGINS
synthesis are decreased and the energetic costs of such synthesis increased by low temperatures.
Less well demonstrated, but possible, is that the relative cost of feeding is increased in cold water.
Water masses
The thermohaline circulation of the global ocean that determines the depth-related local temperature
gradient incorporates several regional processes that cool, heat, mix and transport very large volumes
of water. These water masses acquire distinctive temperature, salinity, and chemical characteristics
in their regions of origin. These traits are maintained over thousands of kilometres of transport,
gradually being altered by additional mixing and chemical cycles. Every part of the deep-sea floor
is bathed either by a single or a combination of water masses.
The perspective taken in this review is that the primary effect on species depth distributions is
primarily associated with temperature. Acceptable on ecological timescales, this view may very
easily be invalid when evolutionary timescales are considered; water mass movement influences
the routes and rates of deep larval transport. Except for a few small areas in the ocean, water masses
are stratified by density. Over these large areas of density stratification, temperature is progressively
colder with depth, except where salinity is atypically high at depth or low near the surface. The
view that temperature is the most important factor in limiting depth distribution is not universally
shared. Many studies reporting depth distributions that appear to be well explained by temperature
are careful to identify the local water masses as if there might be some additional cause of
distribution. Especially in the case of deep-sea benthic Foraminifera, there has been a tradition of
explaining paleo-distributions in terms of shifting water masses.
The literature dealing with use of benthic Foraminifera as proxies for water masses is extensive,
and few studies attempt to examine the validity of the assumed relationship. Van der Zwaan et al.
(1999) take a negative view of the practice, noting that it originated out of a lack of consistent
correlation with simple factors such as has been found for pelagic species. Furthermore, no
satisfactory ecological explanation for a link has been proposed. Gooday (2003) has provided a
more neutral review, treating water mass control as still reasonable along with other distribution
models. As will be discussed in the following section, there is increasing success in interpretation
of foraminiferan assemblages in terms of detritus influx rather than water mass exposure.
Depth barriers linked to the influx of labile organic material
Since Forbes (1859) proposed an azoic zone beginning at 600 m, the dramatic decline of available
food in the aphotic deep sea has been appreciated to exert a strong selective pressure upon the
species dwelling there, and to be a causative link to large-scale distributions (Carney 1989, Jumars
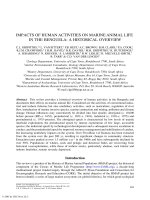
et al. 1990). Somewhat similar to temperature, the surface productivity that drives detritus influx
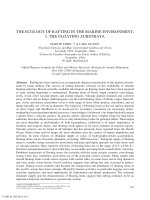
displays global patterns (Figure 2) (Berger 1989, O’Brien et al. 2002). There has now been so much
research on the geochemical aspects of organic detritus in the deep ocean that it is possible to reexamine the role of detritus influx and to progress beyond previous speculation. The material
presented herein is a selective review of influx studies intended to stress those aspects most closely
related to species distributions rather than the more obvious relationship with benthic biomass. It
is well established that less food produces less biomass (Rowe 1983, 1998) but the contention that
less food results in species composition shifts needs a thorough appraisal. The proposal explored
and developed in this review is that in the deep environment dominated by detritus and resuspension
feeders, a gradient of food influx constrains species depth distributions. That gradient can be easily
demonstrated for influx rates and somewhat more tentatively identified in terms of changes in food
type. The argument for depth distribution controlled by a gradient in influx rate has been most fully
223
© 2005 by R.N Gibson, R.J.A. Atkinson and J.D.M. Gordon
3597_book.fm Page 224 Friday, May 20, 2005 6:26 PM
ROBERT S. CARNEY
Grams
87°S
176°W
200
Chatham
Rise
88°N
166°W
00
151°E
150
100
50
0
West Pacific Margin
200
Cascadia
Basin
00
83°W
88°S
71°W
60°N
150°W
Grams
150
100
50
0
East Pacific Margin
Caribbean
00
39°W Inflow
87°S
200 52°W
Cape
Hatteras
78°N
75°W
Grams
150
100
50
0
West Atlantic Margin
200
00
06°E
86°S
22°W
Straits of
Gibraltar
Porcupine 88°N
Seabight 03°W
Grams
150
100
50
0
East Atlantic Margin
Figure 2 Surface productivity. If faunal zonation is primarily due to the rate of organic detritus influx, zones
should follow influx rates and show marked high latitude deepening. The proxy for influx is the estimated
total weight of chlorophyll in a 50 m3 column for water from the surface to 50 m depth based on data in the
World Ocean Atlas 2001 (O’Brien et al. 2002). The irregular sections are the same as used in Figure 1.
developed for benthic Foraminifera in the form of the trophic and oxygen (TROX) model. An
extension of TROX to other faunal groups will be considered.
Before examining possible control of species distributions by detritus influx, the negative results
of Watts et al. (1992) deserve attention as a matter of caution. These workers sought relationships
between productivity, as estimated from remote satellite values for surface plankton pigments, and
benthic biomass and species diversity in a well-studied region of the northwest Atlantic margin.
The results were especially interesting. Use of partial correlations showed that benthic biomass
and diversity were highly correlated with depth when the effect of surface productivity was removed,
but only weakly or uncorrelated with productivity when depth effects were removed. After posing
several alternatives, Watts et al. concluded that deep benthic processes were uncoupled from surface
productivity on the scale of the study. Flux may regulate benthic species composition but proving
224
© 2005 by R.N Gibson, R.J.A. Atkinson and J.D.M. Gordon
3597_book.fm Page 225 Friday, May 20, 2005 6:26 PM
ZONATION OF DEEP BIOTA ON CONTINENTAL MARGINS
the link may be difficult in the sense that measurement of surface production and particle flux rates
may be only poorly related to the food resource availability actually experienced by the benthic
fauna.
Depth relations of detritus influx
The ecological conceptualisation of organic detritus influx to the deep benthos is rapidly developing
as studies shift from a description of long-term averages to one of short-term variations of unexpected
form and magnitude. The modern view of influx based on improved particle-flux methodology was
first articulated by McCave (1975) and more fully developed subsequently. The detritus that reaches
the deep benthos is the remnant of organic matter that escaped consumption in the upper ocean.
Particles aggregate and disaggregate mostly in the biologically active upper ocean (Dilling &
Alldredge 2000). Eventually, ballasted by bio-mineral silica and carbonate (Armstrong et al. 2002),
detritus particles sink to the bottom. While the mineral component preserves some of the organic
material (Ingalls et al. 2003), the microbial populations within the detritus continually degrade the
labile organics (Karl et al. 1988, Minor et al. 2003). The kinetics of bacterial utilisation is such
that a fixed percentage of the available substrate is consumed per unit time. As a result, there is a
negative exponential decline with depth in the remaining labile substrate. Declining detritus influx
is directly reflected in declining benthic biomass (Rowe 1983). The general depth-dependent
decrease of organic detritus was expressed as a declining proportion of surface productivity using
compiled sediment trap data (Suess 1980). Similar, more refined models have since been developed
to meet the needs of global carbon studies. Some models are based upon benthic respiration rather
than the estimation of flux (e.g., Jahnke 1996, Andersson et al. 2004) but all models incorporate
an exponential decrease of detritus influx.
Beginning in the mid 1980s, there was a progressive paradigm change concerning the overall
temporal and spatial stability of the deep sea. Although thermally uncoupled from local climate
swings, the bottom can be highly seasonal due to pulses of detritus influx and spatially complex
due to the heterogeneity of detritus patches. Beaulieu (2002) provided an informative review that
began with the observation of such patches in bottom photography (Billett et al. 1983, Lampitt
1985). Most studies on the effects of detritus patches have been carried out on relatively small
scales, making the relevance to studies of larger-scale depth distribution unclear at this time.
Important exceptions to the models that predict influx as a simple function of depth are areas
on the mid to upper continental slope that receive increased detritus input from coastal upwelling
or material exported across the continental shelf. Continental shelves are the site of high primary
productivity, but most of the labile fixed carbon is consumed by the local biota, leaving little to be
exported to slope fauna (Rowe et al. 1986, Liu et al. 2000). This is not the case in areas where
strong western boundary currents turn seaward carrying more productive water across the slope
(Liu et al. 2000). These restricted regions of increased influx at depth should offer an opportunity
to test theories about influx rates and species depth ranges. Two examples will be discussed in a
later section on selected regional studies, Chatham Rise off New Zealand and the northwest Atlantic
off Cape Hatteras, North Carolina, U.S.
When labile detritus arrives at the bottom by any route, it is rapidly consumed either on the
sediment-water interface, in resuspension above the bottom, and within the sediment mixed layer
(Carney 1989). Incorporation of the detritus into the sediment greatly affects the geochemical nature
of sedimentary microhabitats. There appears to be a depth difference in how rapidly fresh detritus
is incorporated into the sediment. Isotope labelling studies indicate a more rapid downward mixing
into the sediment on the upper slope (<1500 m) than at abyssal depths (Blair et al. 1996, Aberle &
Witte 2003, Witte et al. 2003). This difference might be a factor in the distribution of deposit
feeders, a possibility that will be considered later in the discussion of the TROX model.
225
© 2005 by R.N Gibson, R.J.A. Atkinson and J.D.M. Gordon
3597_book.fm Page 226 Friday, May 20, 2005 6:26 PM
ROBERT S. CARNEY
The nature of depth boundaries set by detritus influx rate
It is well established that the influx of detritus food decreases rapidly with depth and it is reasonable
to assume that deep benthic animals have special adaptations for living in a food-poor environment.
It is not, however, entirely clear how the influx gradient influences depth limits. In an environment
in which there is a strong gradient of decreasing food with depth, food limitation is more likely to
determine the lower boundary than the upper. It is unlikely that the upper boundary is directly
limited by too much food. Rather, there may be an indirect effect via competition, predation or
changes in habitat geochemistry.
In considering the manner in which detritus influx rates might control upper and lower depth
limits on distribution, the convention of treating organic detritus as a homogenate without distinctively different types will be followed. It is also assumed that detritus feeders will respond positively
to increasing food availability, and that the positive response may manifest itself in some observable
manner such as population size, average weight, gamete production, etc. This has been nicely
demonstrated for seastars (Ramirez-Llodra et al. 2002) from three abyssal regions with different
levels of detritus influx; the overall fecundity of three species was lowest at the most food-poor
site. Whatever the benefit of higher food levels to the population, it is reasonable to assume that
there is a minimum cost of foraging, selection, digestion, and assimilation that must be met by the
available detritus for the population to persist. Different species can be expected to have different
lower thresholds set by the minimal requirements.
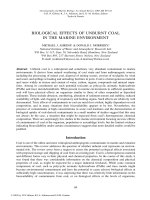
Upper depth range restriction by competition or predation may arise from the exponential
increase in food availability up slope if there are parallel increases in either predation or competition
(Figure 3A,B,E). Although it seems reasonable that higher benthic biomass up slope produces greater
competitive and predatory pressure than lower biomass down slope, theoretical studies have shown
that this supposition requires more careful examination. Detritus influx across depth can be thought
of as a productivity gradient. When terrestrial plant ecologists have examined competition associated
with productivity gradients, no consistent simple patterns were found and modelling efforts produced similarly complex results (Arii & Turkington 2001). The cause of much of the inconsistency
was associated with the dynamics of linked factors like shading, nutrients and water. The detritusbased system of the deep sea should be far simpler with fewer linked factors introducing feedback.
The results of baited camera deployments between 1500–4264 m in eastern Mediterranean
(Jones et al. 2003) provide an indication that competitive interactions may influence depth ranges
rather than just intrinsic species characteristics. The eastern Mediterranean is an extremely oligotrophic region in which food limitation could be expected to restrict organisms to shallower depths.
For large scavenging crustaceans, elasmobranchs and teleosts, the opposite seems to be the case.
Species responding to the bait occur deeper in the eastern Mediterranean than over most of their
geographic range. While food is very limited there, so is competition. The species-rich scavenger
fauna of the Atlantic is missing. Possibly, lower depth limits set by insufficient food are not simply
a matter of food influx, but also the amount of food available when in competition with other species.
Boundaries associated with kinds of detritus
Studies of species distributions and habitats for terrestrial species often examine the relationship
between herbivores and preferred forage or between predators and preferred prey. Since these
consumers specialise on and compete with other species for certain foods, total productivity is too
gross of a parameter to be informative. Similarly, the detritus feeders that dominate the deep benthos
may sense incoming detritus as different types and specialise on a particular type. If true, depth
restriction may be associated with an underlying gradient in the availability of a preferred detritus
type. Unfortunately, all that can be done in this review is to point out the likelihood that detritus
comes in many types and that detritus feeders may specialise. Strong evidence that these are factors
226
© 2005 by R.N Gibson, R.J.A. Atkinson and J.D.M. Gordon
3597_book.fm Page 227 Friday, May 20, 2005 6:26 PM
ZONATION OF DEEP BIOTA ON CONTINENTAL MARGINS
A
B
Detritus Resources
Detritus Influx Rate
Depth
Population
Sp 1
Upper
Food
Limit
Sp 2
Lower
Food
Threshold
C
Piezo-Thermal Conditions
Good
Bad
D
Redox Conditions
Bad Good
Upper
Piezo-Thermal
Limit
Redox
Associated
Limit
Competition/ E
Predation
C/P
Threshold
Figure 3 Boundaries set by detritus influx. Empirical studies have established that species zonation occurs
within a gradient of exponentially decreasing detritus influx (A). The deeper range limit of a species may be
set by too little food availability, and the upper range limit set by too much (B), but the latter seems unlikely.
The upper boundary might be controlled by a physiological limit related to pressure and temperature (C). The
TROX model (see text) explains boundaries in terms of a negative correlation between detritus and redox
conditions in the sediments (D). The limit might also be controlled by competition and predation by species
that make more efficient use of the higher influx rates up slope (E).
in depth distributions is not available. At the beginning of contemporary deep-sea ecology, Sanders
(1969) proposed that a high degree of partitioning of the detritus food supply would be expected
as a prediction of his stability-time hypothesis concerning high species richness. Thirty years later,
it was concluded that such partitioning remained to be demonstrated (Allen & Sanders 1996).
It remains reasonable to assume that detritus feeders both deep and shallow exploit different
components of the influxing detritus. The best evidence of differentiation is found in feeding
structure morphology. The depth range of polychaetes in the eastern Pacific, off the coast of southern
California, was shown to have an association with feeding types as indicated by morphology
(Fauchald & Jumars 1979). Additionally, deep holothurians display an array of distinctive tentacle
structures (Billett 1991, Roberts et al. 2000). More convincing evidence may have gone unrecognised because of the considerable difficulties in recognising resource partitioning by detritus feeders.
For example, partitioning may take place at only one or many stages starting with foraging and
progressing through sensory detection, ingestion and assimilation (Jumars & Pendry 1989).
227
© 2005 by R.N Gibson, R.J.A. Atkinson and J.D.M. Gordon
3597_book.fm Page 228 Friday, May 20, 2005 6:26 PM
ROBERT S. CARNEY
Chemical tools for studying detritus partitioning are showing encouraging results. Better biochemical characterisation of detritus processing is now beginning to point to the importance of gut
enzymes and surfactants (Mayer et al. 1997, Dell’Anno et al. 2000, Roberts et al. 2000, 2001).
Similarly, molecular marker techniques applied to holothurian gut sediments from a wide depth
range have demonstrated partitioning as revealed by phytoplankton pigments (Hudson et al. 2003).
Additionally, lipids were used to show partitioning in co-occurring asteroids (Howell et al. 2003,
2004a). An examination of the digestive abilities and detritus partitioning in more species across
a broad depth range remains a highly attractive task to be undertaken.
The possibility that detritus encountered on the bottom at different depths is of different types
is closely linked to the question of the ‘quality’ of the detritus. Organic geochemists have been
attracted to the quality question to help assign rates to carbon cycling models. High-quality detritus
is labile and converted to biomass and carbon dioxide much faster that refractory, poor-quality
detritus. Assessment of quality is controversial with few of the methods used in shallow water
analysis having been applied over a wide depth range. In the 1930s, bacterial bioassay was attempted
with a finding of decreased quality with depth (Waksman & Hotchkiss 1937). Contemporary
analyses employ a more geochemical approach, e.g., ATP, pigments, lipids, amino acids, other main
classes of organic compounds, etc. (Tselepides et al. 2000b, Danovaro et al. 2001, Gremare et al.
2003). The results are all in general agreement: the deeper the bottom the lower the apparent quality
of the detritus.
TROX: a model for flux control of foraminiferan distributions
Presently, benthic Foraminifera afford the best information about deep-ocean distributions and there
is a strong tradition of identifying possible causative factors. Fortunately, there are two excellent
summaries available. The biology and ecology of benthic foraminiferans are reviewed by multiple
authors in Sen Gupta (1999). Especially relevant to large-scale deep-sea biology is the review by
Gooday (2003), which comprehensively examines proposed controlling factors recorded in foraminiferan distribution patterns. The development of the TROX model represents an interesting
transition from largely physiological to trophic explanations of distribution.
The TROX model was proposed by Loubere and associates (Loubere et al. 1993a, Loubere &
Fariduddin 1999) and has received careful review and wide acceptance (Van der Zwaan et al. 1999,
Gooday 2003). This model explains the distribution of bathyal and abyssal Foraminifera in terms
of geochemical microhabitat availability as controlled by bottom-water oxygen and microbial
consumption of labile detritus carbon (Figure 3D). The model’s origins can be attributed to three
observations. The first is the obvious but inconsistent observation that the distribution of some
benthic Foraminifera could be explained by oxygen concentration in bottom water (Gooday 2003).
The second is the recognition of distinct microhabitat preferences found in the study of live (rose
bengal staining) Foraminifera (Corliss 1985, Gooday 1986, Jorissen 1999). The third is that the
sediment redox gradient might be ecologically important in the deep sea, even though it is less
reducing than in coastal bottoms (Carney 1989, Jumars et al. 1990).
The TROX model predicts that foraminiferan species occupy an environmental envelope defined
by a preferred oxygen level and level of food availability. Food level is determined by the rate of
labile carbon influx. Oxygen is determined by two factors: the concentration in the bottom water
and microbial oxidation of detritus within the sediment. The negative relationship between the
amount of detritus and the amount of oxygen is critical to the TROX model, and gives rise to an
interesting mechanism by which distributions can be limited by too much food. Where bottomwater oxygen is high and food levels range from moderate to poor, a fairly thick oxygenated layer
will exist in the sediments and only food will be a major controlling factor. Under oxygen-depleted
bottom water and where detritus influx is high, hypoxic and anoxic conditions will prevail in the
228
© 2005 by R.N Gibson, R.J.A. Atkinson and J.D.M. Gordon
3597_book.fm Page 229 Friday, May 20, 2005 6:26 PM
ZONATION OF DEEP BIOTA ON CONTINENTAL MARGINS
sediments and oxygen will be the primary limiting factor. Although the TROX model depends upon
a simplified concept of microhabitats, it has been effective in explaining distributions across abyssal
plains (Loubere & Fariduddin 1999) and on the deeper portion of continental slopes beyond steep
temperature gradients (Wenzhofer & Glud 2002, Licari et al. 2003).
The TROX model or variations might be successfully applied to other infauna taxa in which
an organism has a relatively limited ability to ventilate its surroundings or maintain contact with
oxygenated water (Levin & Gage 1998, Soetaert et al. 2002, Levin 2003). Simplistically, TROX-like
control is most likely for meioinfauna, less likely for macroinfauna, and unlikely mega-infauna.
Epifauna, especially larger epifauna, are unlikely to be affected unless the habitats at the sedimentwater interface are somehow influenced by underlying processes within the sediment mixed layer.
Although hard to demonstrate, the ecology and biogeochemistry of the sediment mixed layer might
exert a considerable influence upon the sediment-water interface by means of bioturbation. In effect,
sediment mixing and ventilation might structure, flavour, excavate microbial biomass to, or remove
food from the interface environment exploited by epifauna. If TROX-like processes control the
depth ranges of infauna species, parallel control may also exist for deposit feeding epifauna.
Deep reducing environments
Due to the low levels of detritus influx and high levels of dissolved oxygen outside the minimum
layer, the deep-sea sediments seldom become sufficiently reducing for hydrogen sulphide to be
produced by microbial reduction of sulphate. Therefore, deep sulphide-dependent systems are
relatively rare and depend upon unusual geochemical processes. Originally studied in isolation, a
coalition of interests and ideas is presently underway due to strong similarities in processes,
microbiota and metazoa among hydrothermal vents, continental margin seeps and deep hypoxic
bottoms. The status of this emerging field of deep-sea reducing environments has been recently
reviewed. (Tunnicliffe et al. 2002, Levin 2005). Although the intent of this review is to consider
the depth patterns of sediment-inhabiting fauna, a brief consideration of chemosynthetic assemblages is appropriate with respect to controlling factors.
Chemosynthetic organisms do not depend on detritus for energy and, unless detritus provides
nitrogen or other critical compounds, these organisms should have distributions that are independent
of organic influx. Seep and vent associated heterotrophs should be similarly independent of detritus.
With respect to depth per se abundance is independent, but faunal composition of producer and
consumer varies markedly (Van Dover et al. 2003). The morphology of long, connected ridge
systems has led to an emphasis upon geographic position of fauna (Tunnicliffe et al. 1998, Kojima
2002) that has carried over to some extent to cold seep studies (Sibuet & Olu 1998, Levin 2005).
A more detailed examination of possible depth restrictions on zonation of both chemosynthetic
systems is warranted. The likelihood of restrictions in cold seep systems is high. In the Gulf of
Mexico on the Barbados accretionary prism and on the Blake Plateau there are similar differences
in fauna above and below 1000 m (Carney 1994, Olu et al. 1997, Sibuet & Olu 1998, Van Dover
et al. 2003). This is true for producers and consumers. Similarly dramatic, the shallowest occurrence
of seep assemblages on the upper Gulf of Mexico slope at 450 m closely matches the upper limit
in the Sea of Okhotsk at 370 m (Sahling et al. 2003).
Until mapping of more vent and seep systems proves or refutes the presence of depth zonation,
discussion of causal links remains highly speculative. There are, however, several reasonable
possibilities. The first is varying predation by a suite of carnivores from the surrounding benthos
that changes with depth. Population regulation by predation has been shown experimentally for a
vent system (Micheli et al. 2002). Vagrant predators from the zoned fauna enter seeps and vents,
especially decapod crustaceans (Chevaldonne & Olu 1996) and some of these species consume
seep and vent production (MacAvoy et al. 2003). The second is speciation along the pressure
229
© 2005 by R.N Gibson, R.J.A. Atkinson and J.D.M. Gordon
3597_book.fm Page 230 Friday, May 20, 2005 6:26 PM
ROBERT S. CARNEY
gradient or pressure regulation of the necessary geochemistry. Third and most open to debate would
be the existence of an unrecognised dependence upon detritus, most likely for consumers but
possible for producers as well.
Biogeographic theory and deep-sea application
The oceanographic study of deep-sea zonation shares many points in common with the broader
field of biogeography, although minimal exchange occurs between the disciplines. This section
intends to place deep studies within this larger context and to delineate components of biogeographic
theory that are useful in understanding continental margin patterns. The components considered
are gradient analysis, the gene-flow model of restricted ranges and patterns in bounded domains.
Observations on depth patterns are compared with theoretical expectations. Finally, statistical
studies of ranges that examine empirical ‘rules’ are reviewed. All these topics have a common
origin in the contemporary study of ranges that was strongly influenced by the theories of MacArthur
(1972) and by the practical ordination studies of plant communities along gradients (coenoclines)
of Whittaker (Gauch & Whittaker 1972).
Applications of theory
Response curves
A response curve shows a measured response of a species to the gradient of a controlling environmental parameter (Figure 4A,B). The best response to measure would be a parameter closely linked
to fitness but in practice abundance or population numbers are usually used. Conceptually, a species’
population level anywhere within its range is the sum of a series of curves describing the effect of
Seastars
Range
Maximum
10
Molluscs
30
D
C
B
Mid
Range
Depth
A
Range
Minimum
Maximum
Count
Population
Size
Figure 4 Shape of response curve. A symmetrical population distribution centred about an optimal value on
a depth-associated controlling gradient (A) is expected. If greater amounts of food are available in the upper
portion of the depth range, however, there should be some skewing toward the shallow end (B). When ranges
and population centres for seastars and molluscs from the Porcupine Seabight are standardised and tallied
(C and D) combinations of both the centred and upper-skewed distributions are found.
230
© 2005 by R.N Gibson, R.J.A. Atkinson and J.D.M. Gordon
3597_book.fm Page 231 Friday, May 20, 2005 6:26 PM
ZONATION OF DEEP BIOTA ON CONTINENTAL MARGINS
each pertinent gradient. In simple systems largely controlled by a single factor, curve fitting using
a response curve can help identify that most important factor. The use of the TROX model and
other multifactor analyses in oceanography can be considered applications of a response-curve
perspective. One application of the response curve that has been extensively developed is the
gradient analysis of terrestrial plants. The simple symmetrical Gaussian response model (Gauch &
Whittaker 1972) has been replaced by more elaborate curve fitting and hierarchical models (Austin
et al. 1984, Huisman et al. 1993). Unfortunately, deep-sea sampling for most taxa has not been
conducted with sufficient spatial resolution to warrant exploration with these newer analyses.
However, examination of population levels across a depth range warrants considerable attention.
If an organism is controlled by a single physiological factor, then a population maximum at the
preferred level is expected with symmetrical decreases as the level of the controlling factor increases
or decreases from the preferred. If a distribution is controlled by both a physiological limitation
and food availability, the population maximum should be skewed toward the higher food availability.
Evolutionary aspects of ranges and demographic sinks
When species’ ranges in the deep-sea or any other environment are examined over ecological
timescales (years to decades) and evolutionary timescales (centuries and millennia), different
questions about the causes of range restriction arise. The response-curve view is that a population
range will centre at ideal conditions and then be bounded by unfavourable to lethal extremes. The
evolutionary view poses a question about the permanence of the response curve. On very long
timescales, the question arises as to why populations have not adapted to extreme conditions via
natural selection and expanded their range. This is an especially relevant question in the deep sea
where the distance between 200 and 4000 m bottoms can be relatively short, contain no obvious
physical barriers to dispersion and more food is available up slope. In other words, why aren’t all
species present everywhere, especially across the seemingly homogenous soft mud bottom between
the shelf break and the abyssal floor? The temperature range of the entire ocean certainly lies within
the tolerance range of some members of all marine phyla and larval dispersion of even sessile
species is capable of substantial vertical migration (Young et al. 1996).
As part of the development of genetic-based evolutionary theory, both Haldane (1956) and
Mayr (1963) proposed that restricted ranges along gradients were due to a simple pattern of gene
flow (see review by Lenormand 2002). Locally beneficial mutations might arise by chance within
sparse populations living at the extremes of a species range, but selection favouring those mutations
would be prevented by overwhelming gene flow from the much larger populations at the centre of
distribution, the gene pool of the central populations being better adapted to central conditions. In
effect, gene flow from a well-adapted central population dooms the peripheral populations from
adapting and extending the range. Should gene flow weaken, sufficient isolation could arise to
allow for speciation at the periphery.
The feasibility of range restriction by gene flow along gradients in the absence of sharp
environmental boundaries was examined via mathematical models. An initial model produced range
limits that expanded, collapsed or remained stable depending upon a very sensitive balance between
rates of adaptation at the boundary subpopulation and inflow rates of maladapted genes (Kirkpatrick &
Barton 1997). The stability of range limits increased with later models that incorporated competition
among species on the gradients (Holt & Gomulkiewicz 1997, Gomulkiewicz et al. 1999, Case &
Taper 2000). When competition suppresses peripheral populations that are already stressed by
environmental gradients, the restrictive effects of gene flow are enhanced. Applied to the deep sea,
long-term range restrictions in the deep sea may be maintained by a gene flow from a well-adapted
subpopulation. In the relatively sparse subpopulations near the range boundaries, immigrants
dispersing out of the abundant central subpopulation swamp the regional gene pool and prevent
231
© 2005 by R.N Gibson, R.J.A. Atkinson and J.D.M. Gordon
3597_book.fm Page 232 Friday, May 20, 2005 6:26 PM
ROBERT S. CARNEY
development of local adaptation. This genetic swamping at the extremes by animals best adapted
for central conditions may be most severe at the food-poor, deeper end of the depth range.
A concept directly applicable to the food-poor deep sea is that of demographically heterogeneous ranges. Source subpopulations in portions of a range may be more important to overall
population maintenance than sink subpopulations elsewhere. Progress in development of source
and sink range theories has been reviewed by Holt (2003). Holt and his associates have emphasised
that ranges have two critical, interacting aspects: habitat heterogeneity across the range and dispersion. Heterogeneity is represented in the simple McPeek-Holt model (McPeek & Holt 1992),
in which the range of a dispersive species is composed of two habitats, one in which the species
has high fitness and one with much lower fitness. For highly dispersive species, the large populations
in the high fitness habitat serve as ‘sources’ of larvae and adults that move into the ‘sinks’
represented by the low fitness habitats. The species fitness in the sinks may be so low that no
outward dispersion occurs. Unfortunately, Holt’s attempts to develop a theory of the evolutionary
ecology of range limits has yet to provide a simple prediction (Holt 2003) but his model does focus
attention on the measurement of fitness and determination of dispersion. Ranges may shrink over
time if the fitness contrast between source and sink steepens.
Patterns arising from overlapping ranges: mid-domain effects
Mid-domain effects are patterns found in multispecies distributions that are the necessary consequences of the interaction between domain geometry and range size, and not of processes such as
resource utilisation, immigration, competition or historical change. A review of mid-domain models
has been given by Colwell et al. (2004). A common pattern attributed to the mid-domain effect is
a maximum in species richness midway between the boundaries of a domain, and low species
richness at the periphery. In this context of random effects, the sea floor is a bounded domain within
which distributions are confined above by the shore and below by the maximum depth of a basin.
Exactly determining the confining boundaries of the deep sea is a bit more complicated. However,
macrofauna maxima in species richness is reported on some slopes (Levin et al. 2001, Snelgrove &
Smith 2002 and references therein) strongly calling into question the possibility of a mid-domain
effect.
Pineda (1993) first proposed mid-domain effects as a null model to explain deep-sea diversity
maximum at lower slope depths in the northwest Atlantic. Subsequently, a simulation was conducted
using gastropod and polychaete ranges from the region (Pineda & Caswell 1998). The simulation
consisted of random placement of species ranges across a modelled linear sea floor of 0–5000 m.
This procedure produced parabolic or ‘humped’ species richness distributions. These simulated
distributions differed consistently from the actual observed peaks in two critical ways, both the
magnitude and depth of the maximum. This mismatch between the observed and simulated was
interpreted to mean that the observed diversity maxima were caused, at least in part, by processes
other than mid-domain effects. An additional interesting observation was that when wide-ranged
eurybathyal species were removed, depth maxima disappeared. This pointed to an important role
in slope diversity of ubiquitous fauna.
The use of mid-domain effect models to test the significance of observed deep-ocean distributions is subject to a valid criticism of being ecologically unrealistic (Laurie & Silander 2002, Zapata
et al. 2003). The models may become uselessly complex by requiring too many parameter choices
governing boundaries, ranges, intra-species effects and placement. In the final analysis, simulation
of a natural pattern using stochastic processes is not proof of the absence of deterministic processes
in nature. The use of such models, however, seems well justified in the case of deep-ocean ecology
where four sources of pattern must be anticipated that do not arise from ecological processes. First,
boundary effects are to be expected; the sea floor is a domain with many boundaries — bathymetric,
232
© 2005 by R.N Gibson, R.J.A. Atkinson and J.D.M. Gordon
3597_book.fm Page 233 Friday, May 20, 2005 6:26 PM
ZONATION OF DEEP BIOTA ON CONTINENTAL MARGINS
geographic, thermal, pressure, nutrient, etc. Second, sampling artefacts will arise; species ranges
are only sampled not fully known. Third, analytical artefacts will arise through the application.
Fourth, less easily predicted artefacts might arise from what can be termed the ‘behaviour of large
datasets’. Tools are needed that will help recognise the deterministic processes against a background
of random effects and artefacts.
Depth ranges observed
The theoretical considerations discussed above lead to a series of five cautious predictions about
deep-sea ranges. The response-curve perspective predicts that abundances are skewed toward the
more food-rich shallow end of a range. The genetic explanation for restricted ranges predicts
homogeneity at the population maximum and ill-adapted individuals at the extremes. High levels
of genetic variation at the extremes may reflect the presence of cryptic species at these extremes.
Habitat utilisation is expected to be relatively uniform across a given species’ depth range. In the
next sections the similarities and differences between predicted and observed will be examined.
Skewed toward the shallow end
Assessing where in a depth range a population maximum occurs is made difficult by sampling and
data reporting problems. Megafauna are often collected by inconsistent trawling techniques but the
more quantitative core sampling of macrofauna and meiofauna are seldom reported at the species
level. In this review the results of two of the best documented studies in the Porcupine Seabight
area are re-examined. Both studies are based on more than 10,000 specimens and an extensive
sampling programme extending down to the abyssal plain. The first study examined epifaunal
seastars (Howell et al. 2002), and the second infaunal bivalve molluscs (Olabarria 2005). The
reanalysis consisted of eliminating all species with ranges less than 300 m, then scaling all ranges
to a normalised range of 1.0. The reported depth of maximum occurrence was then converted to a
decimal fraction of the scaled range. An examination of the results (Figure 4C,D) indicates the
combination of two distinct patterns. The first is a strong skewing of maximum abundance to the
upper end of the range. The second is a centring in the middle of the overall range. The generality
of these results remain to be seen, and both the skewing and centring can be explained in many
ways. Initially, however, it can be proposed that many species are more abundant in the upper half
of their distribution consistent with some dependence on the presumed gradient of detritus influx.
Population structure within ranges
One of the most important genetic findings about deep-sea faunal ranges was the report that the
widespread ophiuroid, Ophiomusium lymani, showed greater allelic homogeneity for hundreds of
kilometres along isobaths than across 1000 m depth in close geographic proximity (Doyle 1972).
In spite of some concern over sampling, this pattern of genetic depth zonation within a species was
considered valid in the comprehensive review on bathyal genetics by Creasey and Rogers (1999),
and continues to be confirmed with additional examples (Howell et al. 2004b).
Although the population structure over a full depth range with respect to morphology or genetics
has been examined for only a few species, differences between the upper and lower subpopulations
are usually found. These differences may be seen as shifts in size structure, ontogenetic migrations,
or phenotypic and genotypic variation. Collectively, these can be seen as responses to gradients of
selection within the occupied range. Initially on the basis of shell morphology and later confirmed
by DNA studies, selected species of gastropods and bivalves in the northwest Atlantic showed
greater variation at upper bathyal depths than at lower bathyal and abyssal depths. The depth of
233
© 2005 by R.N Gibson, R.J.A. Atkinson and J.D.M. Gordon
3597_book.fm Page 234 Friday, May 20, 2005 6:26 PM
ROBERT S. CARNEY
greatest within-species variation corresponded to depths of greatest species turnover and greatest
environmental transition. Deeper subpopulations and deeper species tended to be more monotonous
(Etter & Rex 1990, Chase et al. 1998, Etter et al. 1999, Clain & Rex 2000, Quattro et al. 2001),
consistent with more uniform abiotic conditions. These findings have also been confirmed for
species in the northeast Atlantic (Potter & Rex 1992, Olabarria & Thurston 2003, 2004). A high
level of variation suggests that the upper bathyal is a site of increased diversification (Rex & Etter
1990) along gradients in a manner similar to the model of sympatric speciation of Dieckmann and
Doebeli (2003).
The existence of ill-adapted peripheral subpopulations has been found for some groups. The
short dispersal distances on the narrow continental margin increase the likelihood that dispersive
larvae will settle beyond the depth ranges for viable adult populations (Young et al. 1996). This
has been well documented for megafaunal echinoderms. Long-term monitoring of the Rockall
Trough (Gage & Tyler 1981) has found settlement of the upper slope ophiuroid Ophiocten gracilis
in unusually deep water, but failure to establish an adult population at these depths. Similarly, the
range of adult seastars was often smaller than the depth range occupied by juveniles. For highly
mobile species, natural selection may have led to life histories that exploit an age-related range
difference. In such species, individuals may reposition themselves, seeking an optimal position
within their depth range. This phenomenon has been consistently identified in the geryonid crab
species that can be commercially abundant between about 300 and 1500 m on continental slopes
around the world. However, the larvae settle over a wider depth range, and then migrate upward
into a narrower adult band. This has been demonstrated off the Canary Islands (Abellan et al. 2002),
off the United Kingdom (Attrill et al. 1990) and in the Gulf of Mexico (Erdman et al. 1991,
Lindberg & Lockhart 1993).
Trophic plasticity appears to be more prevalent than uniformity across a species range. Populations of predatory fish and crustaceans exhibit trophic shifts within depth ranges that reflect changing
prey availability and trophic plasticity. Demersal fish typically show a change from pelagic to benthic
prey in the lower portion of their depth range (Carrasson et al. 1997, Martin & Christiansen 1997).
For Pacific macrourids a depth shift from predation to scavenging accompanied an ontogenetic shift
in which large adults ranged deeper than juveniles (Drazen et al. 2001). A similar shift from predation
to deposit-feeding has been reported for Mediterranean decapod crustaceans (Cartes 1998).
In summary, prediction and observation often agree. Most notable among agreement is the
skewing of population maximum toward the upper, food-rich end of the depth range in many
species. With respect to ages, sizes and feeding activity, depth ranges are not homogenous. The
most surprising finding is the high level of genetic and morphological diversity in the upper portion
of ranges. If food availability and physiological factors are both important, there is a possibility
that the region of highest abundance lies outside the physiological optimum. If part of a species
range is a demographic sink, such sinks appear to be the deeper portion rather than the upper.
Statistics of ranges and Rapoport’s rule
The determination of the statistical properties of multiple ranges is a component of biogeography
closely related to the study of zonation. Such studies have been common for terrestrial and shallowwater fauna and are now beginning to be applied to marine continental margin taxa. The few studies
already published can be placed in two categories. The first category is model neutral in that the
studies are intended to identify and characterise the patterns present. The studies in the second
category are intended to test a specific model, Rapoport’s rule.
Rapoport’s rule (Rapoport 1982) is a generalisation based on terrestrial species stating that the
latitudinal range of species distributions is wider for high-latitude species. Stevens (1989, 1992,
234
© 2005 by R.N Gibson, R.J.A. Atkinson and J.D.M. Gordon
3597_book.fm Page 235 Friday, May 20, 2005 6:26 PM
ZONATION OF DEEP BIOTA ON CONTINENTAL MARGINS
1996) rephrased and extended this generality to include elevation on land and depth in the ocean.
Additionally, the altitude range pattern was linked with latitude diversity gradients (Taylor & Gaines
1999). The rule states that distribution ranges along a gradient will become narrower at the extreme
end with the lowest environmental variation. As a consequence, more species will be found packed
at the stable end. The depth version, ‘Rapoport’s Bathymetric rule’, that depth range increases with
increasing (poleward) latitude applies to some marine taxa (Smith & Gaines 2003 and references
therein).
Smith and Gaines (2003) examined databases on northeast Pacific fish and northwest Atlantic
gastropods and found distinct increases in bathymetric range. The median range for the fish was
uniform, near 50 m, from the equator to 30°N, then increased steadily to 400 m by 60°N. The
gastropods were uniform around 80 m to about 36°N in the Atlantic, then increased sharply to over
400 m by 50°N, and then remained relatively constant into the Arctic. By implication, faunal zones
based on any of these same species should experience an extra tropical deepening and widening.
Latitude diversity gradients were associated with a poleward change in shallow-water habitats rather
than simple range compressions.
In an oceanographic context, Rapoport’s Bathymetric rule is an expected and rather uninformative pattern equally consistent with thermal, water mass and possibly even detritus influx
explanations for depth distributions. The temperature contrast across the thermocline and the depth
of cold water masses both decrease poleward, while phytoplankton productivity increases. A wider
relevance of Rapoport’s rule to deep studies is not immediately obvious. If Rapoport’s rule is
examined strictly in terms of bathymetry omitting latitude, it does not apply in the sense of a
dependence on variability (Pineda 1993). On the bathymetric gradient, ranges widen at the deep
end where conditions are least variable. When diversity maxima occur, they tend to be on the
middle to lower slope away from the extremes of most gradients.
Macpherson (2002, 2003) has undertaken a comprehensive compilation of ranges for 10 taxa
in the Atlantic between 80°N and 70°S that serves to rigorously illustrate generalities about
distributions and depth. Many of these species in the dataset were pelagic, but depth range analysis
for benthic species was limited to cephalopods, stomatopods, decapod crustaceans and fishes. Data
were compiled into 5° latitude bins and three depth zones: shelf, 0–100 m; shelf-slope, 100–1000 m
and slope/rise, >1000 m. Benthic animals showed narrow latitude ranges with restriction to faunal
provinces on the shelf and shelf slope. Deeper slope/rise species showed greater latitude ranges.
Depth range and maximum depth of occurrence were highly correlated, indicating that deeper
animals had wider depth and latitude ranges. Evidence for homogenous depth zones was sought
by examining first occurrences in 100 m depth bins. Weak boundaries at 100, 300 and 1000 m
were found involving fewer than 10% of the local species pool. The boundaries became less distinct
toward the Arctic.
Selected regional studies
Basic scientific investigation, fisheries surveys and environmental sampling associated with offshore
oil development have produced a marked increase in deep-ocean sampling over the past decade
that continues today. Geographically scattered information about some components of slope fauna
can be found for all continental margins. Far fewer regions, however, have been sampled at a
relatively high density over the full slope depth and the findings for several taxonomic groups have
been worked up. Five better-studied regions are considered here with the intent of better understanding global patterns by comparing zonation in regions of dissimilar oceanographic conditions.
The polar regions have not been studied to the same extent, but are included because of the
importance of looking at distributions in the absence of a permanent thermocline.
235
© 2005 by R.N Gibson, R.J.A. Atkinson and J.D.M. Gordon