Community Participation and Geographic Information Systems - Chapter 5 pdf
Bạn đang xem bản rút gọn của tài liệu. Xem và tải ngay bản đầy đủ của tài liệu tại đây (1.48 MB, 12 trang )
Mapping Philadelphia’s
neighbourhoods
Liza Casey and Tom Pederson
Chapter 5
5.1 INTRODUCTION
Since 1994, the City of Philadelphia has been working to bring GIS technol-
ogy to the level of neighbourhood planners, hoping to initiate with them a
PPGIS. Although it has been successful in generating enthusiasm for the appli-
cability of GIS for this purpose, use of the technology in the neighbourhoods
is still minimal. A 1995 paper by these authors documented the project with
particular focus on the limits of existing mapping techniques and symbol-
ogy for mapping urban neighbourhood environments. This paper documents
the progress of the City’s continued efforts to give neighbourhood plan-
ners access to its GIS resources and the impact of new technologies on that
effort. Our finding is that although the City may now be in a much better
position to distribute its GIS data through less expensive, easier to use inter-
faces that can effectively distribute public records, the difficulties of building
effective PPGIS in urban neighbourhoods still exist.
5.2 BACKGROUND
The City of Philadelphia, which was literally on the verge of bankruptcy in
the early 1990s, was rejuvenated under the leadership of Mayor Ed Rendell.
The downtown has been revitalized. The new convention center is booked
for years. Ben Franklin, Betsy Ross and the Liberty Bell are being more
effectively promoted and Philadelphia is becoming a true destination city –
even attracting the Republican National Convention in 2000.
But there is another side to the City. Philadelphia is a victim of the move
away from an economy based on manufacturing. It has steadily lost jobs and
people over the last 50 years. Between 1965 and 2000, the City lost over 25 per
cent of its population. Just since 1988, 100,000 jobs were lost and almost
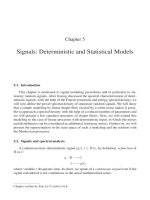
30 per cent of its residents live in poverty. As a result, many of Philadelphia’s
neighbourhoods are filled with vacant buildings and trash strewn lots
(Figure 5.1). They are tormented by crime, drugs and unemployment.
© 2002 Taylor & Francis
66 L. Casey and T. Pederson
The people to whom these neighbourhoods are home, are clearly margin-
alized communities. Working with Philadelphia’s Office of Housing and
Community Development (OHCD) our hope was to introduce GIS to com-
munity organizations in these neighbourhoods as a tool for strategic plan-
ning. If used correctly, GIS could help allow politicians and decision-makers
see both the problems and the potential in proposed neighbourhood-based
planning efforts, and to see how these neighbourhoods might be affected by
their funding.
In 1994, recognizing both the appropriateness of moving neighbourhood
planning back to the neighbourhoods and the applicability of GIS for this
purpose, OHCD funded a pilot project to bring GIS to the neighbourhoods.
The project provided equipment, software, data and training to 6 of the
City’s 25 Community Development Corporations (CDCs). Both authors
were drawn into the activities surrounding the GIS pilot; Casey as the head
of GIS for the City, and Pederson as the consultant under contract with
OHCD to provide training, support and data to the CDCs.
Community Development Corporations are inner city neighbourhood
organizations with a goal of neighbourhood revitalization. They
emerged in the 1970s as participants of the funding and support gen-
erated by the ‘War on Poverty’.
Figure 5.1 A West Philadelphia streetscape.
© 2002 Taylor & Francis
After working with the participant CDCs on almost a daily basis, we
came to understand well the issues emerging from the GIS pilot. There were
a number of practical and logistical problems ranging from bad addresses
to problems involving the transfer of data between incompatible operating
systems (DEC VMS and Windows). However, while addresses can be cor-
rected and data transfer paths can be forged, during this pilot, we began to
see problems more critical to the project – problems with the maps. A sec-
ond critical issue became the lack of skills necessary to run a GIS.
5.3 PROBLEMS WITH THE MAPS
The maps we started to see as a product of the pilot could not be compared
side-by-side or collectively. Each attached significance to colour differently
and used its own classification schemes and categories, and symbology.
We realized there were no standards and no ‘symbology vocabulary’ for
mapping the urban environment in the way that exists in cartographic
tradition for road maps or maps of natural features, such as hills or grass-
lands.
In addition, the maps seemed very limited in their ability to portray the
qualitative aspects of a neighbourhood environment. As we were witness to
maps from neighbourhoods scattered over the City and had developed site
context based on our repeated visits, we were in a position to notice that the
maps did not meaningfully convey the very distinct physical and social dis-
parities we observed in the neighbourhoods. The following paragraphs are
from a paper these authors wrote in 1995 that focused on the limitations
of traditional mapping standards, techniques, and symbology as applied to
mapping neighbourhood environments.
If one follows the premise, that ‘maps are models of the world – icons if
you wish – for what our senses see through the filters of environment,
culture, and experience,’ then the CDCs do not seem to have sufficient
tools to make appropriate models of their neighborhoods (Aberley
1993). With the parcel base maps, tax assessors data, tax delinquency
and vacancy data, there does not seem to be any way, for example, to
convey the beautiful old stone buildings which are such a part of
Philadelphia’s Germantown neighborhood. Those that were turned into
multi-family dwellings are simply so coded. Those that were vacant and
boarded are coded as vacant tax delinquents. There does not seem to be
a means to convey the value of this wonderful architecture to the neigh-
borhood or what it is worth as a resource. The same applies to mapping
the locations of local cultural or community value, such as a famous
family-owned barbecued chicken place on the corner which is a social
gathering place for the neighborhood. Nor is it apparent how to map
Mapping Philadelphia’s neighbourhoods 67
© 2002 Taylor & Francis
other elements that make the environment unique such as wall size
murals or statuary created by local artists, stores selling ethnic foods and
other imported goods, local restaurants, blocks of particularly well kept
houses, blocks of houses with details that reflect a certain building style,
or lively commercial corridors.
Similarly, there is no ability to communicate the shocking degree of
abandonment and dissipation in some of the neighborhoods. Crumbled
buildings, burned out abandoned cars, trash strewn lots and streets,
broken glass and graffiti are in evidence everywhere but not on the
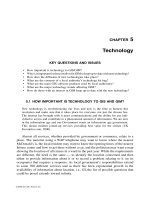
maps. For example, in the map of one part of West Philadelphia the
neat little parcel lines, which correspond to its original development,
seem to suggest some kind of active ownership interest. Whereas, in
fact, whole blocks have been completely abandoned or demolished
(Figure 5.2) and former owners are long gone, owing the city as much
as 27 years worth of back taxes.
Casey and Pederson 1995: 1
In our research for this 1995 paper, we discovered that while the problem
of mapping the elements needed to portray neighbourhood environments
had been recognized, there were very few suggestions of means to resolve it.
Our paper proposed a three-tiered approach that included standardization,
structured classification, and the development of appropriate symbology.
68 L. Casey and T. Pederson
Figure 5.2 Entire blocks have been demolished in some Philadelphia neighbourhoods.
© 2002 Taylor & Francis
However, as we acknowledged, ‘the answer for the CDCs is, obviously, not
a simple solution that we can profile in this paper and implement through
our roles as promoters and supporters of the GIS project’ (Casey and
Pederson 1995).
5.4 THE LACK OF NECESSARY SKILLS
Seven years have passed since the inception of the GIS pilot. The vision was
that by now, scores of neighbourhood planners and interested citizens
would be sitting at PCs in the CDC offices using GIS to both query the
information regarding the particulars of their environments and to per-
form ‘what if’ scenarios to assist with strategic planning. This has not
come to pass. If bringing that vision to reality were the only measure of the
program’s success, it failed. For all the distribution of PCs and software,
the cleaning and organizing of the data, and the hours of training and
handholding, there is still an insignificant use of GIS at the level of the
CDCs.
Everyone concerned, OHCD, other city agencies watching the process,
the CDCs themselves and the authors realized that one obstacle in reaching
this vision far overshadowed all of the others – lack of skills necessary to
use a GIS accompanied by the rapid turnover of any staff with the aptitude
to learn those skills. CDCs have extremely limited budgets and their staffs
do not come with training in technology. People with GIS skills, especially
good conceptual and analytical skills, can easily find higher paying jobs.
Our problem was that the gap between the skill level needed to navigate
a Windows based GIS interface (ArcView in this case) and the skill level
we would find in the CDCs was underestimated. Too much hinged on the
ability of the group’s designated technology enabler.
While the specific vision of PPGIS described above was not realized, the
project was not a failure. On the contrary, the work that went into that pilot,
the personal contacts and the ‘bell ringing’ about the applicability of GIS to
neighbourhood planning brought, across the board, increased awareness of
the potential of this technology. The best witness to this is the continuing
GIS-centered activities.
The City, OHCD, and others involved responded to the problems of the
GIS pilot with new strategies. Instead of continuing to fund individual
CDCs, OHCD funded the Philadelphia Association of CDCs (PACDC) at a
rate of about 60 thousand dollars a year to provide a ‘centre’ for GIS activ-
ity where CDCs could find continuing technical support for neighbourhood
mapping without having to employ skilled operators. They could walk into
PACDC’s office and emerge with a map made to their specifications.
PACDC over the last two years has created over 300 GIS-generated maps
responsive to the requests of CDCs. The City made GIS data available to
Mapping Philadelphia’s neighbourhoods 69
© 2002 Taylor & Francis
numerous non-profit consultants to provide maps in support of funding
requests. In addition, OHCD, with the University of Pennsylvania, built a
GIS-based Neighbourhood Information System.
Accompanying the realization that wholesale access to GIS was not suf-
ficient to bring GIS to the neighbourhoods in a useful manner, have been
continuous changes in the underlying technologies. The most important of
which are: (1) GIS software manufacturers began to provide the capability
of linking GIS systems to Internet technology; and (2) GIS software manu-
facturers now provide open development environments between GIS and
standard database interface tools such as PowerBuilder and Visual Basic. As
a result, the tools available for dissemination of GIS technology have drast-
ically altered. The new technologies also polarized, and helped us recog-
nize two distinct types of systems which we call Public Records GIS and
Neighbourhood Planning GIS.
5.5 PUBLIC RECORDS GIS
Public Records GIS is the Internet distribution of data through GIS that a
city or other government body collects as part of their administration of
policy and laws, and distribution of services. It is information traditionally
recorded, e.g. property owners, tax assessment, code violations and so on.
It is information collected with new technologies like orthophotography. It
includes data from Federal sources such as the Census Bureau or the EPA.
It also includes data from utilities and from businesses that want to make
their data public.
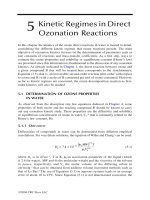
Public Records GIS covers a wide range of functionality. It includes
interfaces such as a zoning application we have in Philadelphia which
allows users to type in an address (or zoom in on an area) and be pres-
ented with a parcel map showing the zoning and special use codes in effect
(Figure 5.3).
Philadelphia will soon be deploying another Public Records GIS from the
Streets Department which will show where planned under-the-street utility
maintenance is going to occur.
In 1994, the goals were to move portions of the GIS data and related city
records to stand alone PCs located in neighbourhood offices for the CDCs
and interested citizens to ‘have at it’. Now, Public Records GISs allow the
distribution of central databases using the Internet with an easy-to-use
interface. This eliminates the problem of finding and keeping GIS trained
personnel.
OHCD’s Neighbourhood Information System is an example of a Public
Record’s GIS with neighbourhood information. The Cartographic Modeling
Lab of the University of Pennsylvania developed it with grants from the
Pew and William Penn Foundations to help with the analysis of potential
70 L. Casey and T. Pederson
© 2002 Taylor & Francis
redevelopment of vacant land and buildings in Philadelphia (Figure 5.4).
It is based on the parcel map. The user selects a parcel and is provided
with information from the tax assessor, the department of Licenses and
Inspections, the utilities, and data from the US Census. It includes the abil-
ity to aggregate certain of these data to various geo-political boundaries. As
we go to press, this system has been operational at the university for over a
year with access provided to city employees and people working in a com-
munity development capacity.
5.5.1 Strengths of Public Records GIS
Public Records GIS systems have the potential to be very useful for margin-
alized urban communities. For example, in connection with work we recent-
ly completed for The United Way for their Youth at Risk programme, we
created a very powerful map using City data and Census information. We
were helping to determine where the programmes should be focused. We put
together a few of the pieces of data that had been made available and soon
we were looking at a map showing a Census Tract in Philadelphia where last
year, 4 kids under 16 years were murdered, 5 girls from 10 to 14 years old
Mapping Philadelphia’s neighbourhoods 71
Figure 5.3 License and inspections zoning application.
© 2002 Taylor & Francis
had babies, and 251 single woman with children 5–17 were living below
poverty. Somehow, without further research, it seems clear that if the people
in this neighbourhood were organized and had access to this information,
they could use it to cry out that Youth at Risk money would be well spent
for their community.
It is easy to envision a series of web-based, neighbourhood-oriented, user-
centred, task-driven interfaces like the Neighbourhood Information System
geared to a variety of intents. These would allow unskilled users to select
parameters and, with a few tools to control scale and extent, to create maps
to help bring attention to their needs. We feel certain that Philadelphia will
continue to expand the use of systems like this.
Besides ease of use, there are other advantages to the new technologies.
The cost to the user is reduced to the cost of a PC and an Internet web
browser that can usually be acquired at no cost. With the data sets stored
centrally and the processing being done on the server, the need for hefty PCs
to accommodate the large files and complex processing is eliminated. A
very basic PC is sufficient.
Another advantage is de facto standards in neighbourhood mapping,
which we have been championing for some time now, will be enforced.
72 L. Casey and T. Pederson
Figure 5.4 The neighbourhood information system.
© 2002 Taylor & Francis
The themes, symbology and classifications will all be pre-set and unalter-
able. The inclusion of these standards as part of an interface allowing access
to data needed for neighbourhood planning will make all users interested
in that same data familiar with the symbology vocabulary and encourage
its use.
5.5.2 The limitations of Public Records GIS
There are still problems with a reliance on web interfaces and Public
Records GIS for neighbourhood planning. The obstacles to publishing this
data caused by the limitations of the technology may have faded, but in
Philadelphia, as in many other places, the issue of distributing the data
evokes numerous strong opinions regarding legal implications and political
ramifications. Giving the data to CDCs for their own use is not the same as
publishing it on the web. City Hall may not want to make it so easy for the
public in general to be able to find that 25 per cent of the properties in the
City are tax delinquent. The City will have to establish distribution policies
that will address specific databases and even data elements within those
databases. The City is in the process of establishing an internal review
board to sort through these issues which will be resolved, but not without
time and effort.
Much more complex than distribution policies will be the difficulties we
found hard to resolve in mapping neighbourhood environments in general.
The problem at issue in the 1995 paper, namely that existing mapping tech-
niques and symbology are inadequate to map the qualitative aspects of
neighbourhoods, has not gone away. In addition, the Public Records GIS,
which eliminates dependency on the high-level skills required to operate a
stand-alone GIS, does so with sacrifices. It limits the available data, the tools
for presentation and analysis, and the features that can be manipulated. The
components that are included in the interface between the user and the City’s
data become the only components available. A great deal of research and
architechting will have to go into the development of the Public Records
GISs for them to be truly effective.
In addition to the component set, the manner of presentation needs to
be carefully considered. If map themes are limited to ‘hard wired’ depic-
tions, it will have a direct impact on the portrayal of various factors.
Information coded as cross hatches could be used in conjunction with
information coded with solid colours, but the possibilities become more
limited when the need is to depict solid colour-coded themes with other
solid colour-coded themes. The order of the themes, what is displayed on
top of what, would also be preset and limit the ways in which the data
could be viewed. A particular interface could present the data in a biased
fashion and unintentionally misrepresent a neighbourhood’s assets and
resources.
Mapping Philadelphia’s neighbourhoods 73
© 2002 Taylor & Francis
5.6 NEIGHBOURHOOD PLANNING GIS
Neighbourhood Planning GIS can take advantage of all the same data in
a Public Records GIS, but it adds two other things. It adds community-
based data and it adds the facility for manipulating and analysing the
data.
5.6.1 Place-based knowledge
Features that make a neighbourhood unique, such as cultural characteristics
and architecture, as well as places that have community value are not col-
lected in the normal course of a city’s record keeping. The things of value in
a neighbourhood such as architecture or home grown community gardens,
as well as the things of negative value such as garbage-strewn playgrounds
and crack houses, are not line items in any city database. In fact, knowledge
of the value of neighbourhood features is something that can only come
from the neighbourhood itself. This was precisely the thought behind
OHCD’s strategy to put this tool in the hands of the CDCs. It follows along
the lines of what Doug Aberley expresses in Boundaries of Home: Mapping
for Local Empowerment.
If images of our neighbourhoods, our communities, and our regions are
made by others, then it is their future that will be imposed. But if maps
are made by resident groups, individuals who have quality of life as a
goal, then images of a very different nature predominate.
Aberley 1993: 130–131
5.6.2 Data manipulation facility
The stringent limits to the manoeuverability of features and themes that
a Public Record’s GIS imposes means that the experiments or ‘what-ifs’
that are required for neighbourhood planning are severely curtailed. In
Philadelphia, where we are losing population, a planner could want to show
the effect of moving a few active residents into an otherwise vacant area,
creating a new neighbourhood and freeing a large unutilized area for re-
development. Or, a neighbourhood might want to show the impact of a new
business on support service businesses. Or, a neighbourhood might want to
propose to be the site for a new City-sponsored mural (a growing phenom-
enon in Philadelphia) and demonstrate to the selection committee the path a
tourist bus might take.
An effective Neighbourhood Planning GIS would need to go beyond a
fixed package of data and be able to pull the data together in new ways. An
interface that allowed a user access to the facilities that would permit these
types of analyses would be, realistically, as complex as the ArcView software
74 L. Casey and T. Pederson
© 2002 Taylor & Francis
Mapping Philadelphia’s neighbourhoods 75
with which we started out. This would result in exactly the same problem
we witnessed in the OHCD pilot: The skills to operate a system with that
level of sophistication just are not available in Philadelphia’s marginal neigh-
bourhoods.
This doesn’t mean that in Philadelphia we are just going to stop
trying to use GIS for neighbourhood planning. We haven’t stopped – the
effort continues. What we are doing is, reassessing where we put our techno-
logy resources and trying to work through some of the issues that were
uncovered.
For Neighbourhood Planning GIS it seems that the City, for the time
being, needs to focus on skill centers, similar to the example of PACDC,
where community groups can voice their ideas and hopes for their neigh-
bourhoods and find the skills necessary to have it mapped for them. We
might, also, better employ resources by establishing town meeting types of
events where the what-ifs can be depicted with groups of residents provid-
ing their input, and facilitators and GIS technicians mapping the commun-
ity’s feedback.
5.7 CONCLUSION
In Philadelphia’s marginal neighbourhoods, the needs for creative planning
are in unquestionable demand. Mapping techniques and symbology, the
symbology vocabulary, still need major attention before GIS can effectively
address the condition of Philadelphia’s urban environments. The City needs
to ascertain the most efficient ways in which GIS can be used to capture
community opinions and place-based knowledge. At the same time, the
component sets in our Public Records GISs need considerable attention and
examination before they can be used effectively by neighbourhoods.
In both Public Records GIS and Neighbourhood Planning GIS, the expect-
ation is that success will be based on a highly iterative process taking place
between those with design and programming skills and those with know-
ledge of the neighbourhoods, with that process being informed by academic
research. It is likely that the limits of even today’s technologies will frustrate
the process and we will have to wait for still other technical capabilities to
meet the needs of Philadelphia’s marginal communities.
Of the activities we have discussed, Neighbourhood Planning GIS may be
the activity that falls within the definition of PPGIS, or maybe, to a certain
extent, they both will. In the meantime, it is important not to confuse Public
Records GIS and its limitations, with Neighbourhood Planning GIS and its
ability to map place-based knowledge and the ability to analyse a wide vari-
ety of scenarios. Above all, it is important to continue to recognize GIS as
an effective tool for neighbourhoods in Philadelphia and other cities across
the country and around the world.
© 2002 Taylor & Francis
REFERENCES
Aberley, D. (ed.) (1993) Boundaries of Home: Mapping for Local Empowerment,
Philadelphia, PA: New Society Publishers.
Casey, L. and Pederson, T. W. (1995) ‘Urbanizing GIS: Philadelphia’s strategy
to bring GIS to Neighbourhood Planning’, Proceedings of the Environmental
Systems Research Institute User Conference, />conf/proc95/to150/p107.html
76 L. Casey and T. Pederson
© 2002 Taylor & Francis