Community Participation and Geographic Information Systems - Chapter 9 potx
Bạn đang xem bản rút gọn của tài liệu. Xem và tải ngay bản đầy đủ của tài liệu tại đây (1.08 MB, 12 trang )
GIS-enhanced land-use
planning
Stephen J. Ventura, Bernard J. Niemann, Jr.,
Todd L. Sutphin and Richard E. Chenoweth
Chapter 9
9.1 INTRODUCTION – INFORMATION IN
LAND-USE PLANNING
The role of spatial information technologies in decision-making has been
debated almost since the inception of their use in local government land
information systems. An important question that often arises is whether
land information is used to help make decisions, or is it used to justify deci-
sions made for many other reasons? Niemann (1987) and Zwart (1988) epito-
mized the debate in their point and counter-point conference articles about
‘better information’ resulting in ‘better decisions’ through modernized land
information systems.
At the local level, ‘just getting the job done’ public agency practitioners
generally have not been concerned about the role or impacts of spatial infor-
mation. If they take time to consider these issues, it is likely that most would
follow disciplinary training and assume that improvement in quality and avail-
ability of land information benefits the citizens and organizations they serve.
If asked about ‘public participation’, they might also assume that improve-
ments, particularly in data form and access, extend availability of information
to audiences that otherwise may be excluded from decision-making processes.
Little empirical evidence has been reported to support or deny this belief
in a positive role for land information in land use decision-making in the
contemporary US local government context. Zwart (1991) defined indica-
tors of the impacts on decision-making, though noted operational difficul-
ties in using them. A theoretical model of the role of information in local
land use planning was developed by Knapp et al. (1998). They explicitly
looked at the effect of information about local government infrastructure
investments and land use regulations on the timing of development deci-
sions. Their study did show that information modifies development deci-
sions. However, the models were limited to interaction between local
government and developers; it did not account for all the other actors in
© 2002 Taylor & Francis
development decisions, particularly actors who could be more influential if
empowered by information.
In the land-use debate, the difficulty of ascertaining who may be affected
by land-use decisions (and how this might change with differences in access
to information) is exacerbated by the diffuse nature of the decision-making
process. Many citizens are affected by land-use decisions but may not be
directly involved in the decision-making process. The optimistic view is that
of a Jeffersonian democracy, where well-informed citizens exert an indirect
influence on the process, through elections, meetings, surveys, and even
through consumer choices. A cynical view suggests that various elite
groups, particularly those that benefit economically from development,
control the decision-making process. From an information standpoint, a
question critical to understanding which view prevails may be ‘whose infor-
mation?’ whose worldviews are represented in a data base and in analytic
tools to understand the data, and do these representations exclude the views
of segments of society?
Questions about the role of land information in local government deci-
sion-making have been difficult to resolve because spatial technologies are
just maturing and because characterizing the decision-making process has
been and continues to be difficult. In particular, it is difficult to determine
what role land information plays in local land-use decisions because the
process is influenced by so many other factors, including political, eco-
nomic, legal, bureaucratic, personal and social pressures. And, the actors
involved may not always be entirely open, knowledgeable or forthright
about what has influenced decisions. Moreover, research must be done in
situ; we don’t have the luxury of controlled experiments in which we can
suffuse a jurisdiction with information to observe the result while control-
ling or accounting for this host of other factors.
Our project contributes to the discussion about the role of data and land
information in land-use decision-making by purposefully improving the
type, quality, and availability of land information and analysis in a jurisdic-
tion with an on-going and highly charged land-use decision-making scene.
We will attempt to gauge the influence and impact this has on land-use deci-
sion-making processes and outcomes through first-hand observation, post-
decision reconstruction, surveys, and other methods. Key questions include:
1 is new information being used?
• in what form?
• in what parts of the land-use planning process?
• how is it used (to support decision-making or to justify decisions)?
• does it or can it represent groups not traditionally empowered in
decision-making?
2 who is using it?
• do some groups use it more than others?
114 S. J. Ventura et al.
© 2002 Taylor & Francis
• are there technical barriers to fuller use by some groups?
• what would users be doing without it?
3 has the improved accuracy, specificity, and availability resulted in dif-
ferent decisions?
• which of these information attributes are particularly important?
• do the ‘using it’ groups have a real or perceived advantage in land
use debates?
• do any groups believe that information is missing or biased?
9.2 BACKGROUND
Dane County, Wisconsin (the County) is one of the fastest growing coun-
ties in the Midwest. It also continues to be one of the most productive agri-
cultural counties in the state, typically ranking first in the state and in the
top 50 nationwide in gross agricultural sales. The City of Madison is cen-
trally located in the county, and contains half the population (about
200,000 in 1998). Madison is a regional employment centre, including a
major state university, the state capital, and a rapidly growing high-tech
industry. It consistently ranks high in various liveability indexes, including
designation as the ‘Best City’ by Money Magazine in 1998.
For at least a couple of decades, the conversion of farmland to residen-
tial and commercial purposes has been contentious. The County Board
frequently splits along rural/urban lines on land-use issues, with pivotal
votes coming from fringe suburban areas. More effective land-use planning
was a major theme in the campaign of the current County Executive. She
followed her election with an effort to shift control from a regional plan-
ning commission that was regarded by some as ineffective, and incorporat-
ing this function in the County’s more technologically sophisticated
planning department. The Design Dane vision document (Falk 1998)
embraces geospatial information and visualization technologies as part of a
suite of tools to more effectively involve the public in land-use planning and
management.
A cooperative relation has existed between the County and the Univer-
sity of Wisconsin-Madison Land Information and Computer Graphics
Facility (LICGF) for almost two decades. LICGF has conducted research
and development on land information technologies and applications in this
‘real world’ context with the County, essentially reducing the County’s risk
in adopting innovative technologies. As a result, the County has a sophistic-
ated automated land information system used primarily for real property
listing, tax assessment, deeds recording, and soil and water conservation
(e.g. Tulloch et al. 1998; Miskowiak et al. 2000). They have recently begun
to use it for land-use planning as well.
GIS-enhanced land-use planning 115
© 2002 Taylor & Francis
A recent rejuvenation of the LICGF–Dane County relation represents
initial evidence that the ‘whose reality is represented’ question must be
considered in understanding how information is used. The County Executive’s
interests were piqued when she was shown a very different picture of how
much land could be considered ‘open space and farmland’ than that
depicted in a 25-year land-use plan done by the autonomous Dane County
Regional Planning Commission (DCRPC 1997), and shown in front-page
graphics of a local daily newspaper as ‘Room to Grow’ (Hall 1995). We
provided a different interpretation, from the County’s own databases, that
countered the RPC’s suggestion of almost completely unencumbered open
space beyond city boundaries. Our GIS-based analysis of land use classifi-
cation from tax assessment roles indicated that less than 50 per cent of the
county was developable farm and open space; in contrast, RPC used data
for their land-use plan that showed 85 per cent of the county in this cate-
gory, based on air photo interpretation. The tax assessors view includes all
residences, including vacant lots slated for development, farm houses now
used primarily as residences, and residences obscured by tree cover (Carl-
son 2000). It is arguably closer to the land owners view of what its use is
or could be (Heinzel et al. 1996).
116 S. J. Ventura et al.
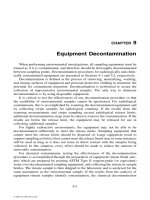
Figure 9.1 Patterns of Sprawl. This map displays patterns of development over three dec-
ades in Dane County, Wisconsin. It alerted citizens to the idea that development
has become more land consuming and less dense with population over time.
© 2002 Taylor & Francis
In Spring of 1998, the newly elected County Executive reviewed the com-
parison of ‘open/undeveloped land’ in the RPC’s 25-year land-use plan with
our tax-assessment-based version (Figure 9.1). She immediately grasped the
significance of the difference and the implications for where and how the
county could grow. It was apparent that development was scattered
throughout rural areas, generally following amenities such as prime vistas,
forested lands, and water resources, as well as other factors traditionally
thought to influence land use patterns such as proximity to good schools,
jobs, and transportation systems. Another study indicated that enforcement
of local subdivision ordinance and related land-use controls substantially
affected farmland conversion (Bukovac 1999). The County Executive
thought the differing land-use interpretations were significant. As a result,
we were asked to participate in County-led forums on land use and in sub-
sequent activities.
We have assisted the County in developing and disseminating land use
information using a variety of venues and events. We have guided the County
Executive’s staff in the analysis, display and dissemination of their own
geospatial data, particularly information related to land-use, ownership,
assessment, and resources. We have attempted to make high quality geospa-
tial data and information readily accessible to anyone interested in using it in
local land-use planning, in several forms and through several venues.
In the Fall of 1998, Dane County was selected by the Federal Geographic
Data Committee (FGDC) and Vice President Al Gore as the site of one of
six Community Demonstration Projects. This led to a project that became
known as ‘Shaping Dane’s Future’, a collaboration of the University, the
County, FGDC, the Natural Resources Conservation Service, and ESRI,
Inc. The City and Town of Verona (two local units of government, adjacent
to Madison) were selected as the project site because of significant land-
use issues and interest from local officials in helping evaluate information
technologies.
9.3 EVALUATING THE ROLE OF INFORMATION
TECHNOLOGIES IN LAND-USE PLANNING
To begin answering some of our questions about the efficacy and impact of
various information technologies, we have been providing information and
analysis tools while observing how decision-makers and interested citizens
and organizations react to and use geospatial technologies and information
products. These can be thought of as experiments about form of and access
to information. As part of collaboration with Dane County and the Shap-
ing Dane’s Future pilot project, we have conducted the following activities
to learn about the role of information technologies in land-use decision-
making.
GIS-enhanced land-use planning 117
© 2002 Taylor & Francis
• Land-use forums – Map-based and statistical overviews of County con-
ditions, resources and trends based on geospatial analysis were pre-
sented in several venues, including four County-sponsored ‘land-use
forums’, civic groups meetings, and a University-based seminar series
on the role of geospatial technologies in land-use planning. The County
land-use forum series included ‘listening sessions’, which provided an
opportunity to observe directly how participants were thinking about
and using geospatial information. In the largest County land-use forum
(over 300 participants), about 25 large format (48 ϫ 36 inches) maps
were displayed. Participants were given a brief survey after an ‘open-
house’ period of observation, with questions about which products
they found useful, what other products might be useful for land-use
planning, and how they saw themselves interacting with geospatial
technologies. As an incentive to complete the survey, participants were
promised a copy of the map of their choice. This experiment provided
information both directly from the survey, and indirectly from tabula-
tions of which maps participants selected as their reward for survey
completion.
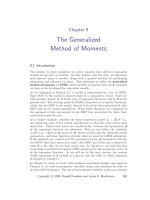
• Allocation experiment – In another County land-use forum session,
participants were divided into small groups and asked to place dots on
large format maps to designate areas for future residential develop-
ment. The maps portrayed factors related to growth opportunities and
constraints. Different dots represented different numbers of residences
118 S. J. Ventura et al.
Figure 9.2 Citizens participating in land-use allocation exercise.
© 2002 Taylor & Francis
(by dot colour) and development density (by dot size). Each group was
responsible for allocating 75,000 new residents, the expected growth in
Dane County by 2020 (Figure 9.2).
• Land information bulletin series – We developed a series of bulletins
that guide land planning professionals, citizens, and decision-makers
through components of land-use planning that involve spatial assess-
ment and analysis. The series corresponds to the web-based ‘planning
tool kit’. The bulletins are distributed in hardcopy form to a variety of
audiences, depending on subject.
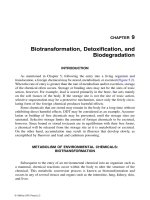
• Website development – We developed a website (www.lic.wisc.edu/shap
ingdane), the ‘Planning Resource Center’, to assist citizens and planners in
using geospatial technologies and the County’s data for land-use planning
(Figure 9.3). It includes WebGIS (based on ESRI’s ArcIMS) to view data
and create maps over the Internet. Advanced capabilities allow users to
perform queries, download data, and post notes on the data layers and
maps. Digital post-it notes create a mechanism by which users interact
and share ideas via the Internet. The website also includes a portal to addi-
tional local land-use planning information and a link to the CyberCivic
opinion registration and voting tools (see below). The website has been
evaluated by local participants and modified to accommodate their needs
and interests. We are monitoring domains of computers accessing the
web-based material and asking viewers to provide feedback on the mater-
ial and comments on the general approach with an open-ended mailto.
GIS-enhanced land-use planning 119
Figure 9.3 Planning Resource Center website (www.lic.wisc.edu/shapingdane).
© 2002 Taylor & Francis
• Training experiment – We provided free training in commercial GIS
and visualization software, and their use in planning using the County
data sets. Initially, we offered five 1-day sessions on five different
aspects of land-use planning. This experiment provided us with data on
who in the community were interested in improving their aptitude for
GIS-based planning and for which aspects of planning they consider
GIS to be an appropriate tool. The courses were so popular that we
have continued to offer them on a cost-recovery basis. Additional
courses have been set up specifically for the needs of the Verona proj-
ect participants.
• Software module development – We assembled existing software and
developed new software for five land-use planning elements (explo-
ration, analysis, allocation, impact, public access). Selection of existing
packages and development of new software were based on citizen and
County staff participation during module development, who provided
feedback on the usefulness, ease of use, and ability of modules to
engage and involve citizens in land-use issues.
• Electronic ‘Town Hall’ – In collaboration with a local e-business
(CyberCivic.com), we have linked to a web-based tool for citizens to
register opinions with elected officials, vote their preferences on con-
troversial land-use issues, and post comments in a chat-room and a bul-
letin board. This website was used as the hub of a live electronic town
meeting, in which several elected officials responded to questions from
a live audience, from phone lines, and from e-mail. Responses were
simultaneously broadcast on a local cable television station, a local
radio station, and the website.
The overt goal for our activities is to make geospatial data and information
readily accessible to anyone interested in using it for local land-use plan-
ning and related applications. This was accomplished through the litany of
activities listed above, as well as continual meetings with local officials and
citizens. We tried to de-mystify and simplify user interfaces and other
aspects of geospatial technologies that have hindered access to databases
and analysis using currently available commercial tools. We also recorded
participants’ ideas and feedback on data and analyses, so that they felt
they could guide what kind of information and information products were
generated.
The covert goal of our project is to determine if this unprecedented access
to and education about geospatial technologies and products makes any
difference in the planning process. We have surveyed and interviewed par-
ticipants to directly find out how individuals and factions/organizations
perceive the impact and utility of geospatial technologies. We also gathered
indirect evidence, such as where and how GIS-derived products and facts
were used in documents and meetings, based on what kinds of participant-
120 S. J. Ventura et al.
© 2002 Taylor & Francis
generated questions, whether these are used to help make decisions or used
to justify decisions, and which factions or organizations seem to be able to
make most effective use of them.
Two general strategies are being used to answer the three key questions
raised in the introduction.
First, behavioural measures were used to observe land-use decisions and
the products that were used in the process. Behavioural measures built into
software programs tracked individual decisions. These were supplemented
by direct observation of how selected officials and citizen-planners navi-
gated and used web resources, and how they responded to open-ended sug-
gestions for activities in training sessions. Behavioural measures were also
obtained from observations of group meetings; notes were later evaluated
using content analysis procedures.
Second, self-reported behaviour using questionnaires were used where
direct measures of behaviour were not possible or inefficient. Question-
naires have the advantage of being able to explore beliefs and attitudes that
underlie the behaviours in question. As part of the Shaping Dane’s Future
project, a survey was sent to all residents in the Town of Verona (about
700) as well as non-resident landowners (about 50). This survey followed a
modified Dillman (1978) method of survey research, and resulted in over
70 per cent response rate. In addition to questions pertaining to land-use
attitudes and beliefs, we asked how citizens learned about land-use issues
and their degree of access to Internet and other computer resources. We will
conduct a similar survey next year (2001) to directly measure if there has
been a change in how people access information about land-use and to
determine if there are changes in perceptions about the issues.
While true experiments comparing the influence and impact of land
information analysis and visualization between different communities of
users may not always be possible, the careful use of this quasi-experimen-
tal time-series design should be useful in isolating factors that influence
which information technologies are adopted and how these are used.
9.4 RESULTS AND DISCUSSION
Most evidence to date indicates a high degree of interest in improved land
information analysis and visualization from County staff, local (City and
Town of Verona) staff and officials, and other factors typically involved in
land-use decision-making. Requests for additional information products
from new analyses continue. The requests are increasingly specific about
the type and form of analyses and products, indicating a more sophisticated
understanding of the spatial database and what is feasible in analyses and
products. The county continues to invest more than 1/2 million dollars
annually in land information systems and staff. The use of spatial information
GIS-enhanced land-use planning 121
© 2002 Taylor & Francis
technologies is touted by County staff and officials as a key component in
resolving some of the County’s vexing land-use issues. The following is a
brief description of what we have learned from the various ‘experiments’,
as well as our meeting observations, interviews, and survey.
Based on the land-use forum and on the Verona survey, citizens come into
the process with a relatively high level of computer acumen. Ninety-two per
cent of the participants in land-use forums had home computers and 70 per
cent had Internet access. Though these were presumably citizens motivated
to become involved in county-wide land-use issues, approximately the same
percentages of access to computers and Internet were recorded in the sur-
vey of all households in the Town of Verona.
Participants are also map-literate and readily learn spatial analysis. Par-
ticipants in the forums, electronic town halls, and web-browsing consist-
ently study or select complicated composite maps depicting several factors
related to land-use and conditions, as opposed to simpler single-theme
products. In sessions with GIS technicians, participants quickly grasped the
information potential of thematic overlay, asking questions such as ‘how
many land parcels taxed as residential land but without improvements (e.g.
vacant lots) exist at elevations about 900 feet.’
The allocation experiment provided explicit evidence about preferred
development patterns and strategies of different societal factions (e.g.
developers, farmers, rural or urban elected officials, environmentalists, etc.,
at least to the extent that the small groups were identifiable as particular
factions). Preferred strategies conformed with expectations. For example,
one group placed almost all their dots in and near existing urban areas, a
‘compact growth’ strategy favoured by environmentalists; another group
scattered dots through a more rugged section of the county, with none in a
region of highly productive farms, suggesting a farmland preservation strat-
egy. All groups understood the spatial analysis involved in the exercise and
how the underlying data contributed to their ability to make allocation
decisions.
Almost all workshop participants found the land-use planning training
very useful. Over 280 people applied for 100 available slots, indicating a
high level of interest in becoming better able to use spatial technologies and
data for land-use planning. Shaping Dane’s Future project participants have
eagerly participated in additional training and served as ‘guinea pigs’ as we
develop and test new software. It appears that in a day of training, general
planning concepts and ‘hands-on’ use of GIS software adapted to this
domain can be conveyed to lay audiences.
It is too early in our experiments and observation to say definitively
whether our infusion of better land information has engaged more people
in the decision-making process or influenced land-use decisions. Clearly
though, it has been an important component of the County’s process. Land
122 S. J. Ventura et al.
© 2002 Taylor & Francis
information and spatial analysis were prominent components of the public
land-use forums. A land-use vision statement by the County – Design Dane
(Falk 1998) – included many maps that were clearly the products of a GIS.
A content analysis of that document revealed at least 38 different calls for
information products or spatial analyses to support the County’s proposed
land-use goals. In it, the County Executive called for ‘improving the way we
do business by developing new information technologies to make more
informed growth decisions’.
Verona participants have essentially re-designed their local land-use plan-
ning efforts to incorporate information technologies. GIS would not have
been used if it had not been made accessible and understandable through
the Shaping Dane’s Future project. The citizen Land-use Planning Task
Force was clearly excited by the information generated from using live,
interactive GIS as part of their deliberations. They also quickly noted some
key information (wetlands and floodplains) missing from the GIS data base,
evidence that data availability is a key information attribute. The final plan,
due out within a few months, will contain numerous GIS-generated prod-
ucts, including sophisticated analyses such as farmland preservation zones
based on bio-physical and socio-economic criteria.
The extent to which other actors in land-use decision-making adopt and
use the products and technologies remains to be determined. Though
‘hands-on’ use of GIS seems to be primarily by technologically inclined par-
ticipants, it is apparent that most involved in the process grasp the mapping
and spatial analysis concepts, and many use the web as an information
resource, including the WebGIS component.
In the Verona situation, we have observed that many factions, including
short- and long-term residents, farmers (though characterizing them as a
single group on land-use issues is fallacious), environmentalists, and devel-
opers have embraced the use of spatial technologies in land-use planning
and decision-making. This is not to suggest that other groups affected by
land-use decisions will or will not recognize GIS’s role in decision-making.
We will learn more about this with the follow up survey next year. Similarly,
we will only be able to determine if particular groups have significantly
benefited or been disadvantaged by the Verona land-use after it is finalized
and all groups have a chance to react to it. If we can surmount the difficult
methodological hurdle of determining who wins and who loses in the over-
all land-use process, then we will determine whether GIS was among the
causal factors in these outcomes.
At this point, practitioners promoting more accessible land records can
be comforted that we have no evidence to suggest that this has disadvant-
aged any groups or individuals. Their influence appears to be positive,
though of course this is an ongoing drama with many layers and perspect-
ives that await more comprehensive evaluation.
GIS-enhanced land-use planning 123
© 2002 Taylor & Francis
REFERENCES
Bukovac, J. (1999) Town Government’s Role in Explaining the Spatial Variation of the
Rate of Farmland Loss, MS Thesis, Land Resources, University of Wisconsin-Madison.
Carlson, J. (2000) Evaluating a Residential Land use Map Generated from Tax
Assessment Data, MS Thesis, Environmental Monitoring, University of Wisconsin-
Madison.
DCRPC (Dane County Regional Planning Commission) (1997) Vision 2020: Dane
County Land use and Transportation Plan, DCRPC, Dane County, WI.
Dillman, D. A. (1978) Mail and Telephone Surveys: the Total Design Method, New
York: Wiley and Sons.
Falk, K. M. (1998) Design Dane! Creating a Diverse Environment Through Sens-
ible, Intelligent Growth Now, Dane County Executive’s Office, Dane County, WI.
Hall, D. J. (1995) ‘Room to grow – the questions are: how and where?’ Wisconsin
State Journal (July 30): 1A.
Heinzel, W. M., Niemann, B. J. Jr. and Ventura, S. J. (1996) ‘Integration of spatial
technology: land tenure and land use change’, GIS ’96 Conference Proceedings,
Fort Collins, CO. CD number B, track 1–3, GIS World, Inc.
Knaap, G. J., Hopkins, L. D. and Donaghy, K. P. (1998) ‘Do plans matter? A frame-
work for examining the logic and effects of land use planning’, Journal of Plan-
ning Education and Research 18(1): 25–34.
Miskowiak, D., Ventura, S. J. and Sutphin, T. (2000) ‘Farmland Preservation
Zones’, Land Information Bulletin, Number 2 (Spring 2000) Land Information
and Computer Graphics Facility, University of Wisconsin-Madison.
Niemann, B. J. Jr. (1987) ‘Better information for better decisions: no question about
it’, Proceedings, URPIS 15, pp. 187–194.
Tulloch, D., Moyer, D. D. and Niemann, B. J. (1998) ‘Modernizing Dane County’s
register of deeds: saving property owners $6 million’, Land Information Bulletin,
No. 1, (Spring 1998), Land Information and Computer Graphics Facility, Univer-
sity of Wisconsin-Madison.
Zwart, P. R. (1988) ‘Some observations on the real impact of integrated land infor-
mation systems upon public decision making in Australia’, Papers from the 1988
Annual Conference of the Urban and Regional Information Systems Association,
1: 68–79.
Zwart, P. R. (1991) ‘Some indicators to measure the impact of land information
systems in decision-making’, Proceedings of the Urban and Regional Information
Systems Association, vol. 2.
124 S. J. Ventura et al.
© 2002 Taylor & Francis