OCEANOGRAPHY and MARINE BIOLOGY: AN ANNUAL REVIEW (Volume 45) - Chapter 8 (end) pps
Bạn đang xem bản rút gọn của tài liệu. Xem và tải ngay bản đầy đủ của tài liệu tại đây (2.03 MB, 72 trang )
407
CLIMATE CHANGE AND AUSTRALIAN MARINE LIFE
E.S. POLOCZANSKA
1
, R.C. BABCOCK
2
, A. BUTLER
1
, A.J. HOBDAY
3,6
,
O. HOEGH-GULDBERG
4
, T.J. KUNZ
3
, R. MATEAR
3
, D.A. MILTON
1
,
T.A. OKEY
1
& A.J. RICHARDSON
1,5
1
Wealth from Oceans Flagship — CSIRO Marine & Atmospheric Research, PO Box 120, Cleveland,
Queensland 4163, Australia
E-mail:
2
Wealth from Oceans Flagship — CSIRO Marine & Atmospheric Research, Private Bag 5,
Floreat, Western Australia 6913, Australia
3
Wealth from Oceans Flagship — CSIRO Marine & Atmospheric Research, GPO Box 1538,
Hobart, Tasmania 7001, Australia
4
University of Queensland, Centre for Marine Studies,
St Lucia, Queensland 4072, Australia
5
University of Queensland, Department of Mathematics,
St Lucia, Queensland 4072, Australia
6
University of Tasmania, School of Zoology, Private Bag 5,
Hobart, Tasmania 7001, Australia
Abstract Australia’s marine life is highly diverse and endemic. Here we describe projections of
climate change in Australian waters and examine from the literature likely impacts of these changes
on Australian marine biodiversity. For the Australian region, climate model simulations project oceanic
warming, an increase in ocean stratification and decrease in mixing depth, a strengthening of the
East Australian Current, increased ocean acidification, a rise in sea level, alterations in cloud cover
and ozone levels altering the levels of solar radiation reaching the ocean surface, and altered storm
and rainfall regimes. Evidence of climate change impacts on biological systems are generally scarce
in Australia compared to the Northern Hemisphere. The poor observational records in Australia are
attributed to a lack of studies of climate impacts on natural systems and species at regional or
national scales. However, there are notable exceptions such as widespread bleaching of corals on
the Great Barrier Reef and poleward shifts in temperate fish populations. Biological changes are
likely to be considerable and to have economic and broad ecological consequences, especially in
climate-change ‘hot spots’ such as the Tasman Sea and the Great Barrier Reef.
Introduction
The global climate is changing and is projected to continue changing at a rapid rate for the next
100 yr (IPCC 2001, 2007). Average global temperatures have risen by 0.6 ± 0.2°C over the twentieth
century and this warming is likely to have been greater than for any other century in the last
millennium. The 1990s were the warmest decade globally of the past century; and the present
decade may be warmest yet (Hansen et al. 2006). Most of the warming observed during the last
50 yr is attributable to anthropogenic forcing by greenhouse gas emissions (Karoly & Stott 2006).
The increase in global temperature is likely to be accompanied by alterations in patterns and strength
of winds and ocean currents, atmospheric and ocean stratification, a rise in sea levels, acidification
of the oceans and changes in rainfall, storm patterns and intensity. Evidence is mounting that the
© 2007 by R.N. Gibson, R.J.A. Atkinson and J.D.M. Gordon
E.S. POLOCZANSKA ET AL.
408
changing climate is already impacting terrestrial, marine and freshwater ecosystems (Hoegh-
Guldberg 1999, Walther et al. 2002, Parmesan & Yohe 2003, Root et al. 2003, Walther et al. 2005).
Species’ distributions are shifting poleward (Parmesan et al. 1999, Thomas & Lennon 1999,
Beaugrand et al. 2002, Hickling et al. 2006), plants are flowering earlier and growing seasons are
lengthening (Edwards & Richardson 2004, Wolfe et al. 2005, Linderholm 2006, Schwartz et al.
2006) and timing of peak breeding and migrations of animals are altering (Both et al. 2004,
Lehikoinen et al. 2004, Weishampel et al. 2004, Jonzén et al. 2006, Menzel et al. 2006). Most of
this evidence, however, is from the Northern Hemisphere, with few examples from the Southern
Hemisphere and only a handful from Australia (Chambers 2006). The lack of observations in
Australia is attributed to a lack of studies of climate impacts on natural systems and species at
regional or national scales. Further, the extent of historical biological datasets in Australia is largely
unknown, many are held by small organisations or by individuals and the value of these datasets
may not be recognised (Chambers 2006).
Because of the unique geological, oceanographic and biological characteristics of Australia,
conclusions from climate impact studies in the Northern Hemisphere are not easily transferable to
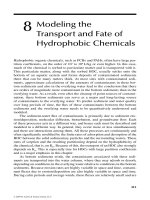
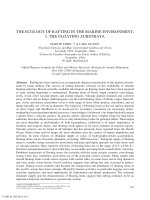
Australian systems. Including fringing islands, Australia has a coastline of almost 60,000 km
(Figure 1) that spans from southern temperate waters of Tasmania and Victoria (~45°S) to northern
tropical waters of Cape York, Queensland (~10°S). Australia is truly a maritime country with over
90% of the population living within 120 km of the coast. Most of Australia’s population of 20 million
live in the southeast with the west and north coasts being sparsely populated. Around 40% of
Australia’s population live in the cities of Sydney and Melbourne alone (Australian Bureau of
Statistics 2006).
Figure 1 (See also Colour Figure 1 in the insert following page 344.) Map of Australia indicating the locations
discussed in the text. The 200 nm EEZ for Australia is marked by the dashed line, and the 200 m depth contour
by the solid line.
10°
20°
30°
40°
50°
110° 120° 130° 140° 150° 160° 170° 180° 190°
Indian
Ocean
Scott
Reef
Exmouth
Gulf
Darwin Gulf of
Carpentaria
Cape
Yor k
To rr es Strait
Great Barrier Reef
Hervey Bay
Brisbane
Moreton Bay
Hawkesbury Estuary
Pacific Ocean
Botany Bay
Sydney
Adelaide
Melbourne
Shark Bay
Houtman Abrolhos
Islands
Perth
Albany
Australia
Tasmania
New Zealand
Tasmanian Seamounts
Marine Reserve
Ta sman Sea
Corner Inlet
Hobart
Bass Strait
Southern Ocean
© 2007 by R.N. Gibson, R.J.A. Atkinson and J.D.M. Gordon
CLIMATE CHANGE AND AUSTRALIAN MARINE LIFE
409
Australia has sovereign rights over ~8.1 million km
2
of ocean and this area generates consid-
erable economic wealth estimated as $A52 billion per year or about 8% of gross domestic product
(CSIRO 2006). Fisheries and aquaculture are important industries in Australia, both economically
(gross value over $A2.5 billion) and socially. Marine life and ecosystems also provide invaluable
services including coastal defence, nutrient recycling and greenhouse gas regulation valued globally
at $US 22 trillion ($A27 trillion) per annum (Costanza et al. 1997). The annual economic values
of Australian marine biomes have been estimated: open ocean $A464.7 billion, seagrass/algal beds
$A175.1 billion, coral reefs $A53.5 billion, shelf system $A597.9 billion and tidal marsh/mangroves
$A39.1 billion (Blackwell 2005). This assessment assumes Australian marine ecosystems are
unstressed so actual values may be lower for degraded systems. Compared to other countries,
relatively little is known about the biology and ecology of Australia’s maritime realm, mainly due
to the inaccessibility and remoteness of much of the coast as highlighted by the discovery of living
stromatolites (representing the one of the oldest known forms of life on Earth) in Western Australia
in the 1950s (Logan 1961).
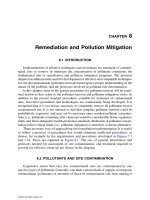
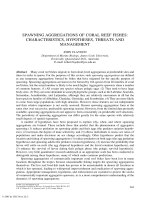
Australia is unique among continents in that both the west and east coasts are bounded by
major poleward-flowing warm currents (Figure 2), which have considerable influence on marine
flora and fauna. The East Australian Current (EAC) originates in the Coral Sea and flows southward
before separating from the continental margin to flow northeast and eastward into the Tasman Sea
(Ridgway & Godfrey 1997, Ridgway & Dunn 2003). Eddies spawned by the EAC continue
southward into the Tasman Sea bringing episodic incursions of warm water to temperate eastern
Australia and Tasmanian waters (Ridgway & Godfrey 1997). The Leeuwin Current flows southward
along the Western Australian coast and continues eastward into and across the Great Australian
Bight reaching the west of Tasmania in austral winter (Ridgway & Condie 2004). The influence
of these currents is evident from the occurrence of tropical fauna and flora in southern Australian
waters at normally temperate latitudes (Maxwell & Cresswell 1981, Wells 1985, Dunlop & Wooller
1990, O’Hara & Poore 2000, Griffiths 2003). The importance of these major currents in structuring
marine communities can be seen in the biogeographic distributions of many species, functional
Figure 2 Major currents and circulation patterns around Australia. The continent is bounded by the Pacific
Ocean to the east, the Indian Ocean to the west and the Southern Ocean to the south. Figure courtesy of
S. Condie/CSIRO.
Tasman sea
Tasmania
Great
Australian Bight
Western
Australia
South
Australia
Victoria
New
South
Wales
Northern
Te rr it ory
Queensland
Coral sea
S
o
u
t
h
E
q
u
a
t
o
r
i
a
l
C
u
r
r
e
n
t
L
e
e
u
w
i
n
C
u
r
r
e
n
t
E
a
s
t
A
u
s
t
r
a
l
i
a
n
C
u
r
r
e
n
t
S
o
u
t
h
E
q
u
a
t
o
r
i
a
l
C
u
r
r
e
n
t
© 2007 by R.N. Gibson, R.J.A. Atkinson and J.D.M. Gordon
E.S. POLOCZANSKA ET AL.
410
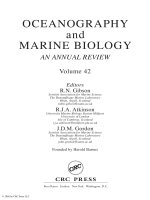
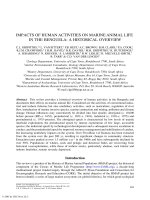
groups and communities. For example, there is broad agreement between phytoplankton community
distributions and water masses (Figure 3).
Australian waters are generally nutrient poor (oligotrophic), particularly with respect to nitrate
and phosphate because the boundary currents are largely of tropical and subtropical origins and
there is little input from terrestrial sources. In general, Australia has a low average annual rainfall
and this rainfall is highly variable. Much of the interior is desert and in the west the aridity extends
to the coast. Monsoonal rains fall in the tropical north during the wet season (December to March)
with cyclones common at this time, but there is little or no rainfall during the rest of the year.
Australian soil is generally low in nutrients and this, together with the high variability in rainfall,
results in little terrestrial nutrient input into the surrounding sea. The generally oligotrophic status
of Australian marine waters contrasts with many mid-latitude productive coastal areas around the
world. This distinction is particularly strong on the western coast of Australia where the Leeuwin
Current replaces the upwelling systems produced by the highly productive eastern boundary currents
characteristic of all other major ocean basins.
The impact of changing productivity on marine oligotrophic systems is largely unknown; they
may not be as resilient to stress and disturbance, including climate change, as more productive
Figure 3 (See also Colour Figure 3 in the insert.) Phytoplankton provinces around Australia. In northern shelf
waters westwards from Torres Strait tropical diatom species dominate, with slight regional differences in
relative abundances and absolute biomass (1a-c). The shallow waters of the Great Barrier Reef region (3) are
dominated by fast-growing nano-sized diatoms. The deeper waters of the Indian Ocean and the Coral Sea are
characterised by a tropical oceanic flora (2a and 2c, respectively) that is dominated by dinoflagellates and
follows the Leeuwin Current (2b) and the East Australia Current and its eddies (2d). South-eastern coastal
waters harbour a temperate phytoplankton flora (4) with seasonal succession of different diatom and dinoflagel-
late communities. Waters south of the tropical and temperate phytoplankton provinces are characterised by
an oceanic transition flora (5a,b) that communicates to the subantarctic phytoplankton province (6) and is
highly variable in extent. The phytoplankton provinces are associated with surface water masses and the
zooplankton fauna likely shows a similar pattern (Figure prepared by G.M. Hallegraeff for CSIRO and National
Oceans Office).
2a
1a
1b
2c
1c?
3
2d
2d
2b
5a
2d
5b
4
6
10°00’S
110°00’E 120°00’E 130°00’E 140°00’E 150°00’E
110°00’E 120°00’E 130°00’E 140°00’E 150°00’E
20°00’S
30°00’S
40°00’S
10°00’S
20°00’S
30°00’S
40°00’S
Perth
Esperance
Western Australia
South Australia
Australia
Port Hedland
Kimberlays
Cairns
Northern
Te rritory
New South
Wales
Darwin
Ceduna
Adelaide
Victoria
Sydney
Canberra
ACT
Melbourne
Tasmania
Hobart
Brisbane
Queensland
Mackey
Burketown
N
© 2007 by R.N. Gibson, R.J.A. Atkinson and J.D.M. Gordon
CLIMATE CHANGE AND AUSTRALIAN MARINE LIFE
411
systems that commonly experience considerable interannual variability. Changes in the terrestrial
climate also impact Australia’s marine ecosystems to a greater degree than other parts of the world,
so it may not be possible to generalise easily from knowledge elsewhere. Aeolian dust input may
be an important regulator of coastal primary production. In regions south of Tasmania, where
macronutrient concentrations are always high, iron availability influences growth, biomass and
composition of phytoplankton (Sedwick et al. 1999, Boyd et al. 2000). In the macronutrient-limited
regions more typical of the waters around continental Australia, the atmospheric supply of iron
may stimulate nitrogen-fixing phytoplankton, which have a higher iron requirement than other
phytoplankton and therefore influence phytoplankton community composition (Jickells et al. 2005).
Climate-induced changes in wind or rainfall may thus have disproportionately large consequences
for waters around Australia.
Climate change will influence physiology, abundance, distribution and phenology of species
both directly and indirectly, although impacts will usually become most apparent at an ecosystem
level. Given the intrinsic complexity of ecosystems and the uncertainties in future climate projec-
tions, predicting consequences for biodiversity is difficult and highly speculative. Response rates
will depend on the magnitude of changes and on longevity of the species involved in a particular
system. Plankton systems will therefore respond quickly (Hays et al. 2005), whereas a lag might
generally be expected in responses of long-lived species. The ability for adaptation to change will
also vary among species but the rapid rate of present climate change coupled with high exploitation
and destruction or alteration of habitats will compromise the resilience of many populations and
ecosystems (Travis 2002). Strategies for adaptation and mitigation of climate change impacts must
begin with the identification of ecosystems or populations that are most vulnerable to change and
those most vulnerable to other anthropogenic stressors.
In this review, we address the potential impacts of climate variability and climate change on
Australian marine life from the intertidal zone through pelagic waters and into the deep sea. We
provide a synopsis of climate change projections for Australia of key climate variables known to
regulate marine ecosystems from the only IPCC (Intergovernmental Panel of Climate Change)
climate system model constructed in the Southern Hemisphere, the Commonwealth Scientific and
Industrial Research Organisation (CSIRO) Mk3.5 model. Our focus is on the critical variables that
regulate processes in marine ecosystems, namely, temperature, winds, currents, solar radiation,
mixed-layer depth and stratification, pH and calcium carbonate saturation state, storms and precip-
itation, and sea level. We review the expected impacts on species and communities of changes in
each of these variables based on laboratory, modelling and field work and concentrate on biological
groups found in three broad ecosystems: coastal, pelagic and offshore benthic.
Australian marine biodiversity
Australia has highly diverse and unique marine flora and fauna, ranging from spectacular coral
reefs in the tropics to giant kelp forests in Tasmanian waters. The biodiversity of tropical Australia
is high because it is a continuation of the Indo-Pacific biodiversity hot spot, but much of this fauna
is threatened by overharvesting and unregulated development in this region including countries to
the north of Australia. The species diversity of seagrasses and mangroves is among the world’s
highest, particularly in tropical Australia (Walker & Prince 1987, Kirkman 1997, Walker et al.
1999). Temperate Australian waters contain high numbers of endemic organisms due to their long
history of geographic isolation from other temperate regions (Poore 2001). Australian waters also
harbour species and ecosystems that are of international importance. The best-known example is
the Great Barrier Reef, which is the world’s largest World Heritage Area and extends some 2100
km along the coast of northeast Australia.
© 2007 by R.N. Gibson, R.J.A. Atkinson and J.D.M. Gordon
E.S. POLOCZANSKA ET AL.
412
Although Australian temperate waters have lower species diversity than the northern tropical
waters, they harbour much higher numbers of endemic species (Poore 2001). Approximately 85%
of fish species, 90% of echinoderm species and 95% of mollusc species in these southern waters
are endemic (Poore 2001). This high endemism is also documented in Australia’s temperate
macroalgae (Bolton 1996, Phillips 2001). High endemism along the southern coastline is partly
the result of low dispersal abilities of species and the presence of ecological barriers to dispersal
along the southern coastal waters such as a sharp temperature gradient near the cessation of the
Leeuwin Current and the absence of near-shore rocky reefs in the centre of the Great Australian
Bight and at other locations along the southern Australian coastline.
Australia’s fish fauna is extremely diverse and endemic by world standards due to a high
diversity of tropical and temperate habitats and due to the geographic isolation of the temperate
regions. Pelagic fish found around Australia include iconic species such as tuna, billfish (swordfish
and marlin) and sharks. The continental shelf waters off southern Queensland have been identified
as a biodiversity hot-spot for large pelagic fishes (Worm et al. 2003). In contrast to the pattern
elsewhere, this Australian pelagic fish hot spot is located in an area of high catch rates and fishing
effort (Campbell & Hobday 2003). Valuable fisheries exist, despite the generally low productivity
of Australian marine waters; these include the Northern Prawn Fishery, the Southern Bluefin Tuna
Fishery, the Eastern Tuna and Billfish Fishery and the Western Rock Lobster Fishery. Small pelagic
species, such as sardines, jack mackerel, redbait and squid are captured in lower-value but high-
volume coastal fisheries operating from a number of Australian ports. For many of these, there are
well-known correlations between environmental factors and the productivity of the fishery. For
example, the size of the Western Rock Lobster Panulirus cygnus Fishery, which is Australia’s most
important single-species fishery and the world’s largest rock lobster fishery, varies in a predictable
manner with the strength of the Leeuwin Current (Caputi et al. 2001). Similarly, size of banana
prawn Penaeus merguiensis catches in some areas of northern Australia is correlated with wet season
rainfall (Staples et al. 1982, Vance et al. 1985). These variables are likely to change as climate changes.
Further offshore, cold-water corals are found on seamounts and the continental rise, particularly
within the Tasmanian Seamounts Marine Reserve. Cold-water corals are hot spots for biodiversity,
comparable to shallow tropical coral reefs, although little is known of their ecology, population
dynamics or distribution in Australian waters. Over 850 macro- and megafaunal species were recently
found on seamounts in the Tasman and southeast Coral Seas, of which 29–34% were potential
endemics or new to science (Richer de Forges et al. 2000, Williams et al. 2006).
Globally significant populations of many other groups occur in Australia including populations
of marine turtles, marine mammals and seabirds. Six of the seven living species of marine turtle
forage and breed in Australian tropical waters. Marine turtles home to their natal area to breed and
large rookeries used by tens to hundreds of thousands of turtles occur along the northern Australian
coastline and the southern Great Barrier Reef area (Marsh et al. 2001). The flatback turtle Natator
depressus nest only on Australian beaches so can be considered endemic to Australia. The dugong
Dugong dugon forages on seagrasses in tropical Australasian waters. This species is highly threat-
ened in much of its range and a large proportion of global dugong stock is believed to be in Moreton
Bay in eastern Australia and Shark Bay in Western Australia (Marsh et al. 2001). Australian fur
seals Arctocephalus pusillus doriferus, the world’s fourth rarest seal species, and the endemic
Australian sea lion Neophoca cinerea, one of the most endangered pinnipeds in the world, breed
at sites along the southern coast of Australia. These non-migratory pinniped species remain in
southern Australian waters for their entire lives. Around 45 species of whales, dolphins and
porpoises are found in Australian waters including large baleen whales such as the southern right
whale Eubalaena australis and the humpback whale Megaptera novaeangliae, which migrate from
their Southern Ocean feeding grounds to temperate waters around the southern parts of Africa,
South America and Australia and to the tropical waters of the Pacific to breed.
© 2007 by R.N. Gibson, R.J.A. Atkinson and J.D.M. Gordon
CLIMATE CHANGE AND AUSTRALIAN MARINE LIFE
413
A diverse seabird fauna breeds on mainland and island coastlines around Australia; for example
the Houtman Abrolhos Islands on the west coast are an important nesting area for Australian seabirds
in terms of biomass and species diversity (Ross et al. 2001). One of the largest documented colonies
of crested terns Sterna bergii globally (13,000–15,000 nesting pairs) occurs in the Gulf of Carpen-
taria in Australia’s tropical north (Walker 1992). Planktivorous seabirds occur in high numbers in
Australia’s southern temperate waters. For example an estimated 23 million short-tailed shearwaters
Puffinus tenuirostris nest in southeast Australia (Ross et al. 2001).
Climate change projections for Australia
A number of climate models have been used to investigate the response of the ocean-atmosphere
system to increased levels of greenhouse gases and aerosols (Cubasch et al. 2001). This review
examines aspects of climate simulations that are relevant to determining how marine ecosystems
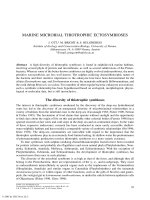
will respond to global climate change. In general, climate model simulations using future greenhouse
gas emission scenarios project oceanic warming, an increase in oceanic stratification and alteration
of mixing depth, changes in circulation, increased pH and rise in sea level, alterations in cloud cover
and ozone levels and thus solar radiation reaching the ocean surface and altered storm and rainfall
regimes (Figure 4). It is very likely that such changes will cause considerable alterations in marine
biological communities (Bopp et al. 2001, Boyd & Doney 2002, Sarmiento et al. 2004).
We use future climate projections over the next century from the CSIRO Mk3.5 climate model
(hereafter called the CSIRO climate model; Appendix 1) using the IS92a future emissions scenario,
often referred to as the ‘business-as-usual’ scenario. Although there are subtle differences between
the CSIRO climate model and other international models, many of the general trends in these fields
are similar and we use the CSIRO climate model to suggest the magnitude of the projected changes
in the set of variables that follow.
Figure 4 Important physical and chemical changes in the atmosphere and oceans as a result of climate change.
HUMAN ACTIVITIES
Increased greenhouse gas
concentration
Altered storm
regimes/rainfall
Warmer air temperatures
Altered atmospheric
circulation (winds)
Rise in sea-level
Ocean acidification
Warmer sea temperatures
Altered oceanic
circulation
(currents)
Altered nutrient
supply and
stratification
(mixed layer depth)
Increased
dissolved CO
2
Change in UV radiation
levels
A
l
t
e
r
e
d
r
u
n
o
ff
© 2007 by R.N. Gibson, R.J.A. Atkinson and J.D.M. Gordon
E.S. POLOCZANSKA ET AL.
414
Ocean temperature
Waters around Australia are projected to warm by 1–2°C by the 2030s and 2–3°C by the 2070s
(Figure 5). The CSIRO climate model projects the greatest warming off southeast Australia and
this is the area of greatest warming this century in the entire Southern Hemisphere. This Tasman
Sea warming is associated with systematic changes in the surface currents on the east coast of
Australia; including a strengthening of the EAC and increased southward flow as far south as
Tasmania (Figure 5). This feature is present in all IPCC climate model simulations, with only the
magnitude of the change differing among models. Changes in currents leading to the Tasman Sea
warming observed to date is driven by a southward migration of the high-latitude westerly wind
belt south of Australia, and this is expected to continue in the future (Cai et al. 2005, Cai 2006).
Figure 5 (See also Colour Figure 5 in the insert.) Simulated annual means of SST (
°C) with annual mean
surface currents (cm/s) (left), annual mean zonal winds (m/s) (middle), and mixed layer depth (m) (right). In
the middle panels, westerly wind direction is denoted by positive sign, easterly wind direction by negative
sign. Top row: 1990s, bottom row: difference between 1990s and 2070s.
10°N
0°
10°S
20°S
30°S
40°S
50°S
60°S
60°E 80°E 100°E 120°E 140°E 160°E 180°
10°N
0°
10°S
20°S
30°S
40°S
50°S
60°S
60°E 80°E 100°E 120°E 140°E 160°E 180°
10°N
0°
10°S
20°S
30°S
40°S
50°S
60°S
60°E 80°E 100°E 120°E 140°E 160°E 180°
10°N
0°
10°S
20°S
30°S
40°S
50°S
60°S
60°E 80°E 100°E 120°E 140°E 160°E 180°
10°N
0°
10°S
20°S
30°S
40°S
50°S
60°S
60°E 80°E 100°E 120°E 140°E 160°E 180°
10°N
0°
10°S
20°S
30°S
40°S
50°S
60°S
60°E 80°E 100°E 120°E 140°E 160°E 180°
5
0
35
30
25
20
15
10
−5
−4
−6
10
8
6
4
2
0
−2
−8
260
240
220
200
180
160
140
120
100
80
60
40
20
0
20.0 cm/s
5.00 cm/s
2.6
2.4
2.2
2
1.8
1.6
1.2
1
0.8
0.6
0.4
0.2
0
1.4
6
5
4
3
2
1
0
−1
−2
−3
−4
−5
−6
−7
10
0
−10
−20
−30
−40
−50
−60
−70
−80
−90
−100
−110
−120
−130
© 2007 by R.N. Gibson, R.J.A. Atkinson and J.D.M. Gordon
CLIMATE CHANGE AND AUSTRALIAN MARINE LIFE
415
Winds
Under global warming scenarios, the southeasterly trade winds strengthen east of northern Australia,
but weaken to the west of the continent (Figure 5). Westerly winds in southern Australian waters
will weaken. In the Australian coastal region, downwelling will prevail due to the dominating winds
and density structure of the upper ocean. Increasing wind intensity may suppress localised upwelling
in the northeast. However, decreasing wind intensity in southern waters may facilitate localised
upwelling there.
Ocean currents
Surface currents on the east coast will show a systematic change (Figure 5) including EAC
strengthening and increased southward flow as far south as Tasmania. On the west coast there will
be no obvious strengthening of the Leeuwin Current. In the south, the Great Australian Bight region
will experience more westward transport as global temperatures rise. Along the northwest and
northeast coasts there will be an increase in the northward flow.
Mixed-layer depth and stratification
The Australian coastal region is generally a downwelling region due to prevailing winds and density
structure of the ocean. In oligotrophic marine regions of Australia, the dominant mechanism of
nutrient supply to the upper ocean is winter convective mixing due to cooling of surface waters.
Under these conditions the seasonal evolution of the mixed-layer depth and density differences
between this layer and the water below play an important role in the supply of nutrients to the
upper ocean. Surface ocean warming will stabilise the upper ocean and reduce the supply of nutrients
to the surface. The CSIRO climate model simulations project a decline in the annual mean mixed-
layer depth by the 2070s (Figure 5).
CO
2
, pH and calcium carbonate saturation state
Over the last 200 years, oceans have absorbed 40–50% of the anthropogenic CO
2
released into the
atmosphere (Raven et al. 2005). Rising atmospheric CO
2
concentrations via fossil fuel emissions
will lead to enhanced oceanic CO
2
as the ocean re-equilibrates with the perturbed atmosphere
(McNeil et al. 2003). Elevated CO
2
in the upper ocean will alter the chemical speciation of the
oceanic carbon system. As CO
2
enters the ocean it undergoes the following equilibrium reactions:
Two important parameters of the oceanic carbon system are the pH and the calcium carbonate
(CaCO
3
) saturation state of sea water (Ω). Ω expresses the stability of the two different forms of
CaCO
3
(calcite and aragonite) in sea water.
Increasing CO
2
concentration in the surface ocean via uptake of anthropogenic CO
2
will have
two effects. First, it decreases the surface ocean carbonate ion concentration (CO
3
2
−
) and decreases
Ω. Using an ocean-only model forced with atmospheric CO
2
projections (IS92a), Kleypas et al.
(1999) predicted a 40% reduction in aragonite saturation (Ω
arag
) by 2100. Laboratory experiments
CO H O H CO HCO H CO H
22 23 3 3
2
2+ ⇔⇔+ ⇔ +
− + − +
© 2007 by R.N. Gibson, R.J.A. Atkinson and J.D.M. Gordon
E.S. POLOCZANSKA ET AL.
416
have shown that some species of corals and calcifying plankton (Gattuso et al. 1998, Langdon et al.
2000, Orr et al. 2005) are highly sensitive to changes in Ω, which has led to the hypothesis of large
decreases in future calcification rates under elevated atmospheric CO
2
(Kleypas et al. 1999). Second,
when CO
2
dissolves in water it forms a weak acid (H
2
CO
3
) that dissociates to bicarbonate, generating
hydrogen ions (H
+
), which makes the ocean more acidic (pH decreases). Using an ocean-only
model forced with atmospheric CO
2
projections (IS92a), Caldeira & Wickett (2003) predicted a
pH drop of 0.4 units by the year 2100 and a further decline of 0.7 by the year 2300. They argued
that the oceanic absorption of anthropogenic CO
2
over the next several centuries may result in a
pH decrease greater than inferred from the geological record over the past 300 million years, with
the possible exception of those resulting from rare, extreme events such as meteor impacts.
Changes in surface pH and in Ω
arag
reflect changes in the speciation of carbon within the ocean
and are a function of temperature, salinity, alkalinity and dissolved inorganic carbon concentrations.
McNeil & Matear (2006) showed that climate change does not alter the projected change in surface
pH. The projected pH decrease is controlled by the future levels of atmospheric CO
2
. However,
the decline in Ω
arag
due to rising CO
2
levels in the ocean is slightly reduced (~15%) because of the
increase in Ω
arag
due to the increase in surface temperature. For the Australian region, the pH and
Ω
arag
for the 1990s are shown along with the corresponding change in these values relative to 1990s
(Figure 6). We see significant declines in these parameters but with the greatest declines occurring
off northeast Australia. A major unknown in this region is whether any dissolution of the tropical
coral reefs would buffer the pH decreases. Because of the enhanced levels of CO
2
in the atmosphere
and rates of fossil fuel burning, the process of ocean acidification is essentially irreversible over
the next century. It will take thousands of years for ocean chemistry to return to a condition similar
to that of preindustrial times.
Solar radiation
Highly energetic ultraviolet radiation (UVR) penetrates the ocean surface and is known to have
detrimental effects on marine organisms. UVR penetration to the earth’s surface increased during
the last quarter of the twentieth century as stratospheric ozone was depleted by chlorofluorocarbons
(CFCs), halons, hydrochlorofluorocarbons and other compounds. Stratospheric ozone levels appear
to have stabilised, however, due to the 1989 implementation of the Montreal Protocol designed to
phase out the production of CFCs and other compounds that deplete the ozone layer (de Jager et al.
2005).
Most climate models predict that the ozone layer will recover and thicken throughout the
twenty-first century (de Jager et al. 2005), so UVR penetration should decline (McKenzie et al.
2003). However, these predictions are somewhat uncertain, especially in the timing of the rethick-
ening, due to uncertainties in projections of greenhouse gas emissions and degradation and due to
the complex ways that chemical, radiative and dynamic processes will affect stratospheric ozone.
For example, chemical reactions of some greenhouse gases (such as methane) can reduce total
ozone in the stratosphere but the level of methane emissions is difficult to predict. Climate change
will also affect UVR penetration indirectly by influencing other factors such as aerosols, clouds
and snow cover. Aerosols can scatter more than 50% of the UV-B — the biologically important
component of UVR — and aerosols increased in the atmosphere during most of the twentieth
century, although they have shown declines since 1990 (Schiermeier 2005). Clouds can attenuate
15–30% of the UV-B, and cloud reflectance measured by satellite has shown a long-term increase in
some regions of the world (McKenzie et al. 2003). All these factors introduce considerable uncer-
tainty in future levels of UVR at the ocean surface, and it has been suggested that climate warming
will slow the recovery of the ozone layer by up to 20 yr (Kelfkens et al. 2002).
© 2007 by R.N. Gibson, R.J.A. Atkinson and J.D.M. Gordon
CLIMATE CHANGE AND AUSTRALIAN MARINE LIFE
417
Precipitation and storms
Changes in the amount or timing of rainfall and the associated river runoff affect the salinity regimes
of estuaries and adjacent coastal waters, while in comparison salinity is relatively constant through-
out the year in most oceanic waters. Despite the high uncertainty of rainfall projections in Australia,
there is a tendency for decreased rainfall over most of Australia and over the oceans in climate
model simulations (Figure 7). This general reduction in rainfall may be offset by an increase in
the frequency of intense storms (Emanuel 2005, Webster et al. 2005), which will increase rainfall
intensity and the associated runoff of freshwater and suspended sediments. In northern Australia,
tropical cyclones are important extreme rainfall events. A recent study under 3 times the baseline
levels of CO
2
conditions based on levels prior to the industrial revolution in the mid-1800s, projected
a 56% increase in the number of simulated tropical cyclones over northeastern Australia with peak
winds greater than 30 ms
−1
(Walsh et al. 2004). However, the behaviour of tropical cyclones under
Figure 6 (See also Colour Figure 6 in the insert.) Simulated annual means of pH (left) and aragonite saturation
state (right). Top row: 1990s, bottom row: difference between 1990s and 2070s.
10ºN
0º
10ºS
20ºS
30ºS
40ºS
50ºS
60ºS
10ºN
0º
10ºS
20ºS
30ºS
40ºS
50ºS
60ºS
60ºE
80ºE
100ºE
120ºE
160ºE
180º
140ºE
7
6.5
6
5.5
5
4.5
4
3.5
3
2.5
60ºE
80ºE
100ºE
120ºE
160ºE
180
º
140ºE
8.16
8.14
8.12
8.1
8.08
8.06
8.04
8.02
8
7.98
7.96
7.94
10ºN
10ºS
20ºS
30ºS
40ºS
50ºS
60ºS
10ºN
0º
10ºS
20ºS
30ºS
40ºS
50ºS
60ºS
60ºE
80ºE
100ºE
120ºE
160
ºE
180º
140
ºE
60ºE
80ºE
100ºE
120
ºE
160ºE
180º
140ºE
0º
−0.5
−0.6
−0.7
−0.8
−0.9
−1
−1.1
−1.2
−1.3
−1.4
−1.5
−0.09
−0.1
−0.11
−0.12
−0.13
−0.14
−0.15
−0.16
−0.17
−0.18
−0.19
© 2007 by R.N. Gibson, R.J.A. Atkinson and J.D.M. Gordon
E.S. POLOCZANSKA ET AL.
418
global warming is uncertain because they are not currently well resolved by global or regional
climate models (Pittock et al. 1996, Walsh & Pittock 1998).
Sea level
Rising sea level around Australia will flood existing coastal environments and alter their marine
habitats. With global warming, the CSIRO climate model projects a doubling in the rate of sea-
level rise from the observed 1.44 mm yr
−1
for the twentieth century (Church et al. 2001). By the
2080s, sea level is projected to rise by 0.06–0.74 m above the 1990 value (Gregory et al. 2001).
These projections take into account both the mean global projections from the IPCC scenarios and
the non-uniform spatial distributions of sea-level change related to thermal expansion produced by
the climate simulations. However, they do not include vertical land movement, which can be locally
important. Sea-level rise projected by the CSIRO model for just the thermal expansion shows an
increase in the entire Australian region but with large spatial variability (Figure 7). The variability
in sea-level rise reflects how the excess heating of the planet due to global warming is stored in
Figure 7 (See also Colour Figure 7 in the insert.) Simulated annual means of downward solar radiation at
the ocean surface (W/m
2
) (left), precipitation minus evaporation (mm/d) (middle), and sea-level height anomaly
due to upper ocean stratification relative to 2000 m (cm) (right). Top row: 1990s, bottom row: difference
between 1990s and 2070s.
10ºN
0º
10ºS
20ºS
30ºS
40ºS
50ºS
60ºS
60ºE
80ºE
100ºE
120ºE
160ºE
180º
140ºE
10ºN
0º
10ºS
20ºS
30ºS
40ºS
50ºS
60ºS
60ºE
80ºE
100ºE
120
ºE
160
ºE
180º
140ºE
10ºN
0º
10ºS
20ºS
30ºS
40ºS
50ºS
60ºS
60ºE
80ºE
100
º
E
120ºE
160ºE
180º
140ºE
10ºN
0º
10ºS
20ºS
30ºS
40ºS
50ºS
60ºS
60ºE
80ºE
100ºE
120ºE
160ºE
180º
140ºE
10ºN
0º
10ºS
20ºS
30ºS
40ºS
50ºS
60ºS
60
ºE
80ºE
100ºE
120ºE
160ºE
1
8
0º
140ºE
10ºN
0º
10ºS
20ºS
30ºS
40ºS
50ºS
60ºS
60ºE
80ºE
100
ºE
120ºE
160ºE
180º
140ºE
280
260
240
220
200
180
160
140
120
100
80
15
14
12
10
8
6
4
2
0
−2
−4
−6
260
240
220
200
180
160
140
120
100
80
60
40
20
100
80
60
40
20
0
−20
−40
−60
−80
3
2.5
2
1.5
1
0.5
0
−0.5
−1
−1.5
−2
−2.5
28
26
24
22
20
18
16
14
12
10
8
6
4
2
© 2007 by R.N. Gibson, R.J.A. Atkinson and J.D.M. Gordon
CLIMATE CHANGE AND AUSTRALIAN MARINE LIFE
419
the oceans, and this large variability is supported by reconstructed sea-level estimates from the past
decade (Willis et al. 2003). Therefore, over this century the local impact of sea-level rise may
substantially deviate from the global averaged value. For the Australian region, much greater sea-
level rise is projected on the east coast than the west coast due to the increased southward penetration
of the warm EAC, which causes water here to expand more than in other regions.
Climate impacts on Australian marine life
In this section we describe the impacts of climate variables on marine life in coastal, pelagic and
offshore benthic systems. We consider the climate variables that have greatest impact on structuring
marine communities within these systems and for which projections over the next 100 yr are
available from global climate models. Where applicable, we review impacts on physiology, distri-
butions and abundance, and phenology of marine organisms. Studies of climate impacts from both
field and experimental research from Australia are discussed and supplemented with studies and
observations from international research. Results of this section are summarised in Table 1.
Ocean temperature
Elevated water temperatures stress plants and animals already near the upper limits of their optimal
temperature range, slowing growth and impairing reproductive capacity (Philippart et al. 2003,
Roessig et al. 2004, Helmuth et al. 2005, Keser et al. 2005). This is because most biological
processes have an optimal temperature range and outside this range physiological efficiency
declines.
Coastal systems
Physiology Extreme temperatures, both warm and cool, if severe or prolonged can lead to irrep-
arable damage and death of coastal organisms as well as photosynthetic inhibition in marine plants
(Bruhn & Gerard 1996, Ralph 1998, Davenport & Davenport 2005, Campbell et al. 2006). Large
diebacks of marine fauna and flora in the intertidal and shallow subtidal occur on very hot days
particularly when these coincide with low tides during the middle of the day (Tsuchiya 1983, Perez
et al. 2000). Such a situation may have been responsible for the major dieback of seagrass beds in
southern Australia during early 1993 when over 12,000 hectares were lost (Seddon et al. 2000).
Probably the most widely publicised mass mortalities induced by warmer-than-average tem-
peratures are those resulting from tropical coral reef bleaching events (Hoegh-Guldberg 1999).
During bleaching events, the symbiosis between the coral and the unicellular algae (dineflagellates
from the genus Symbiodium) that live within the coral tissues disintegrates. Bleached corals may
recover their symbiotic populations of Symbiodium in the weeks and months after a bleaching event
if the conditions triggering the event are mild and short-lived, but mortality has reached 100% in
bleached corals when stressful conditions have persisted for days to weeks. Recent warming
throughout tropical oceans has led to repeated coral bleaching events, not seen anywhere in the
world before 1979, affecting hundreds to thousands of square kilometres of coral reefs in almost
every region of the world where coral reefs occur. In the most severe global episode of mass coral
bleaching (1998), 16% of corals that were surveyed before that event had died by the end of the
year (Hoegh-Guldberg 1999, Knowlton 2001).
Mass bleaching events over large sections of the Great Barrier Reef have occurred six times
during the past 30 years: in 1983, 1987, 1991, 1998, 2002 and 2006. Mortality rates in this region
were relatively low however, primarily because warming on the Great Barrier Reef was less severe
than in other parts of Australia and the world. For example, in 1998 a very warm pool of water sat
© 2007 by R.N. Gibson, R.J.A. Atkinson and J.D.M. Gordon
E.S. POLOCZANSKA ET AL.
420
Table 1 Expected and observed impacts of climate change on Australian marine life and field
or experimental evidence from outside Australia
Expected change
in climate
Species group/
natural system
Expected climate impact
in Australia
Observations
in Australia
Observations
elsewhere or
experimental
evidence
Increasing
temperature
Seagrasses
and
mangroves
Poleward shift in species ranges
and a shift in abundance toward
species tolerant of warmer
waters
Seagrass
distributional limits
linked to
temperature
1
Earlier flowering and fruiting Flowering of
seagrasses in
temperate Australia
linked to water
temperature
2
Seagrass Increased frequency and
intensity of large-scale
diebacks with increase in
frequency and intensity of
extreme temperatures
Southern Australia
early 1993
(>12,000 hectares)
3
Rocky shore,
fauna and
macroalgae
Poleward shift in species ranges
and a shift in abundance toward
species tolerant of warmer
waters
Rocky shores in
Europe, United
States and South
America over past
50 yr
4
Increased frequency and
intensity of large-scale
diebacks with increase in
frequency and intensity of
extreme temperatures
Diebacks in Tasmania
and South
Australian hot days
5
European and
Japanese coasts
6
Kelp
communities
Contraction of kelp ranges,
declines in abundance, local
extinctions, particularly in
Tasmania
Decline of kelp in
Tasmanian waters
over past 50 yr
7
Loss of kelp in east
Pacific following
El Niño
8
Phytoplankton Poleward shift in species ranges
and a shift in abundance toward
warm-water species
Southward extension
of a coccolithophore
and a dinoflagellate
in southeast
Australia
9
Poleward shift in
North Atlantic
10
A decline where warming
enhances stratification
North Atlantic
11
Earlier appearance of plankton
in summer in temperate waters
North Sea
12
Increase in frequency and
intensity of harmful and
nuisance blooms
Norwegian coast
13
Zooplankton Poleward shift in species ranges
and a shift in abundance toward
warm-water species
Large poleward
range shifts
(>1000 km) in
North Atlantic
14
A decline where warming
enhances stratification
North Atlantic
15
© 2007 by R.N. Gibson, R.J.A. Atkinson and J.D.M. Gordon
CLIMATE CHANGE AND AUSTRALIAN MARINE LIFE
421
Table 1 (continued) Expected and observed impacts of climate change on Australian marine
life and field or experimental evidence from outside Australia
Expected change
in climate
Species group/
natural system
Expected climate impact
in Australia
Observations
in Australia
Observations
elsewhere or
experimental
evidence
Earlier appearance of
zooplankton in summer in
temperate waters
North Sea
16
Coral reefs Increase in frequency and
severity of coral bleaching and
mortality
Six severe bleaching
events in past 30 yr
(Great Barrier Reef,
Ningaloo Reef)
17
Coral reefs
globally
18
Increase in local extinctions of
coral-associated fauna with
bleaching events
Coral reefs
globally
19
Demersal and
pelagic fish
Poleward shift in species ranges
and a shift in abundance toward
species tolerant of warmer
waters
Tasmanian fish
distributions
shifting south with
increase in fish that
prefer warmer
waters
20
North Atlantic fish
shifting
northward
21
Earlier dates of mean migration
and spawning in temperate and
subtropical species
Earlier migrations
in northeast
Atlantic fish
22
Seabirds and
wetland birds
Poleward shifts in species
ranges and a shift in abundance
toward species tolerant of
warmer waters
Southward shift of
seabird distributions
in Western Australia
and increase in
abundance
23
Earlier arrival in migratory
species in temperate and
subtropical regions
Southern Australian
wetland birds
24
Terrestrial, wetland
and seabirds
globally
25
Earlier nesting and laying and
protracted breeding seasons in
temperate and subtropical
species
Western and southern
Australian
seabirds
26
Marine turtles
and
mammals
Poleward shift in species
foraging ranges
Northward shift of
cetaceans and
turtles in northeast
Atlantic
27
Earlier breeding Earlier nesting in
marine turtles in
United States
28
Skewing of turtle sex ratios
toward females
Experimental and
modelling
evidence that
warmer
temperatures
produce more
females
29
(continued on next page)
© 2007 by R.N. Gibson, R.J.A. Atkinson and J.D.M. Gordon
E.S. POLOCZANSKA ET AL.
422
Table 1 (continued) Expected and observed impacts of climate change on Australian marine
life and field or experimental evidence from outside Australia
Expected change
in climate
Species group/
natural system
Expected climate impact
in Australia
Observations
in Australia
Observations
elsewhere or
experimental
evidence
Alteration of
winds
Phyto- and
zooplankton
Increased productivity where
wind mixing is enhanced and a
reduction where wind strength
declines
Production pulses
correlated with
peaks in wind
oscillation in
Tasmanian shelf
waters
30
Decreased
production in
central North
Pacific during
low-wind
regimes
31
Coastal fish Recruitment strength linked to
wind strength
Rocky reef fish
32
Seabirds Reduction of breeding success
with prolonged periods of
strong winds
Breeding colonies on
Great Barrier Reef
33
Alteration of
currents
including
strengthening
of EAC
Seagrasses &
mangroves
Local extinctions of cold-water
species in southeastern
Australia with increased flow
of EAC, appearance of tropical
species further south on east
coast
Seagrass
distributional limits
further south on
west coast than east
coast due to
influence of warm-
water Leeuwin
Current
34
Rocky shore,
fauna and
macroalgae
Local extinctions of cold-water
species in southeastern
Australia with increased flow
of EAC, appearance of tropical
species further south on east
coast
Tropical species
already found at
temperate latitudes
on east coast
35
Kelp
communities
Local extinctions of cold-water
species in southeastern
Australia with increased flow
of EAC, appearance of tropical
species further south on east
coast
Expansion of long-
spined urchin to
Tasmania facilitated
by larval transport
by EAC
36
Phyto- and
zooplankton
Poleward extension of warm
currents will transport tropical
plankton more southward
High abundance of a
tropical
coccolithophore off
southeast Australia
37
Decline in
mixed-layer
depth/increasing
stratification
Phyto- and
zooplankton
Decrease in abundance Phytoplankton
productivity in
central North
Pacific declines as
mixed-layer depth
decreases
38
Increased CO
2
and
decrease in pH
and aragonite
saturation state
Mangroves Increase in productivity with
rising atmospheric CO
2
Experimental
evidence
39
© 2007 by R.N. Gibson, R.J.A. Atkinson and J.D.M. Gordon
CLIMATE CHANGE AND AUSTRALIAN MARINE LIFE
423
Table 1 (continued) Expected and observed impacts of climate change on Australian marine
life and field or experimental evidence from outside Australia
Expected change
in climate
Species group/
natural system
Expected climate impact
in Australia
Observations
in Australia
Observations
elsewhere or
experimental
evidence
Seagrasses Increase in productivity with
increase dissolved CO
2
and
deepening of depth limits
Experimental
evidence
40
Rocky shore,
fauna and
macroalgae
Impaired growth in calcifying
fauna and macroalgae and
increase in mortality of early
life stages
Experimental
evidence
41
Phytoplankton Changes in growth and
community composition; long-
term decline in abundance and
distribution of calcifying
species
Experimental
evidence
42
Zooplankton Impaired growth in calcifying
species, particularly pteropods;
midterm decline in abundance
and distribution
Experimental
evidence
43
Coral reefs Impaired growth rates and
possible dissolution
Experimental and
modelling
evidence
44
Cold-water
corals
High threat of impaired growth
rates and possible dissolution
Evidence from
modelling work
45
Possible increase
in UV
Seagrasses Reduction of growth rates and
biomass in UV-sensitive
species
Experimental
evidence
46
Mangroves Reduction of growth rates and
biomass in UV-sensitive
species
Experimental
evidence
47
Rocky shore
fauna and
macroalgae
Increase mortality of early life
stages and reduction of growth
rates in UV-sensitive species
Experimental
evidence
48
Kelp and
subtidal
macroalgae
Increase mortality of early life
stages
Experimental
evidence
49
Phytoplankton Reduction of growth rates and
biomass in UV-sensitive
species and of nutritional value
to zooplankton
Changes in community
composition
Evidence from field
and laboratory
experiments
50
Zooplankton Increased mortality of early life
stages and reduction of growth
rates in UV-sensitive species
Evidence from
laboratory
experiments
51
Coral reefs Increase in mortality during
bleaching events through syn-
ergistic effects with temperature
Evidence from
laboratory
experiments
52
(continued on next page)
© 2007 by R.N. Gibson, R.J.A. Atkinson and J.D.M. Gordon
E.S. POLOCZANSKA ET AL.
424
Table 1 (continued) Expected and observed impacts of climate change on Australian marine
life and field or experimental evidence from outside Australia
Expected change
in climate
Species group/
natural system
Expected climate impact
in Australia
Observations
in Australia
Observations
elsewhere or
experimental
evidence
Increase mortality of early life
stages and reduction of growth
rates
Evidence from
laboratory
experiments
53
Demersal and
pelagic fish
Damage to epidermis and ocular
components in pelagic species
and increased mortality in egg
and larval stages in shallow
water and upper ocean
Evidence from
laboratory
experiments
54
Increase in
frequency or
intensity of
severe storms
and extreme
rainfall events
and a decrease in
average rainfall
Mangroves Shifts in community abundance
as coastal salinity regimes are
altered and nutrient and
sediment loading changes
Increase in mangrove
area in southeast
Australia may be
indirectly linked to
changes in rainfall
although changes in
land use likely to be
overriding factor
55
Seagrasses Destruction of seagrass beds Loss of >1000 km
2
in
Harvey Bay after
severe storms and
flooding
56
Large-scale
destruction in
United States after
cyclones
57
Kelp
communities
and subtidal
macroalgae
Shifts in community abundance
and increased local mass
mortality events associated
with storms and flood events
Switch from canopy-
forming macroalgae
to turf-forming algae
in South Australia
linked to enhanced
nutrient supply from
coastal runoff
58
Range shifts of
macroalgae in
New Zealand and
California
associated with
storms and wave
exposure
59
Benthic
macrofauna
Shifts in community abundance
and increased local mass
mortality events associated
with storms and flood events
Mass mortality of
grazing urchins after
freshwater pulse
60
Field experiments
revealed shift in
community
composition with
increased
sedimentation
61
Alteration of peak timing of life
cycle events
High rainfall may
decrease salinity in
estuaries so
triggering prawn
emigration in
northern Australia
62
High rainfall may
decrease salinity
in estuaries so
triggering prawn
emigration in the
United States
63
Coral reefs Mass mortality events
associated with storms and
flood events
Mass mortality of
corals on Great
Barrier Reef after
cyclones and flood
events
64
Mass mortality of
corals in
Caribbean after
cyclones
65
© 2007 by R.N. Gibson, R.J.A. Atkinson and J.D.M. Gordon
CLIMATE CHANGE AND AUSTRALIAN MARINE LIFE
425
Table 1 (continued) Expected and observed impacts of climate change on Australian marine
life and field or experimental evidence from outside Australia
Expected change
in climate
Species group/
natural system
Expected climate impact
in Australia
Observations
in Australia
Observations
elsewhere or
experimental
evidence
Community structure influenced
by rainfall regime and runoff
Lower coral diversity
on Great Barrier
Reef in wet tropics
66
Phytoplankton Diatoms may decline with
decreasing average runoff and
nutrient input while dino-
flagellates (including harmful
algae) may profit from storm-
associated runoff and humic
substances in coastal waters
Evidence from field
experiment and
time series
67
Marine turtles
and
mammals
Increased mortality events High mortalities of
turtles and seal pups
associated with
cyclones and
storms
68
Rise in sea level Mangroves Alteration of hydrological or
tidal regimes leads to mortality
of mangroves
Mangroves in
Africa and Asia
69
Mangrove retreat with rising sea
level
Caribbean
70
Seagrass Reduction in growth of seagrass
and distributional shifts
50 cm rise in sea
level expected to
result in 30–40%
reduction of
seagrass growth
71
Seabirds Loss of breeding sites for
species that nest on low-lying
coastal areas through increased
flooding and erosion
Evidence from
modelling work
72
Marine turtles
and
mammals
Loss of breeding and haul-out
sites for species through
increased flooding and erosion
50 cm rise in sea
level expected to
lead to a 32% loss
of turtle nesting
beaches in the
Caribbean
73
Notes:
1
Walker & Prince 1987;
2
West & Larkum 1979, Cambridge & Hocking 1997, Inglis & Smith 1998;
3
Seddon et al.
2000;
4
Barry et al. 1995, Southward et al. 1995, Sagarin et al. 1999, Zacherl et al. 2003, Mieszkowska et al. 2005, Rivadeneira
& Fernandez 2005, Simkanin et al. 2005, Smith et al. 2006;
5
Valentine & Johnson 2004, Womersley & Edwards 1958;
6
Tsuchiya 1983, Perez et al. 2000;
7
Edyvane 2003, Edgar et al. 2005;
8
Dayton & Tegner 1984, Zimmerman & Robertson 1985,
Dayton et al. 1998, 1999, Adey & Steneck 2001;
9
Blackburn & Creswell 1993, Blackburn 2005, G. Hallegraef pers. com.;
10
M. Edwards 2005;
11
Richardson & Schoeman 2004;
12
Edwards & Richardson 2004;
13
Edwards et al. 2006;
14
Beaugrand
et al. 2002, Bonnet et al. 2005;
15
Richardson & Schoeman 2004;
16
Greve et al. 2004, Edwards & Richardson 2004, Kirby
et al. 2007;
17
Hoegh-Guldberg 1999, Wilkinson 2004;
18
Hoegh-Guldberg 1999, Knowlton 2001;
19
Dulvy et al. 2003;
20
Welsford & Lyle 2003, P. Last pers. com.;
21
Beare et al. 2004, Byrkjedal et al. 2004, Perry et al. 2005, (continued on next page)
© 2007 by R.N. Gibson, R.J.A. Atkinson and J.D.M. Gordon
E.S. POLOCZANSKA ET AL.
426
above Scott Reef off northwest Australia for several months, resulting in an almost total bleaching
of these offshore reefs and mortality of corals down to 30 m depth. The recovery of Scott Reef
has been very slow (Wilkinson 2004).
By the middle of this century, temperature thresholds for coral bleaching will be exceeded
every year in Australia if sea temperatures increase as projected by global climate models (Hoegh-
Guldberg 1999). Based on the current responses of corals, it is estimated that an increase of 2°C
in tropical and subtropical Australia would result in annual bleaching and quite possibly regular,
large-scale mortalities (Hoegh-Guldberg 1999, 2004, Lough 2000). A geographic analysis of risk
to the Great Barrier Reef associated with these changes in sea temperature indicated that the
projected succession of devastating mass coral bleaching events will severely compromise the
ability of reefs to recover, no matter where they are found along the Queensland coastline (Done
et al. 2003). This analysis indicated that deterioration of coral populations is likely in most of the
scenarios examined and this is reinforced by findings from other studies (Hoegh-Guldberg 1999,
Donner et al. 2005).
For large, mobile animals that may be transient visitors to coastal waters, oceanic warming
may impact particular life stages such as juveniles or embryos. For example, gender in all turtles
is determined by ambient nest temperatures during embryonic development (Mrosovsky et al. 1992,
Godfrey et al. 1999, Hewavisenthi & Parmenter 2002a). Small changes in temperature close to the
pivotal temperature at which a 50:50 sex ratio is produced (~29°C for marine turtles) skew the sex
ratio of hatchlings, with warmer temperatures producing more females (Yntema & Mrosovsky
1982, Godfrey et al. 1999, Booth & Astill 2001, Glen & Mrosovsky 2004). Many nesting beaches
around the world, including most Australian beaches, already have a strong female bias (Limpus
Table 1 (continued) Expected and observed impacts of climate change on Australian marine
life and field or experimental evidence from outside Australia
Notes (continued): Rose 2005a, 2005b;
22
Sims et al. 2001;
23
Dunlop & Wooller 1986, Dunlop et al. 2001, Bancroft et al.
2004;
24
Beaumont et al. 2006;
25
Mason 1995, Crick et al. 1997, Archaux 2003, Both et al. 2004, Lehikoinen et al. 2004,
Both et al. 2005, Marra et al. 2005, Jonzén et al. 2006, Moller et al. 2006;
26
Dunlop & Wooller 1986, Chambers 2004;
27
Robinson et al. 2005, MacLeod et al. 2005, McMahon & Hays 2006;
28
Weishampel et al. 2004;
29
Yntema & Mrosovsky
1982, Godfrey et al. 1999, Booth & Astill 2001, Glen & Mrosovsky 2004;
30
Harris et al. 1991;
31
Polovina et al. 1994;
32
Thresher et al. 1989;
33
King et al. 1992;
34
Walker & Prince 1987;
35
Griffiths 2003;
36
Johnson et al. 2005;
37
Blackburn &
Cresswell 1993, Blackburn 2005;
38
Venrick et al. 1987, Polovina et al. 1994, 1995;
39
Polovina et al. 1995, Roemmich &
McGowan 1995, Farnsworth et al. 1996, Ainsworth & Long 2005;
40
Invers et al. 1997, 2002, Zimmerman et al. 1997;
41
Gao et al. 1993, Kurihara et al. 2004, Michaelidis et al. 2005, Berge et al. 2006;
42
Riebesell et al. 2000, Antia et al. 2001,
Tortell et al. 2002, Engel et al. 2005;
43
Orr et al. 2005;
44
See Hoegh-Guldberg 2004;
45
Guinotte et al. 2006, Raven et al.
2005;
46
Dawson & Dennison 1996;
47
Moorthy & Kathiresan 1997, 1998;
48
Graham 1996, Rijstenbil et al. 2000, Cordi
et al. 2001, Lesser et al. 2003, Przeslawski et al. 2004, 2005, Bonaventura et al. 2006;
49
Graham 1996, Bischof et al. 1998,
Swanson & Druehl 2000, Wiencke et al. 2006;
50
Behrenfeld et al. 1993, Keller et al. 1997, Wilhelm et al. 1997, Wängberg
et al. 1999, Garde & Cailliau 2000, Barbieri et al. 2002, Litchman & Neale 2005;
51
Karanas et al. 1979, Damkaer & Dey
1983;
52
Lesser 1996, 1997, Baruch et al. 2005, Drohan et al. 2005;
53
Shick et al. 1996, Wellington & Fitt 2003;
54
Hunter
et al. 1982, Keller et al. 1997, Zagarese & Williamson 2001, Markkula et al. 2005;
55
Saintilan & Williams 1999, Harty
2004, Rogers et al. 2006;
56
Preen et al. 1995;
57
Thomas et al. 1961;
58
Gorgula & Connell 2004;
59
Graham 1997, Cole et al.
2001;
60
Andrew 1991;
61
Norkko et al. 2002, Thrush et al. 2003a, 2003b,
Lohrer et al. 2004;
62
Staples 1980, Vance et al.
1985, Staples & Vance 1986, Vance et al. 1998;
63
Zein-Eldin & Renaud 1986;
64
Alongi & Robertson 1995, Alongi &
MacKinnon 2005;
65
Porter & Meier 1992, Gardner et al. 2005;
66
De Vantier et al. 2006;
67
Carlsson et al. 1995, Goffart
et al. 2002;
68
Limpus & Reed 1985, Pemberton & Gale 2004;
69
Blasco et al. 1996;
70
Ellison 1993, Parkinson et al. 1994;
71
Short & Neckles 1999;
72
Galbraith et al. 2002, Smart & Gill 2003;
73
Fish et al. 2005.
© 2007 by R.N. Gibson, R.J.A. Atkinson and J.D.M. Gordon
CLIMATE CHANGE AND AUSTRALIAN MARINE LIFE
427
1992, Loop et al. 1995, Godfrey et al. 1996, Binckley et al. 1998, Hewavisenthi & Parmenter 2002b,
Hays et al. 2003, Glen & Mrosovsky 2004) so if temperatures rise, the proportion of eggs developing
as males may be further reduced. However, light-coloured (thus cooler) beaches within nesting
regions produce more males (Hays et al. 2003). In Queensland beaches on offshore coral cays and
islands have lighter-coloured sand than mainland beaches, thus maintaining sex ratios (Environment
Australia 1998). Therefore if temperatures warm on these beaches, the gross skewing in sex bias
may have serious implications for local breeding population persistence.
On a global scale outbreaks of disease have increased over the last three decades in many
marine groups including corals, echinoderms, mammals, molluscs and turtles (Ward & Lafferty
2004). Causes for increases in diseases of many groups remain uncertain, although temperature is
one factor that has been implicated in corals, molluscs and turtles (Harvell et al. 2002). Previously
unseen diseases have also emerged in new areas through shifts in distribution of hosts or pathogens,
many of these shifts are in response to climate change (Harvell et al. 1999). A consequence of
climate-mediated physiological stress is that host resistance to pathogens or parasites can be
compromised (Scheibling & Hennigar 1997, Garrabou et al. 2001, Lee et al. 2001, Harvell et al.
2002, Mouritsen et al. 2005). Temperature-induced disease outbreaks in corals on the Great Barrier
Reef have occurred at the same time as bleaching events, resulting in increased coral mortality
rates (Jones et al. 2004). A large-scale mortality of greenlip abalone, Haliotis laevigata, along the
south Australian coast in 1985 and 1986 due to infection by Perkinsus parasites may have been
aggravated by warmer water temperatures predisposing the abalone to this disease (Goggin & Lester
1995). Population declines due to temperature-related disease susceptibility have also been reported
in several Californian abalone species through both observational and experimental studies (Davis
et al. 1996, Vilchis et al. 2005).
Fibropapillomatosis, a disease that causes tumours, is now common in green turtles Chelonia
mydas and olive ridley turtles Lepidochelys olivacea (Adnyana et al. 1997, Jones 2004). This disease
was first documented in the 1930s and was rare until the early 1980s but has since reached epidemic
proportions in many turtle populations worldwide (Jones 2004). The prevalence of the tumours in
young turtles suggests prolonged exposure to anthropogenic pollutants may be responsible
(Adnyana et al. 1997, Herbst et al. 2004, Jones 2004, Ene et al. 2005, Foley et al. 2005). However,
the increase of this disease in recent decades coincides with rapidly rising temperatures so it may
also be indirectly related to climate change (Robinson et al. 2005).
Distribution and abundance Temperature influences the abundance and distribution of coastal
marine life such as macroalgae, seagrasses and molluscs (McMillan 1984, Walker & Prince 1987,
Jernakoff et al. 1996, Steneck et al. 2002, Hiscock et al. 2004). Fluctuations in species abundances
and community composition have been linked to variations in temperature (Southward et al. 1995,
Tegner et al. 1996, Dayton et al. 1999, Grove et al. 2002, M.S. Edwards 2004, Schiel et al. 2004,
Smith et al. 2006). Shifts in species distributions associated with ocean warming are documented
from rocky shores in Europe, the United States and South America (Barry et al. 1995, Sagarin et al.
1999, Zacherl et al. 2003, Mieszkowska et al. 2005, Rivadeneira & Fernandez 2005, Simkanin et al.
2005). For example, a recent comprehensive resurvey of rocky intertidal shores around the United
Kingdom found range extensions in the northern (high-latitude) limits of some warm-water species
over the past 50 yr and a retraction in the southern limits of fewer cold-water species although
rates of recession were not as fast as rates of advancement in warm-water species (Mieszkowska
et al. 2005). The high levels of endemism along Australia’s southern coastline could increase
vulnerability to temperature increases compared to temperate rocky shores elsewhere; many
endemic species may have more stringent temperature limits and so may be particularly susceptible
to warming (Beardall et al. 1998).
© 2007 by R.N. Gibson, R.J.A. Atkinson and J.D.M. Gordon
E.S. POLOCZANSKA ET AL.
428
There are interactive effects between the impacts of warming and availability of nutrients on
distribution and abundance of macroalgae. Declines of giant kelp forest communities in Tasmanian
coastal waters have been associated with thermal and nutrient stress (Edyvane 2003, Edgar et al.
2005). Macrocystis kelp forests in Australia are found predominantly in the southeast where water
conditions are cool and relatively nutrient rich. There has been a considerable decline in Tasmanian
kelp forests over the past 50 yr associated with rising temperatures (Edyvane 2003). Further, an
unusual dieback of the shallow sublittoral brown macroalga Phyllospora comosa along the east
coast of Tasmania in 2001 has also been attributed to above-average seawater temperatures coupled
with nutrient stress (Valentine & Johnson 2004). If the EAC strengthens as projected by climate
models, warm, nutrient-poor water will impinge more frequently on Tasmanian giant kelp commu-
nities, potentially leading to local extinction and a shift of macroalgal communities to understorey-
dominated forms (Kennelly 1987a,b, Dayton et al. 1999).
Globally, mangrove distribution is generally constrained by the 20°C winter sea isotherm; there
are a few exceptions, such as the more southerly distribution of mangroves in eastern Australia
(Duke 1992). It has been suggested that this distribution is the result of small-scale extensions of
warmer currents, such as the EAC, or that the southern populations are a relict representing refuges
of more poleward distributions in the past (Duke 1992). As mangrove species show considerable
variation in their sensitivity to temperature, species composition of mangrove forests will alter as
temperatures rise and species distributions are expected to shift poleward (Field 1995).
Evidence suggests that some benthic and demersal fish species may be able to move as oceans
warm, regardless of whether there is a shift in associated habitats such as coral reefs, kelp forests
or rocky reef communities. Certain fishes associated with coral reefs appear to be able to populate
reefs that do not have corals, as shown by the appearance of coral reef fishes in southern New
South Wales and Victoria during the summer (Hoegh-Guldberg 2004). These fishes recruit into
coastal areas and grow for several months, disappearing when cold conditions return. Many coral
reef fish may be able to move southward as oceans warm, although obligate corallivorous species
would presumably be missing (Hoegh-Guldberg 2004). This has already been observed in other
parts of the world such as California, where the composition of near-shore rocky reef fish commu-
nities shifted in dominance from cold-water northern species to warm-water southern species as
temperatures warmed (Holbrook et al. 1997). However, coral bleaching has already led to local
extinctions of a few coral-associated fish (Dulvy et al. 2003) and doubtless many more could
disappear as coral bleaching episodes increase.
Other mobile groups such as seabirds and marine mammals may be able to rapidly shift their
distributions with climate change, although many are restricted to coastal habitats during breeding
seasons. Warmer waters may allow marine turtles and dugongs to extend their foraging distributions
in Australian inshore waters further south. However, green turtles Chelonia mydas and dugongs
Dugong dugon selectively feed on seagrasses while hawksbill turtles Eretmochelys imbricata forage
on coral reefs, so their ability to shift distributions are likely to be limited by changes in the
distribution of their food sources.
Range expansions have already been observed in seabird species along the west coast of
Australia, with tropical species extending their breeding and foraging ranges southward (Dunlop &
Wooller 1986, Dunlop et al. 2001). The recent growth of nesting colonies of wedge-tailed shear-
waters Puffinus pacificus in southwestern Australia may be due to a southerly movement from more
northerly colonies as temperatures rise (Bancroft et al. 2004). Wedge-tailed shearwaters are found
only over waters with surface temperatures exceeding 20°C (Surman & Wooller 2000). The pop-
ulation of Australasian gannets Morus serrator that breed in southeast Australia has increased by
approximately 6% per year since 1980, with new breeding sites being established as nesting space
becomes limited (Bunce et al. 2002). This increase appears to be associated with a long-term
© 2007 by R.N. Gibson, R.J.A. Atkinson and J.D.M. Gordon
CLIMATE CHANGE AND AUSTRALIAN MARINE LIFE
429
warming trend and a concurrent increase in the abundance of small pelagic prey fish, principally
pilchards Sardinops sagax.
Phenology Water temperature and day length are the principal triggers or correlates for the timing
of biological events such as breeding or migration in marine animals and flowering and seed
germination in marine plants (Parmesan & Yohe 2003). Synchrony in reproduction of widely
distributed seagrass beds and mangroves (Clarke & Myerscough 1991, Inglis & Smith 1998, Diaz-
Almela et al. 2006) suggests control by these environmental variables. Such synchronies of bio-
logical events in distant populations may be regulated by a large-scale independent factor such as
temperature or day length. Regular flowering of the seagrass Posidonia australis occurs between
April and June in southwestern Australia, probably induced by a seasonal decline in water temper-
atures (West & Larkum 1979, Cambridge & Hocking 1997). However, further north in Shark Bay
P. australis meadows do not flower every year (Larkum 1976). Widespread flowering P. australis
is also rare off central New South Wales on the east coast (Walker et al. 1988). Shark Bay and
central New South Wales are near the northern limits for this temperate seagrass species so the
threshold decline in water temperature required to trigger flowering may begin to occur less
frequently. As a warming of coastal waters is projected, particularly off southeast Australia, episodes
of flowering of P. australis may become even rarer in northern meadows. The deposition of seed
banks after flowering is an important process that allows seagrass beds to recover rapidly from
catastrophic disturbances such as storms or floods (Preen et al. 1995).
Temperature has also been correlated with the timing of mass spawning in tropical reef corals
on the Great Barrier Reef (Babcock et al. 1986) and on the tropical west coast (Simpson 1991).
However, the physiological and evolutionary mechanisms that underlie the timing of reproduction
in corals and in most marine invertebrates are far from clear; thus it is difficult to speculate on the
consequences of any change in the timing of spawning.
There is global evidence that climate change is influencing the phenology of larger marine
fauna. Marine turtles in Florida in the United States are nesting earlier in response to warmer ocean
temperatures (Weishampel et al. 2004). Warmer waters also reduce the interval length between the
multiple clutches laid within a nesting season (Sato et al. 1998, Hays et al. 2002). Not all adult
turtles will breed each year, but the relative numbers arriving annually at widely separated rookeries
in Australia and the Indo-Pacific are similar, suggesting large-scale environmental forcing on
reproductive success (Limpus & Nicholls 1988, Chaloupka 2001). Variation in winter sea-surface
temperature anomalies partly explains internesting intervals of a Costa Rican population of green
turtles Chelonia mydas, with 2-yr remigration probabilities increasing in warmer years (Solow et al.
2002). In Australia, interannual fluctuations in numbers of green turtles nesting at rookeries within
the Great Barrier Reef are positively correlated with the Southern Oscillation Index, also with a
2-yr lag (Limpus & Nicholls 1988). Modelling studies suggest breeding intervals (time between
nesting years) are determined by resource provisioning on adult feeding grounds and the 2-yr lag
represents the time required for physiological provisioning for reproduction and migration (Hays
2000, Rivalan et al. 2005). Green turtles are herbivorous so are likely to be tightly coupled to
productivity in coastal waters (Broderick et al. 2001).
Mean egg-laying dates of many terrestrial bird species around the world have advanced con-
siderably in response to increasing temperatures (Archaux 2003, Both et al. 2004, 2005, Moller
et al. 2006). Migratory species are arriving earlier and leaving later (Mason 1995, Crick et al. 1997,
Lehikoinen et al. 2004, Marra et al. 2005, Jonzén et al. 2006). Most evidence is from the Northern
Hemisphere, but a similar pattern has recently been found in Australian migratory wetland birds
such as the curlew sandpiper Calidris ferruginea and the double-banded plover Charadrius bicinctus
(Beaumont et al. 2006). It is assumed that such changes are also occurring in Australian seabirds.
Protracted breeding seasons observed in seabird species in Western Australia are likely to be a
© 2007 by R.N. Gibson, R.J.A. Atkinson and J.D.M. Gordon
E.S. POLOCZANSKA ET AL.
430
response to changing climate (Dunlop & Wooller 1986, Chambers et al. 2005). Breeding success
of little penguins Eudyptula minor in Bass Strait is correlated with sea temperatures and mean
laying dates are earlier in warmer years (Chambers 2004).
Pelagic systems
Physiology All plankton are poikilothermic and thus physiological rate processes and rates of
overall growth are highly sensitive to temperature (Eppley 1972, Peters 1983, Huntley & Lopez
1992), with many plankton having a Q
10
between 2 and 3 (i.e., a doubling to tripling in the speed
of rate processes for a 10°C temperature rise). Species have a thermal optimum where growth is
maximal and thermal limits beyond which net growth ceases or becomes negative. Basal metabolic
losses increase with increasing temperature so that zooplankton fitness and, subsequently, abun-
dance and distribution may be adversely affected. Little information is available on temperature
ranges for Australian plankton, and in most cases experiments have been carried out with temperate
plankton strains. Culture studies do give some indication (e.g., Smayda 1976) and suggest that
species with tropical and subtropical distributions have growth optima <30°C. Optimal growth for
the dominant picophytoplankton species Synechococcus and Prochlorococcus in the Great Barrier
Reef is in the range 20–30°C (Furnas & Crosbie 1999), and in the Atlantic Ocean growth of
Synechococcus peaks at 28°C and growth of Prochlorococcus at a cooler temperature of 24°C
(Moore et al. 1995). As individual plankton strains have their own thermal optimum and limits for
growth, warming will have differential effects on the growth of individual species and changes in
phytoplankton and zooplankton community composition.
Although direct effects of temperature changes are fundamentally important to plankton rate
processes, indirect effects are also critical to plankton growth rates because zooplankton grow at
temperature-dependent maximal rates only when they are food saturated (Kleppel et al. 1996,
Hirst & Lampitt 1998, Richardson & Verheye 1998). Available evidence from tropical Australia
indicates that copepod growth and egg production rates are regulated primarily by food availability
rather than temperature (McKinnon & Thorrold 1993, McKinnon 1996, McKinnon & Ayukai 1996,
McKinnon et al. 2005). For example, generation times of the common coastal tropical copepod
Acrocalanus gibber decreased by 25% with a 5°C rise in temperature because of food limitation
(McKinnon 1996). Therefore, zooplankton growth rates appear to be severely food limited in the
warm, oligotrophic waters of tropical Australia (McKinnon & Duggan 2001, 2003). Climate impacts
on nutrient enrichment processes are thus likely to be at least as important in Australia as local
and direct temperature effects.
Temperature also has an effect on the body size of individual species of zooplankton. Copepod
body length typically decreases with increasing temperature (McKinnon 1996). Effects of temper-
ature on upper trophic levels may be strongly mediated by zooplankton size, which is a key
determinant of food quality for planktivorous fish. Warming of ocean waters will impact the
physiology or morphology of demersal and pelagic fish populations directly and indirectly, but too
little is known to speculate how these might be driven by climate change. Warming temperatures
will affect all life stages of these fish but egg and larval stages may be the most sensitive.
Distribution and abundance Plankton respond rapidly to ocean warming and have exhibited some
of the largest range shifts of any marine group (Hays et al. 2005). Members of the warm temperate
copepod communities in the northeast Atlantic have moved more than 1000 km poleward over the
last 50 yr (Beaugrand et al. 2002, Bonnet et al. 2005), although this may be more associated with
changing currents than warming. Concurrently, cooler water copepod assemblages have retracted
further toward the North Pole. It is likely that similar expansions have also occurred in warm
© 2007 by R.N. Gibson, R.J.A. Atkinson and J.D.M. Gordon
CLIMATE CHANGE AND AUSTRALIAN MARINE LIFE
431
temperate and tropical dinoflagellates in the North Atlantic (M. Edwards 2004). Unfortunately,
plankton observations are rare in Australian waters. The only examples of plankton range extensions
are for the coccolithophorid Gephyrocapsa oceanica and the dinoflagellate Noctiluca scintillans.
Since the early 1990s this species has begun to appear in high densities off southeastern Australia,
with the likely cause being warmer sea temperatures (Blackburn & Cresswell 1993, Blackburn
2005, G. Hallegraef personal communication). Range expansions of other plankton species may
have considerable social and economic consequences. The box jellyfish Chironex fleckerii is cur-
rently at the southern limit of its range on North Queensland beaches where it causes problems for
bathers during summer; it may also expand its range further south as waters warm.
It is well recognised that sea temperature is a principal determinant of fish species abundance
and distribution (Lehodey et al. 1997, Roessig et al. 2004, Perry et al. 2005), biomass (Ware 1995,
O’Brien et al. 2000, Drinkwater 2005), and other critical life-history and physiological processes
(Burkett et al. 2001). Poleward shifts in distribution over the last century have been documented
for fish in the North Atlantic and the North Sea (Beare et al. 2004, Byrkjedal et al. 2004, Perry
et al. 2005, Rose 2005a,b), but observations from Australian waters are again few. Changes in the
distribution of large pelagic fishes, such as tunas and billfish, have been observed in response to
climate variability both seasonally (Zagaglia & Stech 2004) and interannually in terms of El Niño
Southern Oscillation (ENSO) (Lehodey 2001) and Rossby waves (White et al. 2004). Seasonal
distributions may be impacted if the timing of expansion or contraction of currents, such as the
Leeuwin or EAC, alters. For example, southern bluefin tuna Thunnus maccoyii are restricted to the
cooler waters south of the EAC and range further north when the current contracts up the New
South Wales coast (Majkowski et al. 1981). This response to climate variation has allowed real-
time spatial management to be used to restrict catches of southern bluefin tuna by non-quota holders
in the east coast fishery by restricting access to ocean regions believed to contain southern bluefin
tuna habitat (Hobday & Hartmann 2006). The seasonal presence of these fish along the east coast
of Australia may be reduced further if Tasman Sea warming continues. Preliminary analyses indicate
that changes may have already occurred, with fewer fish moving to the east coast in the Austral
winter (Polacheck et al. 2006).
Species from intermediate trophic levels (such as sardines and anchovies) are also crucial to
maintenance of biodiversity in the pelagic realm. These are particularly sensitive to climate impacts
based on studies elsewhere in the world (Chavez et al. 2003). A rare example from Australia is the
replacement in eastern Tasmania of cold-water jack mackerel Trachurus declivis with warm-water
redbait Emmelichthys nitidus from the EAC (Welsford & Lyle 2003), consistent with a warming
trend on the east coast of Australia and Tasmania.
Most species of marine turtles (except flatback turtles) move between coastal habitats and open
oceans, being distributed in waters generally warmer than 15–20°C (Davenport 1997), although
leatherbacks and loggerheads do penetrate into colder waters. Large leatherbacks are reported from
waters as cool as 8°C but juvenile leatherbacks (<100 cm carapace length) are rarely found in
waters <26°C (Eckert 2002). Reports from the Northern Hemisphere indicate that turtle populations
may already be responding to warmer temperatures. Most sightings of marine turtles in U.K. waters
over the past century are from the last 40 yr and sightings are increasing, suggesting a poleward
shift or expansion in distributions but may also be a result of better reporting (Robinson et al. 2005,
McMahon & Hays 2006). Global ranges of marine mammals are often related to water temperature
(Learmonth et al. 2006). However, climate-induced changes in prey availability will strongly influ-
ence distributions of marine mammals. A recent increase of warm-water cetaceans recorded in the
northeast Atlantic is likely to be the result of northward expansions linked to shifts of lower trophic
levels in response to warming temperatures (MacLeod et al. 2005).
© 2007 by R.N. Gibson, R.J.A. Atkinson and J.D.M. Gordon