Pesticide Residues in Coastal Tropical Ecosystems: Distribution, fate and effects - Chapter 3 pps
Bạn đang xem bản rút gọn của tài liệu. Xem và tải ngay bản đầy đủ của tài liệu tại đây (2.02 MB, 28 trang )
Pesticide use in Zimbabwe 21Chapter 3
Pesticide use in Zimbabwe
Impact on Lake Kariba, a tropical
freshwater ecosystem
Mark F. Zaranyika
INTRODUCTION
Zimbabwe is situated within the African tropics (Lat. 15
°
to 22
°
S and Long. 26
°
to
34
°
E), occupies an area of 390,580 km
2
and has a population of about 11 M. The
Zambezi River forms the boundary with Zambia to the north, and the Limpopo
River forms the boundary with South Africa to the south. The eastern highlands
that form the rim of the African Plateau (before descent to the Mozambique Coastal
Plain), constitute the greater part of the border with Mozambique. In the west,
the boundary with Botswana follows the eastern limit of the Kalahari Desert.
Zimbabwe is a landlocked country. Its GDP for 1990 and 1994 was Z$14,643
M and Z$39,775 M, respectively. The agriculture sector contributes about 13
percent of GDP, while the export of agricultural products contributes 50 percent
of the country’s total annual export earnings (Central Statistical Office, 1990).
The use of pesticides plays a major role in maintaining these high levels of agri-
cultural production. As in most tropical countries in Africa, pesticides are also
extensively used in the public health arena to control diseases such as malaria (a
nonhemorrhagic fever caused by protozoans of the genus Plasmodium Marchiafava
and Celli and vectored by Anopheles Meigen spp. (Diptera: Culicidae) mosquitoes),
African trypanosomiasis (African sleeping sickness, a nonhemorrhagic fever caused
by protozoans of the genus Trypanosoma Gruby and vectored by tsetse flies, Glossina
spp. (Diptera: Glossinidae), and typhoid (a bacterial illness caused by Salmonella
typhi spread in contaminated food and water). Of late, there has been concern
about the possible effects the use of pesticides has on tropical environments,
including tropical marine and fresh water ecosystems. The effect of pesticides on
the environment depends on several factors such as climate, in particular tempera-
ture and rainfall; soil type and the nature of the vegetative cover; biotic activity;
light intensity; agricultural practices; and mode of introduction of the pesticide into
a particular environmental compartment. These factors determine the persistence
of a pesticide in a specific environment, and in this respect, OC pesticides as a
group have been found to be the most persistent.
OC pesticides have been used extensively since the early 1960s to control the
tsetse fly and malaria vectors in southern east-central Africa, i.e. Zimbabwe,
© 2003 Milton D. Taylor, Stephen J. Klaine, Fernando P. Carvalho, Damia Barcelo and Jan Everaarts
22 Mark F. Zaranyika
Mozambique, and South Africa (Ford, 1971). DDT has been used for this purpose
since 1962, while dieldrin was used during the period 1962 to 1967 (Ford, 1971;
Mpofu, 1987; Whitwell et al., 1974). Endosulfan and BHC are currently used,
especially for aerial spraying (Chapman, 1976).
DDT was used in Zimbabwe for more than four and a half decades, from 1946
to 1983 (Chikuni, 1996). In addition to its use to control the tsetse fly and malaria
vectors, DDT was used extensively for the control of agricultural pests such as the
maize stalkborer Busseola fusca Fuller (Lepidoptera: Noctuidae), cotton cutworm
Agrotis spp. (Lepidoptera: Noctuidae), and cotton bollworm Helicoverpa armigera
Habner (Lepidoptera: Noctuidae). DDT was used in agriculture until 1983 when
this use was banned. However, it is still registered with the Ministry of Health’s
Hazardous Substances Control Board as a ‘hazardous substance class 1’, i.e. a
chemical that can endanger humans and domestic and wild animals, and its
procurement and use are restricted to cover tsetse and mosquito control only
(Chikuni, 1996). Other OC pesticides registered for use in agriculture in Zimbabwe
include dieldrin, endosulfan, BHC, aldrin, chlordane, dicofol, and chlorthal-
dimethyl.
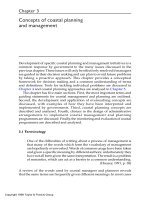
This chapter discusses the use of pesticides in Zimbabwe and how this has
impacted on Lake Kariba, a tropical freshwater ecosystem. Lake Kariba is one of
the world’s largest man-made lakes. It was constructed in the mid-1950s, started
to fill in 1958, and reached full capacity in 1963. Situated in south-central Africa
(between Lat. 16
°
30' to 18
°
S, and Long. 27
°
to 39
°
E), the lake is politically shared
by Zambia and Zimbabwe, with the international border bisecting the lake
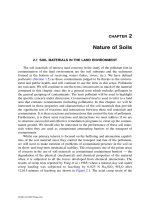
longitudinally (Figure 3.1). Its physical dimensions are given in Table 3.1.
Geographically Lake Kariba is part of the middle Zambezi region and lies in a
rift valley (the Gwembe Valley), overlooked on both sides by steep escarpments.
The mean maximum temperature is 30.4
°
C, while the minimum annual mean
temperature is 18.2
°
C. Rainfall around the lake region is generally low; the annual
mean for the period 1951 to 1986 was 734 mm (Leggett et al., 1991). Generally the
wet season occurs in the months of December to March, with occasional storms
Table 3.1 The physical dimensions of Lake Kariba, Zimbabwe at the
normal operating water level (see Figure 3.1)
a
Water level (above sea level) 485 m
Length 277 km
Mean breadth 19.4 km
Mean depth 29.18 m
Maximum depth
b
93 m
Surface area 5364 km
2
Volume 156.5 km
3
Theoretical renewal time of the water mass 3 years approx.
Notes:
a Source Balon and Coche (1974).
b Occasional deeper ‘holes’ not considered.
© 2003 Milton D. Taylor, Stephen J. Klaine, Fernando P. Carvalho, Damia Barcelo and Jan Everaarts
Pesticide use in Zimbabwe 23
in October, April, and May. There is no rainfall from June to September. Evidence
of a pesticide residue build-up in Lake Kariba has been reported by several workers
(Billings and Phelps, 1972; Whitwell et al., 1974; Greichus et al., 1978; Wessels et
al., 1980). Thus, in 1980, Wessels et al. were prompted to warn that ‘in view of the
extensive fishery development taking place on the lake, the problem of residues in
human food may become a serious matter’. The background and extent of the
problem are the subject of this chapter.
IMPORTATION, MANUFACTURE, AND
REGULATION OF PESTICIDES IN ZIMBABWE
The use of pesticides in agriculture:
importation and regulation of pesticides in
Zimbabwe
The use of pesticides in Zimbabwe is regulated in terms of the Pesticide Regulations
of 1977, under the Fertilizer, Farm Feeds and Remedies Act (Chapter 111) of
1952 (Government of Zimbabwe, 1952) and the Hazardous Substances and Articles
Act (Chapter 322) of 1972 (Government of Zimbabwe, 1972). The Fertilizer, Farm
Feeds and Remedies Act (Chapter 111) is administered by the Ministry of Lands,
Agriculture and Rural Resettlement. This act prohibits the sale or distribution of
Figure 3.1 Lake Kariba with inflows from Zimbabwean rivers
Source: Wessels et al. (1972).
© 2003 Milton D. Taylor, Stephen J. Klaine, Fernando P. Carvalho, Damia Barcelo and Jan Everaarts
24 Mark F. Zaranyika
pesticides unless they have been registered with the Plant Protection Research
Institute. Registration is carried out under the Hazardous Substances and Articles
Act (Chapter 322) which is administered by the Ministry of Health and Child
Welfare.
Before registration, pesticides are classified on the basis of their acute oral lethal
dose (LD
50
) and persistence after application. The classification (poison group) is
indicated by a green, amber, red, or purple triangle on the label for LD
50
values of
greater than 2,001, 501 to 2,000, 101 to 500, or 0.1 to 100 mg kg
–1
, respectively.
Pesticides can only be imported into the country after they have been registered. It
is also a requirement that all imported pesticides be registered in the country of
origin.
The complete list of registered pesticide products in Zimbabwe is very long
(approximately 600), but compared to the total number of pesticides available
worldwide (>40,000), this number is small. Several companies are involved in the
formulation and marketing of pesticides in Zimbabwe. The major formulators
are (with the number of formulations registered by each company shown in
brackets): Agricura (99), Zimbabwe Fertilizer Co. (ZFC) (71), Windmill (66), Bayer
(62), Shell (48), Ciba-Geigy (34), Spray-quip (26), Hoechst (16), Omnichem (15),
and Wellcome Environmental (17) (Mathuthu, 1993). There are several minor
pesticide formulating companies including Rhone Poulenc (11), Technical Services
(6), Fercochem. (4), Oxyco (4) and T.S.A. (2). Some formulations of Agricura and
ZFC are made totally from local raw materials. The other companies, to a large
extent, merely import the active ingredients from which they make their
formulations.
A list of pesticides commonly used for crop pests in Zimbabwe is given in Tables
3.2 and 3.3. The formulations commonly marketed in Zimbabwe were selected
following a market survey, which involved visits to major outlets that sell pesticides,
e.g. the Farmers Cooperation, Agricultural Buying and Veterinary Services, whole-
sale centers, and supermarkets, in addition to interviews with farmers (Mathuthu,
1993). The pesticides listed in Tables 3.2 and 3.3 are those formulations that are
most commonly used around the country. The tables show the brand name and
a.i. of the pesticide, its poison group, and the chemical class of the compound.
The poison group indicates the degree of toxicity of the pesticide and is indicated
by the symbols P (Purple), R (Red), A (Amber), and G (Green), with P indicating
the most toxic pesticides and G the least toxic.
The Agricultural Chemicals Industry Association (ACIA) represents all
manufacturers and distributors of agrochemical and animal health products in
Zimbabwe. The ACIA is a member of the International Group of National Associa-
tions of Agrochemical Manufacturers (GIFAP). Through GIFAP, the ACIA has
endorsed the FAO’s code of conduct on the distribution and use of agrochemicals
(Mbanga, 1996).
© 2003 Milton D. Taylor, Stephen J. Klaine, Fernando P. Carvalho, Damia Barcelo and Jan Everaarts
Pesticide use in Zimbabwe 25
Table 3.2 Pesticides used in Zimbabwe: grouped according to chemical classes of the
compounds
a
Brand name Active Poison Type of
ingredient group
b
compound
Alfacron 50 W.P. azamethiphos 50% R OP
Kaptasan F captan 31.35% + G OP
fenitrothion 1%
Steladon chlorfenvinphos 30% P OP
Dursban 4E chlorpyrifos 40.8% R OP
Fly Bait dichlorvos 0.5% A OP
Diazinon DFF diazinon 86.88% P OP
Diaz 30 diazinon 30% R OP
Rogor C.E. dimethoate 36% R OP
Dimethoate 40 E.C. dimethoate 40% R OP
Disystem 5% granule disulfoton 5% P OP
Altomix 7.75G disulfoton 7.5% + P OP
cyproconazole 0.25%
Lebaycide 50% fenthion 50% R OP
Folithion 60 E.C. fenitrothion 55.49% R OP
Kontakil fenitrothion 60% R OP
Ant-Killer fenitrothion 17.5% A OP
Anthio 33 E.C. formothion 33% R OP
Fyfanon 1000 E.C. malathion 86% A OP
Kilathion 100 E.C. malathion 83.5% A OP
A.B.C. powder (dust) malathion and other G OP
Damfin 2P methacrifos 2% G OP
Kudzivirira Mbesa malathion 1 G OP
Malathion 1% Dust malathion 1% G OP
Malathion 5% Dust malathion 5% G OP
Malathion 25% W.P. malathion 25% G OP
Malathion 50% E.C. malathion 50% G OP
Pythion 21 malathion 2.2% G OP
Metasystox R 25% E.C. oxydemeton-methyl 25% R OP
Wellcome grainguard pirimiphos-methyl 48.8% G OP
Shumba 2% dust pirimiphos-methyl 2% G OP
Bolstar 720 E.C. sulprofos 72% R OP
Sprayquip stalkborer
2% granules trichlorfon 2.5% G OP
Aldrin 40% W.P. aldrin 40% P OC
Anti-Kil chlordane 30% A OC
Razor chlorthal-dimethyl 36% G OC
Dicofol 40 E.D. dicofol 40% A OC
Kelthane dicofol 18.5% G OC
Dieldrex 50 W.P. dieldrin 50% P OC
Thionex 1% granules endosulfan 1% G OC
Thiodan 1% granules endosulfan 1% G OC
Thiodan 20 E.C. endosulfan 20% P OC
Multi Benhex γ-BHC 12% + total R OC
BHC 75%
Gamatox house spray γ-BHC 5.0% A OC
Bexadust (L) γ-BHC 0.6% G OC
Agri seed dress 75% lindane 1% R OC
Temik 15G aldicarb 15% P carbamate
Carbaryl 85 S carbaryl 85% A carbamate
Carbaryl 85 W.P. carbaryl 85% A carbamate
Harakiri carbaryl 0.3% G carbamate
continued…
© 2003 Milton D. Taylor, Stephen J. Klaine, Fernando P. Carvalho, Damia Barcelo and Jan Everaarts
26 Mark F. Zaranyika
Table 3.2 continued
Brand name Active Poison Type of
ingredient group
b
compound
Cypam E.P.T.C. 77% G carbamate
Baygon residual spray propoxur 2.0% +
dichlorvos 0.5% G carbamate
Decis 2.5 E.C. deltamethrin 2.5% R pyrethroid
Agrithrin Super 5 E.C. esfenvalerate 5% R pyrethroid
ICON 10 W.P. λ-cyhalothrin G pyrethroid
Bymo insect killer pyrethrins 0.125% G pyrethrin
Wellcome permethrin 25% G pyrethroid
G-17 pyrethrins 2.25% G pyrethroid
Dusting powder pyrethrins 0.20% G pyrethroid
Garden insecticide
concentrate pyrethrins 1.5% G pyrethroid
Killem insect aerosol tetramethrin 0.2% +
∆-phenothrin 0.08% G pyrethroid
Gramoxone paraquat 24.75% P heterocyclic
Fungazil 75% S.P. imazalil 75% R heterocyclic
Thiram 80% W.P. thiram 80% (disulphide) R carbamate (fungicide)
Tritifix MCPA/amine 41.5% A phenoxy acid
Copper fungicide copper oxychloride 88% A inorganic compound
Copper oxychloride
50 E.C. copper oxychloride 50% A inorganic
Dormex cyanamide 49% A inorganic amide
Agri Dust dusting sulphur 65% + A inorganic compound
copper oxychloride 6.5% inorganic salt
+malathion 5% A OP
Arsenal imazapyr G heterocyclic
Cosan wettable sulphur sulphur 80% G inorganic compound
Lime sulphur polysulphide sulphur 24.8% G inorganic compound
Racumin rat poison coumatetralyl Na
+
R heterocyclic
Basagran bentazone 48% A heterocyclic
Bladex 5 S.C. cyanazine 50% A heterocyclic
Citrocyclin 90 tetracycline +
hydrochloride 90% A heterocyclic
Funginex triforine 18.7% G heterocyclic
Fumigas 10 ethylene oxide 10% P organic compound
Agrifume EDB 4.5 ethylene dibromide 42.2% P organohalide
Agrithrin 20 E.C. fenvalerate 20% A organic acid derivative
Daconate 6 MSMA 48% A organic acid derivative
MSMA MSMA 48.4% A organic acid derivative
Snail and slug killer metaldehyde 2% G organic acid derivative
Norax ready mixed warfarin 0.0375% A organic compound
NABU sethoxydim 20% G organic compound
Alachlor alachlor 48% P acetanilide
Ronstar FLO oxadiazon 240 g/l A organic amine
Weedkiller M M.C.P.A. 400 g/l
potassium salt A organic salt
Atrazine 5 G atrazine 6.25% G organic acid derivative
Bayer Diuron 80 W.P. diuron 80% G dimethylurea
Bayleton 5% W.P. triadimefon 5% G organic derivative
Bayton 15% triadimenol 15% G alcohol
Benlate benomyl 50% G carboxylic acid
derivative
Mitac amitraz 20% A organic acid derivative
continued…
© 2003 Milton D. Taylor, Stephen J. Klaine, Fernando P. Carvalho, Damia Barcelo and Jan Everaarts
Pesticide use in Zimbabwe 27
Table 3.2 continued
Brand name Active Poison Type of
ingredient group
b
compound
Cotogard 500 F.W. fluometuron 25% +
prometryn 25% G urea derivative triazine
Gesagra 500 F.W. metolachlor 25% +
triazine 23.5% G acetamide
Gibberellic acid gibberellic acid 32% G organic acid
Karathane 2% dust dinocap 2% G nitrophenol
Dithane M-45 W.P. mancozeb 80% G organic acid derivative
Dithane M-45 mancozeb 80% G organic acid derivative
Orchard oil mineral oil 99.7% G petroleum oil
Orchex oil 695 mineral oil 99.25% G petroleum oil
Pilot S.C. quizalofop-ethyl G organic compound
Ronstar Flo oxadiazon 36% G organic amine
Roundup glyphosate 41% G phosphoglycine
Rovral 250 S.C. iprodione 25% G carboxamide
Rovral iprodione 50% G carboxamide
Sprayquip tak n-decanol 79% G petroleum oil
Stomp 500E pendimethalin 50% G nitrobenzamine
TCA 90 grass killer sodium trichloro-
acetate 90% G organic salt
Tordon 101 mixture 2,4-D amine salt 39.6% P phenoxy acid
+ picloram 10.2% carboxcylic acid
derivative
Gesaprim 500 F.W. atrazine 47.0% G atrazine
Gesagard 500 F.W. prometryn 50% G triazine
Gardomil 500 F.W. terbuthylazine 36.7% +
metolachlor 12.5% G triazine acetamide
Tetradifon 8 E.C. tetradifon 8% G sulfone
Notes:
a Reproduced with permission, Table 23 in SADC ELMS Report Series 35 (1993).
b Poison group (see text for LC
50
s corresponding to each group): A (amber) = toxic; G (green)
= non-toxic; R (red) = highly toxic; P (purple) = extremely toxic.
Table 3.3 List of commonly used dipping chemicals in Zimbabwe
a
Brand name Active ingredient Poison group % a.i. Class of compound
Fendona alphacypermethrin G 5 pyrethroid
Paracide alphacypermethrin G 7 pyrethroid
Triatix D amitraz G 12.5 amidine
Barricade cypermethrin A 15 pyrethroid
Ectopor cypermethrin G 2 pyrethroid
Grenade cyhalothrin G 5 pyrethroid
Ektoban cypermethrin G 2.5 pyrethroid
Decatix deltamethrin G 5 pyrethroid
Sumitik fenvalerate A 20 pyrethroid
Bayticol flumethrin G 20g/L pyrethroid
Drastic Deadline flumethrin G l0g/L pyrethroid
Note:
a Adapted from SADC ELMS Report Series 35 (1993).
© 2003 Milton D. Taylor, Stephen J. Klaine, Fernando P. Carvalho, Damia Barcelo and Jan Everaarts
28 Mark F. Zaranyika
Pesticide pollution from agriculture
Zimbabwe is a landlocked country where elevation and rainfall are highly
correlated. Rainfall varies from below 300 mm annually in the low-lying areas in
the south and southeast, to more than 1,500 mm in the mountains bordering
Mozambique. Rain falls from November to March, and only about one-third of
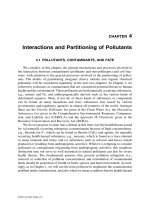
the country is suitable for intensive agriculture. Figure 3.2 shows the agro-ecological
regions of Zimbabwe (ENDA, 1991). Traditionally tobacco has been the primary
agricultural commodity, although cotton, tea, citrus, livestock, wheat, sugar, and
maize are also important. Figure 3.3 shows that all rivers within Zimbabwe originate
from the high veld – veld or veldt is the extensive grassland region of eastern and
southern Africa – where most of the intensive agriculture is practiced. These rivers
drain to the Zambezi River and Lake Kariba in the north, and to the Limpopo
River in the south. The Zambezi and Limpopo rivers are the two major rivers
flowing to the Indian Ocean.
A major climatic factor in the dispersal of pesticides from agricultural use in
Zimbabwe is the fact that rain is usually in the form of short, heavy tropical storms
which result in high erosive runoff during the periods that most pesticides are
applied in agriculture, i.e. between November and January. This high erosive runoff
leads to silting behind dams, so that much of the applied pesticides find their way
directly into river and lake sediments (Zaranyika and Makhubalo, 1996). Evidence
of a build-up of OC pesticide residues in Lake Kariba sediments has been reported
(Zaranyika et al., 1994).
Recently, smallholder vegetable production has rapidly expanded in Zimbabwe.
Sibanda et al. (2000) found these small farmers use some cultural control methods
and occasionally botanical pesticides but for the most part they rely on conventional
synthetic pesticides for controlling the range of serious pests and diseases that
affects nonindigenous vegetables. Synthetic pesticides are usually applied using
lever-operated knapsack sprayers, although occasionally less orthodox application
methods are employed. The primary concerns based on these practices are due to
shortcomings in protective clothing for applicators, large deviations from recom-
mended doses (based on the adage that if a little is good, then more is better), and
excessive runoff to the soil. Both of the latter concerns can lead to a build-up of
pesticide residues in streams and lakes.
PESTICIDE USE IN THE CONTROL OF DISEASE
VECTORS
Tsetse fly infestation in eastern central Africa
Tsetse fly infestation in Africa was reviewed by Ford (1971). In southern east-central
Africa, infestation is mainly by Glossina morsitans Westwood (Diptera: Glossinidae)
and G. pallidipes Austen. Figure 3.4 shows the areas infested. G. morsitans infests the
Brachystegia-Fulbernardia woodlands of Mozambique and Zimbabwe below
© 2003 Milton D. Taylor, Stephen J. Klaine, Fernando P. Carvalho, Damia Barcelo and Jan Everaarts
Pesticide use in Zimbabwe 29
1,200 m above sea level, and the Colophospernum Mopane woodlands in the
Zambezi valley. G. pallidipes is also found throughout these areas inhabiting thicket
or forest-edge areas. Until eliminated by insecticides from Zululand (du Toit, 1959),
it extended further south in Africa than any other species. Figure 3.5 shows the
distribution of G. morsitans and G. pallidipes in Zimbabwe, southern Mozambique
and South Africa in 1959.
Tsetse fly in Zimbabwe
Zimbabwe forms a single natural geographical system, centered upon the watershed
that separates the Zambezi from the Limpopo and Sabi-Lundi river systems (see
Figure 3.2 Agro-ecological regions of Zimbabwe (from ENDA-Zimbabwe, 1991)
© 2003 Milton D. Taylor, Stephen J. Klaine, Fernando P. Carvalho, Damia Barcelo and Jan Everaarts
30 Mark F. Zaranyika
Figure 3.3 Zimbabwe with its major drainage systems
Source: Billings and Phelps (1972).
Figure 3.4 Distribution of G. morsitans and G. pallidipes in S.E. central Africa (adapted
from Ford, 1971). With permission of Oxford University Press.
© 2003 Milton D. Taylor, Stephen J. Klaine, Fernando P. Carvalho, Damia Barcelo and Jan Everaarts
Pesticide use in Zimbabwe 31
Figure 3.3) before they descend from the African Plateau into the Mozambique
Coastal Plain. The eastern highlands form the rim of the plateau in the east. In
the southeast, between the Sabi and the Limpopo, descent to the coastal plain is
more gradual. This region lies in an arid zone of low rainfall (200 to 400 mm per
year), centered over the Limpopo, but extending chiefly northwards. Here, tempera-
tures are high. In the northeast, the Nyanga Mountains slope down to the Zambezi
Valley.
Glossina were found below about 900 m above sea level in the Limpopo Valley,
and below about 1,200 m in the Zambezi Valley. The economically important
portion of Zimbabwe lies above these altitudes, so that in the north and south are
lowlands, both of which were once tsetse infested. The Limpopo Basin lost its
infestation during the Great Rinderpest Panzootic (1889 to 1896), except for the
Mozambique Plain (Ford, 1971). The Zambezi Valley, at least on the Zimbabwe
side, also lost most of its tsetse infestation, except for small pockets.
Figure 3.5 Distribution of G. morsitans in Zimbabwe, southern Mozambique and South
Africa in 1959 (adapted from Ford, 1971). With permission of Oxford
University Press.
© 2003 Milton D. Taylor, Stephen J. Klaine, Fernando P. Carvalho, Damia Barcelo and Jan Everaarts
32 Mark F. Zaranyika
Pollution of the Zambezi River (including Lake Kariba) and the Mozambique
Coastal Plain by OC pesticide residues is related, in the main, to efforts by the
three countries – Zimbabwe, South Africa, and Mozambique to prevent the
recovery and spread of the tsetse fly in the region. Prior to 1961, control of the
spread of the tsetse fly had been carried out by means of brush clearing and game
destruction (Robertson and Kluge, 1968). Ever since 1962, the three countries
have combined their tsetse control campaigns by carrying out annual applications
of persistent pesticides to dry-season resting and refuge sites within the infested
areas (Robertson et al., 1972).
Tsetse control using insecticides in the south-
eastern Zimbabwe–Mozambique border region
The use of persistent insecticides in the reclamation of the Zimbabwe–
Mozambique border region between the Rio Save and the Limpopo River from
G. morsitans was reviewed by Robertson et al. (1972). Between 1953 and 1962, an
extensive and rapid westerly and southwesterly advance of G. morsitans occurred in
the lower Lundi drainage basin in the Zimbabwe–Mozambique border region,
west of the Save River. By mid-1962, the tsetse had advanced to within 80 km of
the Krugger National Park in South Africa. The advance seriously threatened to
extend cattle trypanosomiasis over vast areas on the Nuanetsi and Limpopo basins,
and, thus, became a matter of vital concern to the three countries, Zimbabwe
(then southern Rhodesia), Mozambique, and South Africa. Therefore, joint spraying
operations to control the advance were started. The operations involved ground
application of persistent insecticide to tsetse resting and refuge sites. To ensure
that the pesticide deposits remained lethal for as long as possible, the spraying was
(and is) done in the dry season, during July to the end of September. In the first
two years, the insecticide was applied by means of motorized machines, but, from
1964 onwards, hand-operated spraying machines were used. These sprayers were
(and are) fitted with special nozzles capable of throwing a variable jet of spray up
to a distance of 7.6 m and with special regulating valves capable of giving a constant
output pressure of 2.07 bars. A team of eight spray operators, four of whom are
in action at a given time, carry out the spraying operation. In the field, the team of
spray operators is guided by maps made from aerial photographs of the application
area. Each spray operator normally covers a swathe about 14 m in width.
The type, formulation, and quantity of pesticide used on the Zimbabwe side of
the Zimbabwe–Mozambique border and the year and area sprayed are shown
in Tables 3.4 and 3.5. The increased application rate of the pesticide, from 50
L km
–2
in 1962 to 144 L km
–2
in 1966 as shown in Table 3.4, primarily reflects the
increasing density of suitable tsetse habitats as the work progressed from the
periphery of the tsetse advance to areas of firmly established tsetse flies. During
the same period, 1962 to 1966, spray operations were also conducted on the
Mozambique side of the border. The use of DDT was begun in 1968. The 1970
and 1971 campaigns involved some respraying of areas that had been sprayed
previously.
© 2003 Milton D. Taylor, Stephen J. Klaine, Fernando P. Carvalho, Damia Barcelo and Jan Everaarts
Pesticide use in Zimbabwe 33
Table 3.4 Spraying operations using 3.1 percent dieldrin emulsion in the south-east
Zimbabwe–Mozambique border region 1962–67
Year No. of teams Quantity used (L) Approx. area sprayed (km
2
)
1962 2 46,273 900
1963 2 45,569 1,160
1964 3 75,645 1,300
1965 5 174,907 2,070
1966 6 219,026 1,530
1967 9 1,613,80 2,130
a
Note:
a 830 km
2
in Zimbabwe and 1,300 km
2
in Mozambique.
Table 3.5 Spraying operations in the south-east Zimbabwe–Mozambique border region
1968–71
Year Territory Insecticide Area treated (km
2
) Quantity (L)
1968 Zimbabwe 5% DDT suspension 450 81,146
Mozambique 5% DDT suspension 2,375 233,029
1969 Zimbabwe 5% DDT suspension 266 105,694
Mozambique 5% DDT suspension 1,805 306,423
Mozambique Dieldrin 3.1% 156 43,528
1970 Zimbabwe 5% DDT suspension 207 60,689
Mozambique 5% DDT suspension 2,396 384,933
1971 Mozambique 5% DDT suspension 715 164,680
Tsetse control using insecticides in the
Zambezi valley
Tsetse control spraying in the Zambezi Valley began in 1966, with the ground
spraying of the Gokwe-Sanyati and Urungwe areas between 1966 and 1968. After
this, spraying campaigns were discontinued as a result of intensification of the
‘War of Liberation’, but were resumed after independence in 1980. Figure 3.6
shows the areas sprayed in the periods 1982 to 1984 and 1988. In addition to the
areas shown in Figure 3.6, a study of the operational maps of the Tsetse and
Trypanosomiasis Control Branch of the Department of Veterinary Services shows
that DDT sprays were concentrated in the Binga area of the Zambezi Valley prior
to 1985. Between 1985 and 1990, spraying was conducted mainly east of
Ruzirukuru River in the areas drained by the Sengwa, Ume, Sanyati, and
Gachegache rivers.
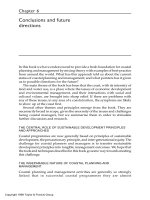
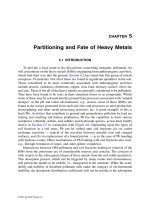
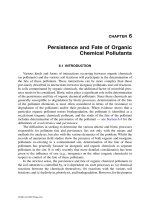
The quantity of DDT used for tsetse control has been declining since 1981 (see
Figure 3.7). In 1981, about 300 T of DDT were used and that figure had dropped
to less than 10 T by 1990 (a personal communication from W. Shereni, Head of
the Tsetse and Trypanosomiasis Control Unit, Department of Veterinary Services,
Ministry of Lands, Agriculture, and Rural Resettlement for Zimbabwe; unrefer-
enced, see Acknowledgments). Two factors have contributed to the drop in the
quantity of DDT used. The first is eradication of the tsetse flies from some locations
© 2003 Milton D. Taylor, Stephen J. Klaine, Fernando P. Carvalho, Damia Barcelo and Jan Everaarts
34 Mark F. Zaranyika
0
50
100
150
200
250
300
DDT used (T)
82 83 84 85 86 87 88 89 90
Year
Figure 3.7 Annual use of DDT for tsetse control in Zimbabwe 1981–90
Figure 3.6 Areas sprayed with DDT in the Zambezi valley between 1982 and 1985, and
in 1988
Source: Department of Veterinary Sciences, Zimbabwe.
© 2003 Milton D. Taylor, Stephen J. Klaine, Fernando P. Carvalho, Damia Barcelo and Jan Everaarts
Pesticide use in Zimbabwe 35
and the resultant reduction in the area infested, and the second factor is the use
of alternative insecticides. These alternative insecticides include endosulfan
(Chapman, 1976), and synthetic pyrethroids such as deltamethrin, α-cypermethrin
and λ-cyhalothrin (Holloway, 1990). Trial aerial sprays with ultra low volume
applications of endosulfan were carried out in 1974 and 1975 in the Gokwe District.
The quantity of endosulfan and the areas sprayed are shown in Table 3.6. Trials
with deltamethrin sprayed on odor-baited targets began in 1988 (Vale et al., 1988).
USE OF PESTICIDES TO CONTROL MALARIA
VECTORS
Malaria control in Zimbabwe began in the late 1940s to a limited degree, responding
only to epidemics (Mpofu et al., 1988). The program has since been expanded and
now covers about two-thirds of the country (Mpofu, 1987). DDT has been used in
Zimbabwe since 1972, replacing hexachlorocyclohexane (HCH) to which vector
mosquitoes had developed resistance. As in many African countries, indoor spraying
is employed, the insecticide being targeted onto the inside surfaces of dwelling
huts, the roof thatch, and eaves (Taylor et al., 1981). The sprays are designed to
achieve a target of 2 g a.i. per m
2
(Mpofu et al., 1988). Figure 3.8 shows the areas
sprayed during 1981 to 1986 and the 1989/90, 1990/91, and 1992/93 seasons,
respectively. Substitution of DDT with deltamethrin, a biodegradable pyrethroid,
began in the 1989/90 spraying season. However, although deltamethrin was
effective and nonpersistent, it was found to be prohibitively expensive, and, in the
1992/93 spraying season, the Ministry of Health, which administers the program,
reverted to the use of DDT.
There is evidence that vector control programs are the main source of DDT
pollution in Zimbabwe (Chikuni et al., 1997). In a study analyzing PCB and DDT
and its metabolites levels in human milk from mothers in seven areas of Zimbabwe,
Chikuni et al. (1997) found that the Kariba area had the highest mean levels of
∑ DDT at 25,259 ng g
–1
milk fat (range was 2,257 to 101,724 ng g
–1
milk fat) by a
factor of >2.5 over the Nyanga fruit-growing area – possible sources in the Nyanga
area include background DDT residues from previous agricultural use and wind
drift from nearby areas of rampant DDT aerial spraying. The Kariba area was
nearly 16-fold higher compared to a rural area, Esigodini, with the lowest mean
∑ DDT concentration, 1,607 ng g
–1
milk fat. However, 100 percent of milk samples
were positive for p.p´-DDE and 98 percent positive for p,p´-DDT. Most of the
Table 3.6 Use of endosulfan in the Gokwe District of Zimbabwe
Year Area (km
2
) Total quantity of insecticide (L) Rate (g ha
–1
)
1974 239 11,500 14
1975 732 24,000 14
© 2003 Milton D. Taylor, Stephen J. Klaine, Fernando P. Carvalho, Damia Barcelo and Jan Everaarts
36 Mark F. Zaranyika
spraying in the Lake Kariba area for mosquito and tsetse flies is done during the
rainy season, so washouts from streams and rivers assist to distribute the DDT,
which eventually finds its way into Lake Kariba (Zaranyika et al., 1994). The lake
provides food, drinking water, and irrigation water for small vegetable gardens so
that the main source of DDT to humans in this area is diet related. The ratio of
DDT to DDE was 0.60 in the Lake Kariba area compared to ratios between 0.15
and 0.28 in the other six areas, confirming the continued use of DDT in vector
control, especially around the environs of Lake Kariba.
IMPACT OF PESTICIDES ON THE ENVIRONMENT
IN ZIMBABWE
Impact on wildlife
The impact on wildlife of the persistent OC pesticides used in the control of tsetse
flies has been of major concern in Zimbabwe, and several surveys have been
conducted in order to assess its effect on birds and other wildlife. Billings and
Phelps (1972), Whitwell et al. (1974), Wessels et al. (1980), and Phelps et al. (1986)
carried out such surveys to assess the impact of the use of pesticides on wildlife.
Figure 3.8 Areas sprayed for malaria control between 1981 and 1993 (reproduced by
permission of the Blair Research Institute, Ministry of Health and Child
Welfare, Zimbabwe)
© 2003 Milton D. Taylor, Stephen J. Klaine, Fernando P. Carvalho, Damia Barcelo and Jan Everaarts
Pesticide use in Zimbabwe 37
The surveys by Billings and Phelps (1972) and Whitwell et al. (1974) were carried
out following the tsetse fly control campaigns in 1962 to 1967 with dieldrin, and in
1968 to 1972 with DDT. The surveys were conducted by analyzing birds’ eggs
and other biological samples collected from various part of the country (see Tables
3.7 and 3.8 and Figure 3.2).
The pesticides tested for in the studies included DDT, DDE, DDD, BHC,
dieldrin, aldrin, and endosulfan. Although the surveys did not find evidence of a
heavy build-up of pesticides in the terrestrial environment as a result of the anti
tsetse spraying, it did find evidence of a build-up of pesticides in the terrestrial
and aquatic environments from agriculture. The study by Billings and Phelps (1972),
involving analyses of eggs, embryos, and body fat of crocodiles, and livers of water-
buck, impala, elephant, darter Anhinga rufa Lacépede and Daudin (Aves: Pelecani-
formes: Anhingidae), and black flycatcher Melaenornis pammelaina Stanley (Aves:
Passeriformes: Muscicapidae), found the highest levels of OC pesticide residues
on agricultural land, while only traces of DDD, DDE, and DDT were found in
the eggs of crocodile and the liver of elephants from game reserves where there is
no agriculture (see Table 3.7). The link between agriculture and the incidence of
pesticide residues in wildlife was further supported by the fact that practically no
Table 3.7 Pesticide residues (mg kg
–1
dw) in animal tissue from different localities in
Zimbabwe
a
Tissue Locality DDD DDE DDT DDT Dieldrin
Croc.
b
egg Sinamwenda 0.69 0.54 0.40 11.64 0.01
Croc. egg Sinamwenda 0.49 0.17 0.24 0.9 0.03
Croc. egg Sinamwenda 0.41 0.24 0.30 0.95 0.09
Croc. egg Sinamwenda 0.42 0.27 0.30 0.99 0.02
Croc. egg Buffalo Range 0.20 0.59 0.47 1.26 0.04
Croc. egg Buffalo Range 0.26 0.69 0.51 1.46 0.05
Croc. egg Buffalo Range 0.18 0.56 0.45 1.19 0.07
Croc. egg Buffalo Range 0.30 0.70 0.57 1.57 0.08
Croc. egg Nyanyadzi 0.16 0.55 0.57 1.28 0.17
Croc. egg Nyanyadzi 0.14 0.48 0.28 0.90 0.14
Croc. embryo Nyanyadzi 0.37 0.13 0.23 0.73 0.12
Croc.abd.
c
fat Chesa TTL
d
0.79 3.68 2.10 6.57 1.33
Barbel abd. fat Chipinda 3.41 11.4 1.88 16.64 ND
e
Darter liver Chipinda ND 6.43 ND 6.43 ND
Darter abd. fat Chipinda ND 23.2 ND 23.2 ND
Flycatcher liver Harare 1.53 29.6 12.3 43.4 ND
Waterbuck liver Victoria Falls 0.09 0.03 0.06 0.18 ND
Victoria Falls 0.10 0.03 0.06 0.19 ND
Victoria Falls 0.12 0.03 0.08 0.23 ND
Notes:
a Adapted from Billings and Phelps, 1972.
b Croc. abbreviation for crocodile.
c Abbreviation abd. represents abdominal.
d TTL represents Tribal Trust Land (the former name for communal land).
e ND represents residue not detected.
© 2003 Milton D. Taylor, Stephen J. Klaine, Fernando P. Carvalho, Damia Barcelo and Jan Everaarts
38 Mark F. Zaranyika
Table 3.8 Pesticide residues in biological samples from various localities in Zimbabwe (µg g
–1
dw)
a
Area Date Species Type of sample DDT DDD DDE
∑
DDT BHC Dieldrin Aldrin Endosulfan
Harare 1972 Fiscal
Shrike lanius young chick –
b
– 5.1 5.5 T
c
–– –
10/72 Masked composite
weaver sample of
Ploceus 2 chicks
velatus and eggs 0.1 0.3 4.3 5.2 – – – –
3/73 Red bishop
Euplectes
orix eggs 0.2 – 2.9 3.3 T T – –
Lake 7/72 Egyptian
Chivero goose
Aplopochen
aegyptiacus egg ––––––––
9/72 Blackheaded
heron
Ardea
melanocephala egg – – 4.7 5.1 0.1 – 0.1 –
Rusape 1972 Black
goshawk
Accipter
melanoleucus chicks – 1.5 29.7 32.4 0.4 3.9 – –
Headlands 1972 African
goshawk
Accipter
tachiro egg – – 0.5 0.5 T – – –
© 2003 Milton D. Taylor, Stephen J. Klaine, Fernando P. Carvalho, Damia Barcelo and Jan Everaarts
Pesticide use in Zimbabwe 39
Area Date Species Type of sample DDT DDD DDE
∑
DDT BHC Dieldrin Aldrin Endosulfan
Kariba 1/73 Reed composite
(Charara cormorant sample of
cleared area) Phalacrocorax 2 eggs
africanus preserved
boiled B
d
B 3.4 3.7 T 0.16 T B
7/71 Darter egg from
Anhinga rufa oviduct
preserved
in formalin 0.4 0.3 2.7 0.5 T B B B
7/71 8 Reed composite
cormorants sample of
4 Darters 8 livers
preserved in
formalin B B 0.9 1.0 B B B B
Matopos 1970 Black eagle addled egg
Aquila preserved
verreauxi frozen T T T T T T B B
1971 Black eagle addled egg
preserved
frozen T B T T T B B B
1971 Black eagle addled egg
preserved
frozen T B T T T B B B
Gonarezhou 1971 Wahlberg’s
eagle egg T – 0.3 0.3 – 0.1 – –
1971 Chanting
goshawk
Melierax
musicus egg – – 0.2 0.2 – – – 2.2
continued…
© 2003 Milton D. Taylor, Stephen J. Klaine, Fernando P. Carvalho, Damia Barcelo and Jan Everaarts
40 Mark F. Zaranyika
Area Date Species Type of sample DDT DDD DDE
∑
DDT BHC Dieldrin Aldrin Endosulfan
1971 Wahlberg’s
eagle egg – – 0.2 0.2 T – 0.2 –
1971 Chanting
goshawk egg – – – – T – – –
1972 Black
vulture
Torgos
tracheliotus egg – – 1.6 1.7 – – – –
1972 Black
vulture egg – – 0.4 0.5 – – – –
1972 African hawk
eagle
Hieraaetus
spilogaster egg – – 0.4 0.5 – – – –
1972 Black-
breasted
snake eagle
Circaetus
pectoralis egg – – 0.6 0.7 T 0.8 – –
1972 Hooded
vulture
Necrosyrtes
monachus egg – – 0.5 0.6 T 0.3 – –
1972 Giant eagle
owl
Bubo lacteus egg 0.7 T 1.3 2.1 – – – –
Copper 1971 Mopane
Queen bark control 500 – T 500 – – – –
control 539 – T 539 – – – –
control 549 – T 549 – – – –
Notes: a Adapted from Whitwell
et al.
, 1974. b Em dash (–) indicates residue not detected. c T indicates trace. d B indicates benzene.
© 2003 Milton D. Taylor, Stephen J. Klaine, Fernando P. Carvalho, Damia Barcelo and Jan Everaarts
Pesticide use in Zimbabwe 41
residues were found in eggs of birds from Hatopos, an area of very little agricultural
activity near the border with Botswana to the west. The study by Whitwell et al.
(1974), involving analysis of birds’ eggs from Lake Chivero (or McIlwaine, as it
used to be called) outside the tsetse control area, showed that eggs of the black-
headed heron, Ardea melanocephala Virgors and Children (Aves: Ciconiiformes:
Ardeidae), whose diet includes aquatic animals, contained pesticide residues. At
Lake Kariba, pesticide residues were found in fish-eating birds taken from basins
that receive drainage from agricultural areas. Similar findings were reported by
Wessels et al. (1980) following a study involving analysis of crocodile eggs from
Lake Kariba, see Table 3.9. This study found increased residue levels in one basin
of the lake, generally in accordance with land use practice in the area drained by
the major tributaries running into the basin. The survey conducted by Phelps et al.
(1986) from 1981 to 1982 is the most recent. These workers reported that chlori-
nated hydrocarbon residues were widespread in Zimbabwe. As with the earlier
survey by Whitwell et al. (1974), this survey involved analysis of crocodile eggs
collected from several localities. All eggs analyzed showed residues of DDT and
its metabolites (see Table 3.10), the levels of which were found to be related to the
type of land use in the specific area from which they were collected. Toxaphene
was detected in crocodile eggs from cattle ranching areas, while polychlorinated
biphenyls were recorded near industrialized areas.
Impact on Lake Kariba and its environs
All the studies discussed in the preceding section found evidence of contamination
of Lake Kariba by OC pesticide residues. A further study by Phelps et al. (1989),
involving analysis of crocodile fat samples collected from seven localities on the
shoreline of the lake, found levels of DDT as high as 80 µg g
–1
(see Table 3.11).
Further evidence of the pollution of Lake Kariba by OC pesticide residues was
reported by Kiibus and Berg (1991), Berg et al. (1992), Douthwaite (1992), and by
Zaranyika et al. (1994). The Kiibus and Berg (1991) and Berg et al (1992) study
was conducted by sampling and analyzing fish, mussels, snails, prawns, and birds
from different localities and trophic levels of the lake in an effort to find some
pattern in the distribution of the residues, mainly DDT and its metabolites. They
found that DDT seemed to be both bioaccumulating and biomagnifying in the
lake. They also showed that the levels of DDT were generally high compared to
levels found in lakes outside the tsetse control areas (see Table 3.12). The algae
feeder, redbreast tilapia Tilapia rendalli Boulenger, had 1,900 ng g
–1
fat ∑ DDT
while the predatory tigerish Hydrocynus forskahlii Cuvier (Characiformes: Alestiidae,
African tetras) had levels of 5,000 ng g
–1
fat ∑ DDT (Berg et al., 1992). Highest
levels of ∑ DDT were found in bottom-dwelling species, i.e. the mussel Corbicula
africana (Bivalvia: Corbiculidea) at 10,100 ng g
–1
fat ∑ DDT, and in benthos feeding
fish, e.g. Labeo altivelis Peters (Cypriniformes: Cyprinidae) at 5,700 ng g
–1
fat ∑ DDT
(Berg et al., 1992).
Douthwaite (1992) carried out surveys to assess the effects of DDT treatments
applied for tsetse control on white-headed black chat Thamnolaea arnoti Tristram
© 2003 Milton D. Taylor, Stephen J. Klaine, Fernando P. Carvalho, Damia Barcelo and Jan Everaarts
42 Mark F. Zaranyika
Table 3.9 OC insecticide residues in 15 crocodile eggs (µg g
–1
dw) from Lake Kariba, Zimbabwe
a
Collection site Nest and α-BHC β-BHC Dieldrin p,p´-DDE p,p´-DDD p,p´-DDT ∑ DDT
egg number
Mwenda River mouth M6 i –
b
– – 1.33 0.38 0.29 2.0
M7 i – – – 1.97 0.69 0.44 3.1
M7 ii – – – 1.98 0.66 0.56 3.2
Sengwa River mouth Is.
c
7 i – – – 2.09 0.75 0.46 3.3
Is.13 i – – – 0.53 0.20 0.23 0.96
Is.27 i – – – 1.22 0.82 0.29 2.33
Is.27 ii – – – 1.13 0.45 0.43 2.01
Is.34 i – – – 0.61 0.28 0.28 1.17
Is.35 i – – – 9.00 0.80 0.98 10.78
Spencer Creek K1 i 0.18 9.63 1.19 4.09 0.95 1.10 6.14
K3(1) i 0.07 1.01 – 0.67 0.50 0.69 8.0
Crocodile farm K3(4) i 0.22 6.38 – 1.42 2.56 – –
Gwai mouth i 0.01 – – 6.85 3.00 1.09 10.94
Deka mouth i – – – 14.2 3.25 4.50 21.9
Zambezi River mouth i 5.63 24.5 – 14.0 2.00 2.18 18.18
Notes:
a Adapted from Wessels
et al
., 1980.
b En dash (–) indicates residue not detected.
c Is. represents island.
© 2003 Milton D. Taylor, Stephen J. Klaine, Fernando P. Carvalho, Damia Barcelo and Jan Everaarts
Pesticide use in Zimbabwe 43
(Aves: Passeriformes: Turdidae) populations in northwest Zimbabwe in the Zambezi
Valley between 1987 and 1990. The survey was carried out in woodlands that had
been sprayed with DDT at the rate of 200 g ha
–1
. In separate studies, population
drops of 88 percent over 33 months and 74 percent over 9 months were reported.
The author concluded that tsetse spraying operations have had a severe, and possibly
prolonged, impact on the white-headed black chat population of northwest
Zimbabwe. Zaranyika et al. (1994) analyzed sediment samples from seven of the
major river bays on the Zimbabwean side of the lake (see Figure 3.1). The results
obtained (see Table 3.13) confirmed that there was contamination of most bays by
DDT and its metabolites, endosulfan, aldrin, dieldrin, endrin, and heptachlor.
Table 3.10 OC insecticide and PCB residues in crocodile eggs from Zimbabwe (µg g
–
dw)
a
Source HCB
α
-BHC
β
-BHC p,p´-DDE p,p´-DDD p,p´-DDT
∑
DDT PCB
Sengwa River
clutch 10/1981 0.003 0.005 0.002 3.26 0.87 1.08 5.21 0.029
0.003 0.004 0.003 3.82 1.23 1.40 6.45 0.034
ND
b
0.002 0.003 3.94 0.88 1.15 4.97
Sengwa River
clutch 10/1981 0.002 0.002 0.003 1.96 0.61 0.67 3.24
0.002 0.007 0.002 1.86 0.59 0.69 3.14
Mpalangena River
10/1981 ND ND 0.210 5.02 0.72 0.74 6.48
0.004 0.002 0.218 3.11 0.72 0.66 4.49
Chundu Island
10/1981 0.004 0.003 0.013 4.60 0.51 0.61 5.72
0.003 0.044 0.083 5.43 2.63 1.97 10.03
Kariba crocodile
farm 9/1981 0.003 0.046 0.250 16.29 5.68 3.94 25.91 0.063
Lake Chivero
10/1981 0.003 0.011 1.262 6.22 1.29 1.24 8.75 1.530
ND 0.018 1.548 10.31 2.05 1.89 14.25 1.356
ND 0.010 1.398 6.21 1.40 1.14 8.75 1.023
ND 0.011 1.211 5.99 1.21 1.11 8.31 1.220
0.003 0.009 1.664 5.89 1.21 1.22 8.32 1.351
ND 0.011 1.506 6.49 1.49 1.33 9.28 1.351
Ngezi Park
10/1981 0.003 0.004 0.045 3.08 0.69 0.51 4.28 0.053
ND 0.003 0.061 3.76 0.90 0.60 6.26 0.038
Kyle Park 0.003 0.004 0.154 3.13 0.66 0.48 4.27 0.248
0.004 0.005 0.202 3.38 0.64 0.52 4.54 0.270
ND 0.006 0.538 8.01 1.85 1.53 11.39 0.185
ND 0.004 0.280 4.46 0.78 0.68 5.92 0.143
ND 0.005 0.213 8.95 2.69 2.72 14.36 0.143
Runde River I
10/1981 0.002 0.007 0.148 3.26 0.71 0.52 4.49 0.221
ND 0.003 0.092 4.25 0.70 0.53 5.48 0.153
Runde River II ND 0.004 0.043 3.07 0.23 0.34 3.64 0.110
Notes:
a Adapted from Phelps
et al.
, 1986.
b ND indicates residue not detected.
© 2003 Milton D. Taylor, Stephen J. Klaine, Fernando P. Carvalho, Damia Barcelo and Jan Everaarts
44 Mark F. Zaranyika
Table 3.11 Levels of residues of DDT and its metabolites in fat of crocodiles (pg g
–1
dw fat
a
) from seven localities on the shoreline of Lake Kariba,
Zimbabwe
b
Locality Sample No./Sex
c
Bodymass (kg) o,p-DDE p,p´-DDE o,p-TDE p,p´-TDE p,p´-DDT ∑ DDT
Kasese River 1/F 5.97 0.28 1.91 0.46 0.50 –
d
3.15
2/M 58.04 0.28 17.08 – 2.31 2.26 21.93
3/F 15.87 0.08 3.65 – 0.42 0.09 4.24
4/F 48.53 0.27 9.87 – 0.73 1.65 12.52
Cutty Sark 6/M 4.54 0.15 3.08 0.56 0.93 0.30 5.02
Rifa River 7/F 6.80 2.23 46.12 – 6.43 20.31 75.09
8/M 4.08 0.97 44.58 – 1.84 5.94 53.31
Banana Farm 9/F 7.26 2.66 47.54 – 7.25 10.26 67.71
10/M 6.80 2.50 45.26 1.32 5.87 9.31 64.26
11/M 19.50 3.86 49.33 – 11.62 18.90 83.71
Charara River 12/F 16.30 0.32 14.41 – 1.10 1.49 17.32
13/M 8.62 0.65 34.19 – 1.63 2.04 38.51
Antelope Island 14/F 5.66 0.20 20.31 – 1.49 1.62 23.62
Nyaodza River 15/M 55.32 0.69 23.39 – 2.28 4.12 30.48
16/F 58.04 8.23 21.97 – 13.50 12.47 88.71
17/F 35.82 0.66 20.04 1.26 4.95 4.37 31.28
18/F 17.69 0.90 36.65 – 3.91 3.94 45.40
19/F 82.99 0.52 14.73 – 3.13 3.03 21.41
20/F 6.80 0.24 16.69 – 1.24 1.30 19.17
21/M 14.51 0.15 4.73 – 0.58 0.39 5.04
22/M 4.99 0.16 6.87 0.46 1.02 0.68 9.19
23/M 7.26 0.51 33.81 – 1.86 2.20 38.39
Notes:
a Fat samples extracted using hexane. The hexane was evaporated off before weighing and the fat was then redissolved for final a
nalysis.
b Adapted from Phelps
et al
., 1989.
c M for male; F for female.
d En dash (–) indicates residue not detected.
© 2003 Milton D. Taylor, Stephen J. Klaine, Fernando P. Carvalho, Damia Barcelo and Jan Everaarts
Pesticide use in Zimbabwe 45
Table 3.12 Average values (ng g
–1
dw) of DDT, HCH, aldrin and DDT/∑ DDT for fish
from Lake Kariba, Lake Chivero, and Mazvikadei Dam, Zimbabwe
a
Species Source No. DDT HCH Aldrin DDT/∑ DDT
Red-breasted Tilapia Kariba 20 360– 25– 3–4 0.17–
(Tilapia rendalli) 2,100 64 0.73
Mazvidadei 8 2100 46 87 0.12
Chivero 22 790 640 0 0.27
Manyame Labeo
(Labeo altivelis) Kariba 8 5,700 44 17 0.04
Chivero 9 1,100 1,100 0 0.23
Tigerfish
(Hydrocynus forskahlii) Kariba 14 5,000 47 15 0.2
Chivero 7 1,000 1,300 0 0.17
Note:
a Adapted from Kiibus and Berg, 1991.
Table 3.13 ∑ DDT, ∑ Drins, ∑ DDE, endosulfan, heptachlor, and ∑ DDE/∑ DDT ratios
in sediments from the Charara (C), Nyaodza (N), Gachegache (G), Sanyati (S), Ume
(UN), Sengwa (SN), and Ruzirukuru (Rz) River bays around Lake Kariba, Zimbabwe (in
ng g
–1
dw)
Sampling point ∑ DDT ∑ DDE ∑ DDE/ ∑-Drins Endosulfan Heptachlor
∑ DDT
C
3
ND
a
ND 1.67 ND ND
C
1
112.60 112.600 1.00 0.017 24.20 ND
S
4
12.30 1.260 0.10 ND ND 0.876
S
6
ND ND ND ND 4.900
UM
1
ND ND ND 1.91 40.02
SN
1
65.70 10.500 0.16 34.70 2.23 0.882
SN
2
ND ND ND 51.50 16.10 0.019
RZ
1
13.64 9.340 0.68 2.27 ND 2.660
RZ
2
16.60 ND 32.70 25.50 ND
G
3
5.62 ND 20.50 12.00 3.590
G
1
20.04 0.392 0.12 ND 167.80 ND
N
3
13.59 1.730 0.13 63.70 ND ND
Source: adapted from Zaranyika
et al.
, 1994
Note:
a ND indicates residue not detected.
IMPACT OF PESTICIDES ON OTHER LAKE
ECOSYSTEMS AND COASTAL ZONE ECOSYSTEMS
IN EASTERN SOUTH CENTRAL AFRICA
In this chapter I have given a detailed description of the impact of pesticides on
the Lake Kariba ecosystem and the background for the problem. This has been
possible because of the large amount of research work that has been published on
© 2003 Milton D. Taylor, Stephen J. Klaine, Fernando P. Carvalho, Damia Barcelo and Jan Everaarts