Pesticide Residues in Coastal Tropical Ecosystems: Distribution, fate and effects - Chapter 12 potx
Bạn đang xem bản rút gọn của tài liệu. Xem và tải ngay bản đầy đủ của tài liệu tại đây (1.43 MB, 36 trang )
338 Elba M. de la Cruz and Luisa E. CastilloChapter 12
The use of pesticides in
Costa Rica and their impact
on coastal ecosystems
Elba M. de la Cruz and Luisa E. Castillo
INTRODUCTION
Costa Rica is the second smallest country in Central America, with an area of
51,100 km
2
, and extends from approximately Lat. 8
°
to 11
°
N and between Long.
83
°
and 86
°
W. Costa Rica is bordered by Nicaragua on the north, Panama on the
south, the Caribbean Sea on the east, and the Pacific Ocean on the west. It has an
elongated form that stretches from northeast to southeast with a greatest length of
480 km on the northwest–southeast axis and a narrowest width between the
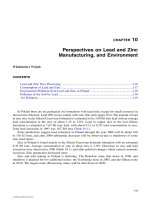
Caribbean and the Pacific of only 118 km (Figure 12.1).
The highest regions of Costa Rica are in the center of the country; its lowlands
are more extensive and flat on the Caribbean side and to the north than on the
Pacific side. Costa Rican geology dates from 150 M years ago; the consolidation
of its mountainous backbone was associated with a long history of volcanic activity.
Sixty-eight volcanoes have been identified of which nine are considered to be
active. Its mountainous backbone can be divided into two units, separated in the
middle of the country by two valleys, those of the Rio Grande de Tárcoles and the
Reventazón (Castillo-Muños, 1983; Trejos, 1991).
Costa Rica has a patrimonial sea area of 520,000 km
2
, about 10 times its national
territory, although the characteristics of the Pacific and the Caribbean coastal
regions are quite different. The Caribbean Coast is straight and short, 212 km,
while the Pacific Coast is very irregular with many peninsulas, capes, points, islands,
and gulfs over a length of 1,328 km (Quesada, 1990).
Costa Rica’s tropical location between two oceans with its complex mountain
systems causes a great variety of climatic conditions. There are two defined rainfall
regimes: one for the Caribbean side and another for the Pacific side. On the
Caribbean side, including both the northern lowlands and the Caribbean coastal
regions, there is not a defined dry season. In the coastal zone, there are relatively
dry periods, one in March and April and another in September and October. On
the Pacific side there are two distinct seasons: one rainy and one dry. The rainy
season extends from May to the middle of December and the dry season runs
from January to April.
© 2003 Milton D. Taylor, Stephen J. Klaine, Fernando P. Carvalho, Damia Barcelo and Jan Everaarts
The use of pesticides in Costa Rica 339
A mountainous backbone, coupled with abundant rainfall, results in Costa Rica
having an extensive hydrographic system. The Costa Rican Electricity Institute
has divided this hydrographic system into 34 watersheds. The system comprises
two versants, one toward the Pacific side and another toward the Caribbean side
(Trejos, 1991). The later is usually subdivided into two parts. A northern sub-
versant carries water toward Lake Nicaragua and the San Juan River and through
it to the Caribbean. The Caribbean or Atlantic sub-versant, carries water directly
to the Caribbean. Due to the narrowness of its territory, Costa Rica has relatively
small watersheds (Trejos, 1991). The largest watersheds – those more than 2,000
km
2
– include Grande de Térraba (5,000 km
2
); Tempisque (3,400 km
2
); Reventazón-
Parismina (3,000 km
2
); Sixaola (2,700 km
2
); San Carlos (2,650 km
2
); Grande de
Tárcoles (2,150 km
2
); and the Sarapiquí (2,150 km
2
).
Costa Rica is a democratic republic; its Constitution established that the govern-
ment of the republic is to be exercised through three distinct and independent
powers: the Legislative, Executive, and Judicial powers. Costa Rica’s territory is
divided into seven provinces including San José (the capital), Alajuela, Cartago,
Heredia, Guanacaste, Puntarenas, and Limón. These provinces are subdivided
into cantons and in each canton there is a municipality whose leaders are elected
by the people to administer the community’s interests (Trejos, 1991).
Figure 12.1 Costa Rica’s location and primary river systems
© 2003 Milton D. Taylor, Stephen J. Klaine, Fernando P. Carvalho, Damia Barcelo and Jan Everaarts
340 Elba M. de la Cruz and Luisa E. Castillo
PESTICIDE REGULATIONS
Control of pesticide labeling and handling in Costa Rica is primarily the respon-
sibility of the Ministries of Agriculture and Health. Pesticide use was first regulated
by a 1954 law requiring information on the physical properties, recommended
uses, and health risks of all locally produced and imported pesticides. Then in
1976, the Regulation on Pesticide Control was passed to implement procedures
for the registration and control of all pesticides with both agricultural and domestic
uses entering the country. Evaluation of a pesticide’s toxicity is the duty of the
Ministry of Health. This ministry had, and still has, the authority to ban or restrict
registered uses of a compound if they consider it dangerous to human or animal
health (Castro, 1998). There are two primary laws and many related laws and
regulations controlling the major aspects of pesticide use in Costa Rica. The
Phytosanitation Protection Law of 1968 (revised in 1978 and 1997) is administered
by the Ministry of Agriculture and the General Law of Health 1973 (revised in
1975, 1980, 1982, and 1988) is administered by the Ministry of Health.
The Ministry of Agriculture has complete authority to regulate the use of all
agricultural crop protection chemicals including their environmental, wildlife, and
human health effects. They also have the right to determine when chemical control
must be replaced by biological control to reduce environmental pollution. Under
the authority of the General Law of Health, the Ministry of Health promulgates
rules for importing, handling, storing, transporting, marketing, distributing, and
applying pesticides. All pest control products not under the Phytosanitation Law
and capable of poisoning or causing serious damage to the health of humans or
non-target organisms must be registered and receive a permit from the Ministry
of Health before being used. This law allows health authorities to institute certain
preventive measures, e.g. to retain or remove products from the market, to destroy
or neutralize contaminated materials, and to confiscate damaged or suspicious
products. They also have the authority to close pesticide storehouses, formulating
plants and retail shops, and cancel pesticide permits or registrations (Castro, 1998).
In 1989, the National Pesticide Use Advisory Commission was reorganized –
the previous commission was created in 1972 – and tasked to evaluate the toxicology
of pesticides, to recommend banning dangerous substances, to re-examine approved
pesticide registrations, and to make suggestions or observations to the Ministries
of Agriculture and Health (Hilje et al., 1992; Castro, 1998). It may re-evaluate a
registration acting upon a request from one of the Ministries (Castro, 1998). The
1989 Commission is composed of nine members with two representatives from
the agrochemical industry, two from the Ministry of Agriculture, and one each
from the Ministry of Health, the National Agronomist Association, the Ministry
of Work and Social Security, the Ministry of Environment and Energy, and the
National Center for Poison Control (Castro, 1998). The Commission is responsible
for coordinating its activities and developing consensus recommendations from
stakeholders among different pesticide-related interest groups. The law ‘Regis-
tration, Use and Control of Agriculturally Used Pesticides and Related Products
© 2003 Milton D. Taylor, Stephen J. Klaine, Fernando P. Carvalho, Damia Barcelo and Jan Everaarts
The use of pesticides in Costa Rica 341
(1995)’ regulates a pesticide’s commercial life including registration, labeling,
unloading, manufacturing, formulation, packaging, commerce, storage, transport,
use and management, destruction of empty pesticide packages, pesticide residues,
unused pesticides, and spill cleanup.
In principle, all occurrences of acute, subacute, and chronic effects from either
a voluntary or accidental pesticide poisoning must be reported to the Ministry of
Health – charged with keeping a registry of these cases. Every person who handles
or applies pesticides on a regular basis must have a pre-exposure medical checkup
followed by an annual medical checkup. In special cases, medical checkups may
be more frequent. The law does not allow persons less than 18 years old to work
with or apply pesticides. Persons applying pesticides by aerial or ground application
methods must inform the Ministry of Agriculture of the date, time, location,
pesticide, and method of application at least 72 h in advance. The local Ministry
official then notifies apiculturists 48 h in advance to protect their bees and beehives.
Signs must be posted to warn people to keep themselves and their animals out of
the application area. Controls and procedures following accidents are not well
established in the law. Responsibility can rest with the landowner (for failure to
inform the Ministry of Agriculture), the owner of the aerial (crop dusting)
application company (for a malfunctioning airplane), the pilot (for spraying the
wrong field), the professional agriculturist (for recommending the wrong products
or application rates), or even the injured party (for failure to protect himself or his
animals).
Water resources are protected under two laws, one promulgated in 1989 to
protect important aquifers and the other in 1997 to regulate industrial wastewater
and effluents. The initial use of water quality criteria in Costa Rica was to legislate
pesticide residue concentrations in water bodies. The maximum allowable pesticide
concentrations in waste or natural waters are 0.05 mg L
–1
for ∑-OC pesticides
and 0.1 mg L
–1
for both ∑-OP and ∑-carbamate pesticides (Castro, 1998).
Agricultural and other pest control practices in Costa Rica are highly dependent
on synthetic pesticide use. However, no official policy exists to reduce the quantity
of pesticides used or to change from the more toxic and dangerous products to less
toxic ones. A list of the a.i.(s) regulated or prohibited in Costa Rica is presented in
Table 12.1. Pesticides classified as highly toxic are restricted for use and can only
be sold with a professional prescription.
Even though there are laws and regulations governing pesticide use in Costa
Rica, these are often transgressed, causing health and environmental problems.
These problems include exposure and poisoning of workers and the general popula-
tion (with some individuals being less than 18 years old) and exposure of aquatic
organisms, domestic animals, and wildlife with fatal consequences occasionally
resulting from the exposures. Improved laws, especially in environmental quality
criteria, and improved implementation and enforcement is a must.
© 2003 Milton D. Taylor, Stephen J. Klaine, Fernando P. Carvalho, Damia Barcelo and Jan Everaarts
342 Elba M. de la Cruz and Luisa E. Castillo
PAST AND PRESENT PESTICIDE USE IN COSTA
RICA
Pesticide imports
Environmental problems created by the misuse of pesticides in developing countries
are extensive. Costa Rica, having an agriculture-based economy, has also been
influenced by the production of these chemicals. Information regarding methods
of pest control during pre colonial, colonial, and republican times is almost non-
existent (Hilje et al., 1989). The first chemical used to control pests in Costa Rica
was called ‘Tree Tanglefoot’ – a product made from natural tree resins which have
been polymerized with castor oil and further waterproofed with vegetable waxes;
its mode of action is mechanical – and was introduced by 1916. In 1926, copper
Table 12.1 Pesticides with prohibited or restricted use in Costa Rica
a
Year a.i.(s) Legal status
1960 cianogas prohibited
1960 mercurial prohibited
1982 arsenic compounds
b
prohibited except they could still be
used to combat fungal diseases in
coffee
1987 carbofuran, ethyl parathion, methyl restricted use; sold only with
parathion, phosphine, phorate, authorization and red strip label
monocrotophos
1987 2,4,5-T prohibited
1988 aldrin, DDT
c
, dieldrin, toxaphene, prohibited
chlordecone, chlordimeform,
dibromochloropropane, ethylene
dibromide, dinoseb, nitrofen
1989 captafol prohibited
1990 lead arsena(i)te
b
, endrin, penta- prohibited
chlorophenol, cihexatin
1991 chlordane, heptachlor all uses prohibited in 1998
1992 daminozide restricted use; only for ornamental
plants
1995 methyl bromide restricted use
1996 captan restricted use
1996 lindane and its isomers, ethephon
d
prohibited
1998 declorane (mirex) and arsenic prohibited
compounds
b
Notes:
a Source: adapted from Castro, 1998; UNA/IRET, 1999; Phytosanitary Department of the
Ministry of Agriculture, Costa Rica.
b Lead arsen(i)ate was prohibited in 1990. However, in 1991, its use was again permitted. It was
in 1998 that importation and use of all arsenic compounds was prohibited in Costa Rica.
c Law still allows the Ministry of Health to use DDT in exceptional situations for combating
malaria-carrying mosquitoes when there is no alternative.
d Ethephon is banned only for coffee bean ripening.
© 2003 Milton D. Taylor, Stephen J. Klaine, Fernando P. Carvalho, Damia Barcelo and Jan Everaarts
The use of pesticides in Costa Rica 343
sulfate was used extensively to combat diseases in crops. During this time the
convenience of using chemical substances to control any pest damaging a crop
was already a common thought among farmers (Hilje et al., 1989). Since then,
pesticide importation and use in Costa Rica has slowly increased, reaching its
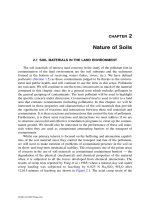
highest quantities after 1992. Figure 12.2 shows the quantity of formulated
pesticides imported from 1970 to 1996. Even though the available pesticide import
data has always been deficient, in the 1980s and 1990s the nature of the data
permitted separation of disinfectants, organic solvents, and other similar products
and the calculation of kg of a.i. being imported. The quantity of formulated
pesticides imported during 1970 amounted to 5.6 M kg and in 1996 surpassed 14
M kg (Figure 12.2). The imported quantity of pesticides had risen to 18 M kg in
1997 (de la Cruz et al., 1998). There was a modest reduction in the quantity of
pesticides imported during the late 1980s. The reasons for this may be attributed
to improvements in the data registers, which permitted better separation of other
products from pesticides, and decreases in the prices of Costa Rican export cash
crops. The increase in the quantity of pesticides imported during the 1990s must
be attributed to the expansion of cultivated area for highly pesticide dependent
crops, e.g. banana, rice, melon, watermelon, pineapple, and ornamental plants,
during the same period. In Costa Rica, the most important pest control method
for insects, other invertebrates, vertebrates, weeds, and diseases is pesticides (Hilje
et al., 1992). Hilje (1984) has calculated that in 95 percent of the cases where an
insect was the organism causing damage on a plantation, it was controlled with
pesticides.
0
4,000
8,000
12,000
16,000
1970
1972
1974
1976
1978
1980
1982
1984
1986
1988
1990
1992
1994
1996
Year
Tonnes importedD
Figure 12.2 Tonnes of formulated pesticides imported by Costa Rica from 1970–96
(adapted from Castillo et al., 1989; Hilje et al., 1992; IRET database)
© 2003 Milton D. Taylor, Stephen J. Klaine, Fernando P. Carvalho, Damia Barcelo and Jan Everaarts
344 Elba M. de la Cruz and Luisa E. Castillo
The type of pesticides used in Costa Rica has also changed with time. Neverthe-
less, about 13 products have dominated the import list for the last 12 years (1985
to 1997), among them mancozeb, 2,4-D, glyphosate, chlorothalonil, ethoprophos,
paraquat, terbufos, cadusafos, methyl bromide, carbofuran, propanil, tridemorph,
and fenamiphos (Table 12.2). During the 1990s, the nematicide cadusafos became
a dominant imported pesticide. It is primarily used on banana plantations and
was heavily imported at the beginning of the 1990s, but by 1995 the quantity of
imports was reduced due to its high price. Then, traditional products such as
terbufos, carbofuran, and ethoprophos again increased (Chaverri and Blanco 1995;
IRET database).
Inorganic pesticides, e.g. copper and sulfur related compounds, constituted the
bulk of pesticides used before the 1950s. OC insecticides predominated during
the 1960s and 1970s. From 1977 to 1979, about 815 T of OCs including DDT,
dieldrin, heptachlor, chlordane, aldrin, endrin, toxaphene, endosulfan, and lindane
were imported. By the 1987 to 1989 period, the quantity of OCs had declined to
242 T and included declorane (mirex), lindane, chlordane, heptachlor, penta-
chlorophenol, and endosulfan. From 1995 to 1997, only about 183 T of the OCs
endosulfan and chloroneb were imported (Vega et al., 1983; Hidalgo, 1986; Castillo,
et al., 1989; Hilje et al., 1989; Hilje et al., 1992; Instituto Regional de Estudios en
Sustancias Tóxicas (IRET) database). The dramatic reduction in the importation
of OC pesticides can be attributed to prohibition and other restrictive regulations
imposed on their use by Costa Rica. Other organic pesticides, e.g. dithiocarbamates,
carbamates, phenoxyacetic acid, OPs, benzonitriles, morpholines, bipyridils,
anilides, triazines, and pyrethroids, replaced the OCs during the 1970s to the 1990s.
From 1970 to 1979, no detailed import records of a.i.(s) and quantities exist, but
products including mancozeb, methyl bromide, aldicarb, 2,4-D, glyphosate, chloro-
thalonil, tridemorph, terbufos, paraquat, propanil, ethoprophos, cupric compounds,
diuron, methamidophos, carbofuran, carbendazim, thiabendazole, and terbuthyl-
azine were being imported (Vega et al., 1983). DBCP, a well-known nematicide
with negative effects on male reproduction, was also imported during this time.
Currently Costa Rica imports approximately 280 pesticides that are sold under
more than 2,000 different brand names (IRET database). From 1992 to 1997,
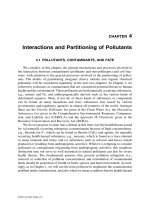
Costa Rica imported about 40.1 M kg of pesticide a.i.(s) (Figure 12.3 A) for
approximately US$530 M (Figure 12.3 B) and the yearly quantity of pesticides
imported continued to increase during the period. Total pesticide a.i. imports in
1997 (8,972 T) were 59 percent higher than in 1992 (5,656 T) (Figure 12.3 A) and
an increase of 39 percent for formulated products occurred over the same period.
The cost of these pesticides escalated from US$74.6 M to US$117 M for the same
period (Figure 12.3 B). Of the a.i.(s) imported by Costa Rica between 1995 and
1997, 17 constituted 80 percent of the total quantity of pesticides imported (Table
12.3).
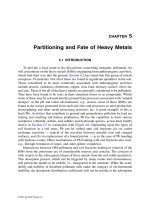
A comparison of the biocide groups imported during the periods 1977 to 1979,
1985 to 1987, and 1995 to 1997 is shown in Figure 12.4. During the 1970s,
© 2003 Milton D. Taylor, Stephen J. Klaine, Fernando P. Carvalho, Damia Barcelo and Jan Everaarts
The use of pesticides in Costa Rica 345
Table 12.2 The 25 most imported pesticides in Costa from 1985–97
a
Pesticide Tons
b
% of total
∑
% Pesticide Tons
b
% of total
∑
%
mancozeb 27,265.8 20.3 20.3 Aldicarb 2,767.6 2.1 68.5
2,4-D 8,509.9 6.3 26.6 Carbaryl 2,562.3 1.9 70.4
Glyphosate 6,472.3 4.8 31.4 Foxim (phoxim) 2,456.7 1.8 72.2
Chlorothalonil 5,925.5 4.4 35.8 Diuron 1,710.0 1.2 73.5
Ethoprophos 5,847.2 4.3 40.2 2,4-D + Picloram 1,355.7 1.0 74.5
Paraquat 5,530.0 4.1 44.3 Maneb 1,310.8 1.0 75.5
Terbufos 5,136.7 3.8 48.1 Oxamyl 1,205.8 0.9 76.4
Cadusafos 4,736.7 3.5 51.6 Terbutryn 1,168.5 0.9 77.2
Methyl bromide 4,698.1 3.5 55.1 Methamidophos 1,149.4 0.8 78.1
Carbofuran 4,515.7 3.4 58.4 Pendimethalin 1,142.0 0.8 78.9
Propanil 4,319.6 3.2 61.7 Terbuthylazine 1,136.2 0.8 79.8
Tridemorph 3,380.3 2.5 64.2 Propiconazole 1,091.5 0.8 80.6
Fenamiphos 3,040.6 2.3 66.4
Total imports 134,545.2 100.0
Notes:
a Source: adapted from IRET database.
b Includes only formulated products; except for 2,4-D + picloram, the a.i.(s) in mixtures are not included.
© 2003 Milton D. Taylor, Stephen J. Klaine, Fernando P. Carvalho, Damia Barcelo and Jan Everaarts
346 Elba M. de la Cruz and Luisa E. Castillo
herbicides (35.3 percent), insecticides plus nematicides (30.1 percent), and fungicides
(22.8 percent) were the most imported biocide groups. The later two periods differ
from the 1977 to 1979 period, but were similar to each other. In them, the most
imported biocide groups were the fungicides (45.9 percent and 47.1 percent,
respectively), followed by the herbicides (28.0 percent and 26.5 percent,
respectively), and the insecticides plus nematicides (23.1 percent and 16.3 percent,
respectively). In the 1995 to 1997 period, fumigants, e.g. methyl bromide, constituted
10 percent of total pesticide imports. Generally, fungicides, herbicides, and
Figure 12.3 Tonnes of pesticide a.i.(s) imported by Costa Rica from 1992–97 and the cost
of pesticide a.i.(s) imported from 1992–97 (adapted from Castillo, 1997; de
la Cruz et al., 1998; IRET, database)
B. Cost of pesticides
0
20
40
60
80
100
120
140
1992 1993 1994 1995 1996 1997
Cost of pesticides (US$M)
A. Quantity of pesticides imported
0
1,000
2,000
3,000
4,000
5,000
6,000
7,000
8,000
9,000
10,000
1992 1993 1994 1995 1996 1997
Tonnes a.i. imported
© 2003 Milton D. Taylor, Stephen J. Klaine, Fernando P. Carvalho, Damia Barcelo and Jan Everaarts
The use of pesticides in Costa Rica 347
Table 12.3 Major pesticide a.i. imported from 1995–97 in Costa Rica
a
a.i. Chemical family Biocide action
b
Imported (T) Cumulative (T) Cumulative %
Mancozeb dithiocarbamate fungicide 5,702.9 5,702.9 25.8
Methyl bromide halogenated aliphatic fumigant 2,168.3 7,871.2 35.6
2,4-D phenoxyacetic acid herbicide 1,973.4 9,844.6 44.5
Glyphosate organophosphorus herbicide 1,414.7 11,259.3 50.9
Chlorothalonil chlorobenzonitrile fungicide 1,223.2 12,482.5 56.4
Tridemorph morfoline fungicide 1,082.1 13,564.5 61.3
Terbufos organothiophosphate ins/nem 965.0 14,529.6 65.6
Paraquat quaternary ammonium herbicide 483.5 15,013.1 67.8
Propanil anilide herbicide 473.9 15,487.0 70.0
Ethoprophos organothiophosphate ins/nem
339.7 15,826.7 71.5
Cupric inorganic ins/acar 333.5 16,160.2 73.0
Methamidophos phosphoramidothioate ins/nem
315.1 16,475.3 74.4
Cadusafos organothiophosphate ins/nem 271.2 16,746.5 75.6
Diuron phenylurea herbicide 262.0 17,008.5 76.8
Propineb dithiocarbamate fungicide 261.1 17,269.6 78.0
Carbofuran benzofuranyl methylcarbamate ins/nem/acar 249.0 17,518.6 79.1
Terbuthylazine chlorotriazine herbicide 204.4 17,723.0 80.0
Total 90% a.i.
19,991.8
Total 100% a.i.
22,134.9
Notes:
a Source: adapted from IRET database and de la Cruz
et al.
, 1998.
b Biocide abbreviations indicate: ins. for insecticides; acar. for acaricides; and nem. for nematicides.
© 2003 Milton D. Taylor, Stephen J. Klaine, Fernando P. Carvalho, Damia Barcelo and Jan Everaarts
348 Elba M. de la Cruz and Luisa E. Castillo
insecticides plus nematicides comprised about 91 percent of the pesticide a.i.(s)
imported during these three periods.
Pesticide use
Pesticides are primarily employed in Costa Rica in agricultural activities and to a
lesser degree in other activities such as forestry, husbandry, and public health. For
many crops, pesticides are the primary method of pest control practiced. The
number of kg of pesticide a.i.(s) imported per ha of cultivated area increased from
12.8 kg a.i. ha
–1
in 1992 to 20.5 kg a.i. ha
–1
in 1997 (Chaverri and Blanco, 1995; de
la Cruz, 1998) and is similar to the value reported for the Netherlands in 1991 (20
kg a.i. ha
–1
) (Teunissen-Ordelman and Scrap, 1997) but higher than that of Japan
(10 kg a.i. ha
–1
) (WHO, 1990). The quantity of formulated products increased
from 29.5 kg ha
–1
in 1992 to 41.3 kg ha
–1
in 1997 (Table 12.4). Wesseling and
Castillo (1989) and Chaverri and Blanco (1995) calculated that the total quantity
of formulated pesticide products used per person in Costa Rica was equal to 4 kg,
but by 1997, this figure had increased to almost 5.3 kg (approximately 2.6 kg a.i.
per person) (Table 12.4).
By 1950, banana (about 30,000 ha), coffee (49,000 ha), and sugarcane (22,700
ha) were being planted as monocultures in Costa Rica and some insects, nematodes,
diseases, and vertebrates had been designated as pests (Costa Rica, 1953; Araya,
1982). The intensive use of pesticides probably started at this time (Hilje et al.,
1989). By 1950 the chemical industry was already established in Costa Rica and
was involved in pesticide production, formulation, and marketing. Before 1950,
there were six established commercial pesticide companies and, between 1950
and 1960, 19 new companies were established. By 1983, there were 160 commercial
pesticide companies in Costa Rica, not including small retailers (Hilje et al., 1992).
The introduction of some exotic pests and the proliferation of other native species
as pests also occurred after 1950 and led to the increased use of synthetic pesticides
(Hilje et al., 1989; 1992).
22.8%
35.3%
30.1%
11.9%
45.9%
28.0%
23.1%
3.0%
47.1%
26.5%
16.3%
10.1%
fungicides
herbicides
ins/nem
other
1977–79
1985–87
1995–97
Figure 12.4 Biocides by class imported by Costa Rica during: 1977–79, 1985–87, and
1995–97 (adapted from Castillo et al., 1989, Hilje et al., 1992; de la Cruz et
al.,1998; IRET, database)
© 2003 Milton D. Taylor, Stephen J. Klaine, Fernando P. Carvalho, Damia Barcelo and Jan Everaarts
The use of pesticides in Costa Rica 349
In the mid-1990s, the major crops grown in Costa Rica, based on both area
cultivated and total production, included banana (52,165 ha), coffee (108,000 ha),
rice (44,112 ha), vegetables (14,134 ha), fruits (51,043 ha), ornamentals (4,600 ha),
root crops (13,253 ha), sugarcane (43,000 ha), other grains (74,556 ha), and
pasturage (1,565,076.3 ha) (SEPSA, 1995; MAG, 1997). The geographic distri-
bution of these crops is shown in Figure 12.5. Crops such as banana, rice, sugarcane,
other grains, and some fruits are grown near coastal areas and consequently their
agricultural practices may influence coastal ecosystems. Banana production requires
more pesticide use per hectare (about 45 kg a.i. ha
–1
) than any other Costa Rican
crop, followed by fruits and vegetables (20 kg of a.i. ha
–1
), and rice (10 kg a.i. ha
–1
)
while pasturage requires the lowest input of pesticides (0.25 kg a.i. ha
–1
) (Table
12.5). Coffee production, which utilizes the greatest amount of land area, requires
6.5 kg a.i. ha
–1
(Castillo et al., 1997). From 1995 to 1997, almost 24 percent of total
a.i. imports was directly related to banana production (Table 12.6).
Table 12.7 summarizes the various production stages; biocide functions, e.g.
weed control, seed treatment, and insect control; formulation types; expected
environmental transport mechanisms; type of pollutants; and potential ecosystems
exposed for banana, root crops, date and oil palm, coffee, rice, sugarcane, and
ornamental plant plantations (data compiled from field observations; Cortés, 1994;
Subirós, 1995). Pesticides used in these agricultural activities influence coastal areas
primarily through the extent of area cultivated for crops located near a coastal
zone; number of pesticide application per crop; proximity of aquatic ecosystems
to fields where pesticides are applied; direct application to aquatic ecosystems,
either incidentally or from other practices; toxicity of the products used; intensity
of precipitation periods characteristic of some Costa Rican regions, e.g. the Atlantic
coastal zone receives >4,000 mm of rainfall annually, and the rainfall’s temporal
proximity to the pesticide application; and pesticide application technique. Aerial
applications have a greater potential for wind drift – compared to manual
applications – and can result in pollutants being carried away from target areas.
Table 12.4 Total cultivated area (ha), quantity of a.i. and formulated pesticides utilized per
ha (in kg), and quantity of a.i. (in kg) per person imported by Costa Rica from 1992–97
Year 1992 1993 1994 1995 1996 1997
hectares of cultivated
land (M) 441.8 445.7 441.6 446.9 418.8 438.1
kg of a.i. per hectare 12.8 12.4 15.4 13.2 17.3 20.5
kg formulated pesticide
per ha 29.5 28.1 31.7 30.9 34.6 41.3
kg formulated pesticide
per person 4.2 4.0 4.3 4.2 4.3 5.3
kg a.i. per person 1.8 1.7 2.1 1.8 2.2 2.6
Source: Adapted from SEPSA, 1998; Chaverri and Blanco, 1995; de la Cruz
et al.
, 1998; Costa
Rica, 1999; IRET database.
© 2003 Milton D. Taylor, Stephen J. Klaine, Fernando P. Carvalho, Damia Barcelo and Jan Everaarts
350 Elba M. de la Cruz and Luisa E. Castillo
Table 12.6 Quantity of pesticide a.i. (T) imported during 1995–97 by Costa Rica (CR), the Punta Morales formulating plant (PM), and by
companies directly related to banana cultivation (BC)
a
Year Costa Rica % by CR
b
Punta Morales formulating plant % by PM Banana companies % by BC
1995 5,899.1 25.8 316.1 5.3 1,423.8 24.1
1996 7,263.6 35.0 639.2 8.8 1,747.1 24.0
1997 8,971.9 39.2 1,309.4 14.6 2,060.2 23.0
Total 22,135.5 100.0 2,264.6 10.2 5,231.1 23.6
Notes:
a Source: adapted from IRET database; de la Cruz
et al.
, 1998.
b Indicates the percent of total pesticide imports by Costa Rica for the years 1995–97.
Table 12.5 Number of hectares cultivated for major crops harvested in Costa Rica, per ha pesticide a.i. use for each crop, and total quant
ity of
a.i.(s) used per crop
Crop
Banana Vegetable/fruits Rice Other grains Coffee Sugar cane Pastures
ha x 1,000 52.1 65.2 44.1 74.6 108.0 43.0 1,565.1
kg a.i. ha
–1
45 20 10 7.5 6.5 3.5 0.25
T a.i. 2,347 1,303 441 559 702 150 391
Source: adapted from SEPSA, 1995; Castillo
et al.,
1997; MAG, 1997.
© 2003 Milton D. Taylor, Stephen J. Klaine, Fernando P. Carvalho, Damia Barcelo and Jan Everaarts
The use of pesticides in Costa Rica 351
Additionally pesticides applied directly to plants and soils are subject to runoff
and erosion forces, which may carry these pollutants through overflow or plantation
drainage systems, into river systems, and eventually into estuarine and marine
ecosystems.
Information on pesticide use in other business activities, e.g. aquaculture and
salt production, is sparse. However, toxic compounds are used in these types of
activities to control algae populations and to prevent boring organisms from
damaging walls of shrimp ponds or water retention ponds (used for salt production).
Other uses of pesticides and pollution sources
About 10 percent of the a.i.(s) entering Costa Rica during the 1990s were imported
by a single pesticide formulating plant located in the vicinity of the Nicoya Gulf
on the Pacific Coast (Figure 12.1). Their imports in 1995 made up 5.3 percent of
total imports, equivalent to 316.1 T a.i. and this increased to 14.6 percent of total
pesticide imports in 1997, corresponding to 1,309.4 T (Table 12.6).
Figure 12.5 Extension (ha × 1,000) and regional distribution of major crop production in
Costa Rica
© 2003 Milton D. Taylor, Stephen J. Klaine, Fernando P. Carvalho, Damia Barcelo and Jan Everaarts
352 Elba M. de la Cruz and Luisa E. Castillo
Table 12.7 Adverse environmental impacts associated with crop production cycles,
emissions, and ecosystem exposure associated with the crop production life cycle
a
Production stage/ Environmental Pollution Exposed
Biocide action transport source ecosystems
BANANA
On the plantation aerial drift non-point takes place in lowlands
control of weeds erosion at the lower end of the
fungicides (aerial) runoff watershed near
nematicides leaching coastal areas
herbicides
insecticides evaporation from non-point
(impregnated bags) and contact with
plastic bags
Packing facilities effluents point
water from washing
process
post-harvest
application
Pesticide storage –
b
point fresh waters
facilities coastal waters
cellar, mixture terrestrial and
preparations ground waters
Aerial application runoff, erosion non-point
facilities aerial drift
mixture preparation,
tank cleaning, storage,
wastes
ROOT CROPS
Seed preparation aerial drift point some root crops are
(nematicides, planted near coastal
fungicides) areas
On the plantation aerial drift non-point
weed control: runoff, erosion
pre-emergent
herbicides
insecticides
Packing facilities effluents point fresh waters
water from washing coastal waters
process terrestrial and
post-harvest fungicide ground waters
application
Pesticide storage – point
facilities
cellars, mixture
preparation
DATE AND OIL PALM
Pre-planting aerial drift point occurs in lowlands at
seeds: fungicides runoff, erosion lower end of watershed
weeds: herbicides near coastal areas
continued…
© 2003 Milton D. Taylor, Stephen J. Klaine, Fernando P. Carvalho, Damia Barcelo and Jan Everaarts
The use of pesticides in Costa Rica 353
Table 12.7 continued
Production stage/ Environmental Pollution Exposed
Biocide action transport source ecosystems
On the plantation aerial drift non-point fresh waters
herbicides runoff, erosion coastal waters
insecticides terrestrial and
ground waters
Packing facilities effluents point
fungicides
ORNAMENTAL AND FLOWER PRODUCTION
On the plantation aerial drift non-point occurs in the upper,
herbicides, runoff, erosion middle, and lower
insecticides parts of watersheds
fungicides, in all regions of the
acaricides country
nematicides, may influence coastal
molluscicides areas
Pesticide storage – point fresh waters
facilities coastal waters
cellar, mixture terrestrial and
preparations ground waters
RICE
Seed preparation aerial drift point takes place in lowlands
insecticides at lower end of
watershed near coastal
areas
Pre-planting runoff, erosion non-point
weed control:
herbicides
soil insects:
insecticides
Post-planting aerial drift non-point
soil and stem insects: runoff, erosion
insecticides
Pre-emergence aerial drift non-point fresh waters
and runoff, erosion coastal waters
Post-emergence terrestrial and
herbicides ground waters
soil and foliar insets:
insecticides
Blooming aerial drift non-point
foliar and spike runoff, erosion
insects: insecticides
diseases: fungicides
Pesticide storage – point
facilities
cellar, mixture
preparations
continued…
© 2003 Milton D. Taylor, Stephen J. Klaine, Fernando P. Carvalho, Damia Barcelo and Jan Everaarts
354 Elba M. de la Cruz and Luisa E. Castillo
It is critical that environmental monitoring programs be established near
formulating plants to detect spill events; to reduce the response time for dealing
with accidental releases of toxic substances; and to protect natural ecosystems,
especially aquatic ecosystems, which are highly vulnerable to pesticide pollution.
Most pesticide a.i.(s) used in formulation plants are classified as extremely to highly
toxic to fish and crustaceans, e.g. mancozeb and chlorothalonil (Table 12.8). Most
of these chemicals are imported in large quantities and are handled as technical
grade materials. Degradation products or metabolites can be more toxic and
Table 12.7 continued
Production stage/ Environmental Pollution Exposed
Biocide action transport source ecosystems
SUGAR CANE
Seed treatment runoff, erosion point planted in the middle
fungicides and lower section of
watersheds
Pre-planting aerial drift non-point
land preparation: runoff, erosion
insecticides
weeds:herbicides
Post-planting aerial drift non-point
weeds: herbicides runoff, erosion
Ripening aerial drift non-point fresh waters
acceleration: runoff, erosion coastal waters
herbicides terrestrial and
ground waters
Production aerial drift non-point
fungicides, runoff, erosion
insecticides
biological control,
rodenticides
COFFEE
Pre-planting runoff, erosion cultivated in the upper
weeds: herbicides and middle sections of
watersheds, but rapid
river water flow may
carry pesticides used in
this crop to coastal
areas
On the plantation runoff, erosion fresh waters
weeds: herbicides aerial drift terrestrial and
insects: insecticides ground waters
diseases: fungicides
Notes:
a Source: adapted from Subirós, 1995; Cortés, 1994; and field inquires and observations by the
authors.
b En dash (–) indicates no information available.
© 2003 Milton D. Taylor, Stephen J. Klaine, Fernando P. Carvalho, Damia Barcelo and Jan Everaarts
The use of pesticides in Costa Rica 355
persistent than the parent compounds. Examples of this include chlorothalonil,
phorate, malathion, mancozeb (ETU), methyl parathion, ferbam, and terbufos
(UNA/IRET, 1999). Furthermore, available toxicity data are routinely obtained
from laboratory species used in temperate countries and primarily for the parent
compounds. These data account for the toxicity of primary and secondary
metabolites, but not for the sensitivity of local species to either the parent compound
or its metabolites. Special security measures at these facilities are needed to prevent
accidental releases with subsequent damage to ecosystems. Environmental moni-
toring programs are quite useful for evaluating the impact of any accidental release
and should be implemented. The proximity of a major pesticide formulator to the
Nicoya Gulf, which is an important economic and recreational ecosystem for Costa
Table 12.8 Pesticides imported by a formulation plant located on the Nicoya Gulf
(northwestern Pacific Coast of Costa Rica) and their aquatic toxicity to laboratory
organisms
a
a.i. Purity or grade
b
Quantity LC
50
(96 hour) LC
50
(24–48 hour)
(%) (T) fish
c
crustaceans
d
2,4-D technical grade 168.1 high
e
–
f
Benomyl 90–97 7.9 extreme extreme
Captan 90 18.9 extreme high
Carbendazim 90–99 43.5 extreme extreme
Chlorothalonil 96–98 21.5 extreme extreme
Phorate 85 30.8 extreme extreme (96)
Isazofos 95 72.0 extreme extreme
Malathion 96 36.7 extreme extreme
Mancozeb 33–90 455.4 extreme extreme
MCPA 98–99 7.9 moderate light
Methamidophos 60–75 90.4 moderate extreme
Methyl parathion 75–85 6.9 high extreme
Propanil 95 119.5 high high
Propiconazole 88 69.3 moderate moderate to high
Tridemorph 75–84 751.8 high high
Glyphosate 55–95 38.7 moderate light
Ferbam 76–90 31.8 – –
Paraquat 42 76.8 moderate high
Pendimethalin 90 42.0 extreme extreme
Terbufos 85 123.0 extreme extreme
Other 5–100 51.7 – –
Notes:
a Source: adapted from Tomlin, 1997; UNA/IRET, 1999.
b Technical grade pesticides are pesticide chemicals in a pure form (usually 95–100 percent a.i.),
which are then formulated into pesticide products, e.g. wettable powders, dusts, emulsifiable
concentrates, granules, etc.
c Rainbow trout.
d
Daphnia
sp.
e Toxicity classification in mg L
–1
: extreme (<1), high (1–10), moderate (10–100), and light
(>100).
f En dash (–) indicates no information available.
© 2003 Milton D. Taylor, Stephen J. Klaine, Fernando P. Carvalho, Damia Barcelo and Jan Everaarts
356 Elba M. de la Cruz and Luisa E. Castillo
Rica, provides ample reason for maintaining an environmental monitoring program
in this vicinity.
ENVIRONMENTAL RESIDUE STUDIES
Most studies of Costa Rican aquatic ecosystems in coastal areas conducted
before1998 focused on chemical residues, emphasizing OC residues (Table 12.9).
We have identified 16 such studies in the literature, though there may be other
unpublished studies for which we do not have data. Of these, seven studies are
from the Pacific region and nine from the Caribbean Coast. The first pesticide
residue study (1983 to 1984 on the Pacific Coast) examined near-shore aquatic
ecosystem impacts of OC pesticides to eggs of eight species of aquatic birds
(Hidalgo, 1986). The next (1987 to 1988) examined samples of water, sediment,
and biota from areas of the Caribbean Coast influenced by banana plantation
pesticide applications (von Düszeln, 1988).
Samples of larvae of the aquatic mayfly Euthyplocia hecuba Hagen (Ephemer-
optera: Polymitarcyidae) collected from streams in the upper reached of Rio
Tempisquito on the western slopes of Volcán Orosí and Cerro Cacao, which are
in the Parque Nationale de Guanacaste in northern Costa Rica, had quantifiable
levels of eight OC pesticides – levels of DDT, endrin, α-HCH, and γ-HCH were
below detection limits (Standley and Sweeney, 1995). Mayflies are especially useful
as indications of aquatic contamination because their larvae bioconcentrate the
lipophilic OC pesticides, which are often too dilute in the stream water to detect.
Their larvae can thus give a representation of material deposited into and
transferred through a stream’s catchment basin. It does not, however, reflect the
total deposition in the basin because natural filtration occurs throughout the
catchment. Larval contaminant loading will reflect the processes occurring
including physico-chemical properties of the pesticides, loss mechanisms including
microbial degradation and volatilization, and processing by the aquatic organisms
including bioaccumulation, metabolism, and biomagnification. OC pesticides found
(all units are in ng g
–1
ww) in mayfly larval tissues included heptachlor epoxide
(37), α-endosulfan (51), aldrin (54), DDE (67), dieldrin (100), β-endosulfan (150),
endrin aldehyde (150), and endosulfan sulfate (2,000) (Standley and Sweeney, 1995).
AQUATIC ECOSYSTEM IMPACTS
The high diversity of the Costa Rican terrestrial (50,660 km
2
), aquatic (440 km
2
),
and marine ecosystems (520,000 km
2
) results in a highly diverse flora and fauna –
many of which remain undescribed. It is believed that regions with extremely high
biodiversity such as Costa Rica are preserves of germplasm diversity for future
generations. With the rate of environmental destruction increasing, universities
and research centers must strive to protect those ecosystems that are still unaffected,
© 2003 Milton D. Taylor, Stephen J. Klaine, Fernando P. Carvalho, Damia Barcelo and Jan Everaarts
The use of pesticides in Costa Rica 357
Table 12.9 Summary of pesticide studies in aquatic ecosystems near shore in Costa Rica (only the maximum concentrations measured are shown
)
Year/location Substrates Pesticide class Results Remarks
1983–84 Marine biota: eggs of eight species OC In biota: A positive correlation between
Nicoya Gulf (Pacific) of aquatic birds (n = 34) OC: 4.16 mg kg
–1
fw eggshell thinning and DDE
p,p´-DDE: 3.19 mg kg
–1
fw levels in birds was found.
1987–88 Freshwater streams in surface waters OC Water: OC and OP pesticides were
banana production area sediments OP chlorothalonil: 11 µg L
–1
detected in few water
Arenal Lake and tributaries biota paraquat chlorpyrifos: 0.18 µg L
–1
samples.
(Caribbean)
paraquat: 5.6 µg L
–1
In biota:
OC: 58.3 mg kg
–1
fw
1989 Marine sediment form shallow OP Sediments: Sampling area was influenced
(coastal Caribbean) coastal waters chlorpyrifos: 34 µg kg
–1
dw by drainage from banana
parathion: 12 µg kg
–1
dw plantations.
1988–91 Marine biota: Anadara tuberculosa OC In biota: Anadara tuberculosa can be
Nicoya Gulf (estuarine)
DDT: 134 µg kg
–1
dw used as bioindicator in
Pacific
chlordane: 119 µg kg
–1
dw mangrove ecosystems. OC
lindane: 706 µg kg
–1
dw concentrations are higher in
heptachlor: 29.9 µg kg
–1
dw rainy season. Positive
mirex: 2.28 µg kg
–1
dw correlation between OC levels
and lipid content. Positive
correlation between OC levels
and PCB content.
1991 Marine (coastal) biota: several bivalve OC In biota: OC levels were below national
Pacific and Caribbean species DDT: 199.5 µg kg
–1
dw or international recommended
chlordane: 16.0 µg kg
–1
dw action limits for human
BHC: 2.82 µg kg
–1
dw consumption.
lindane: 4.2 µg kg
–1
dw
heptachlor: 1.75 µg kg
–1
dw
continued…
© 2003 Milton D. Taylor, Stephen J. Klaine, Fernando P. Carvalho, Damia Barcelo and Jan Everaarts
358 Elba M. de la Cruz and Luisa E. Castillo
Table 12.9 continued
Year/location Substrates Pesticide class Results Remarks
aldrin: 1.76 mg kg
–1
dw
dieldrin: 4.73 µg kg
–1
dw
endrin: 1.29 µg kg
–1
dw
mirex: 0.85 µg kg
–1
dw
1992 Freshwater drainage surface water various Water: Chlorothalonil and
channels, streams, river in sediment pesticides chlorothalonil: 8 µg L
–1
chlorpyrifos used in banana
banana plantation area biota: sea cucumber used
In sediment: production.
Marine-coral reef in banana chlorothalonil: 40 µgkg
–1
dw Limited number of
Caribbean plantations In biota: samples analyzed.
chlorpyrifos: 8 µg kg
–1
dw
1992 Freshwater drainage water various Water: Preliminary results of
channels, streams, rivers in sediments pesticides chlorothalonil: 0.9 µg L
–1
ongoing integrated study.
banana plantations biota fish and used propiconazole: 2.2 µg L
–1
Highest concentrations
Caribbean invertebrates in banana thiabendazole: 66.0 µg L
–1
found in samples from
production drainage channels.
1992 Freshwater drainage water various Water: Preliminary results of
channels and stream in rice sediments pesticides used propanil: 5.1 µg L
–1
ongoing integrated study.
paddy area biota: fish and in rice cypermethrin: 6.6 µg L
–1
Pacific invertebrates production oxadiazon: 0.6 µg L
–1
edifenphos: 0.7 µg L
–1
quinclorac: 790 µg L
–1
methamidophos: 82 µg L
–1
1993–96 Freshwater drainage water various Water:
canals and streams, Suerte sediments pesticides used cadusafos 2 µg L
–1
River, and river junction with in banana propiconazole 3.6 µg L
–1
the Tortuguero Lagoon production thiabendazole 17 µg L
–1
imazalil 8.7 µg L
–1
carbofuran 6.2 µg L
–1
© 2003 Milton D. Taylor, Stephen J. Klaine, Fernando P. Carvalho, Damia Barcelo and Jan Everaarts
The use of pesticides in Costa Rica 359
Year/location Substrates Pesticide class Results Remarks
ametryn 1.7 µg L
–1
chlorpyrifos < 0.1 µg L
–1
In sediment:
cadusafos 16 µg kg
–1
dw
imazalil 446 µg kg
–1
dw
propiconazole 33 µg kg
–1
dw
thiabendazole 435 µg kg
–1
dw
1995–97 Freshwater rivers and water various Water: Cadusafos detected in coastal
coastal lagoons, marine river sediment pesticides used carbofuran: 6.27 µg L
–1
waters.
mouth, sea outlet, and coastal biota: fish, crabs, in banana propiconazole: 1.5 µg L
–1
Many of the sampling sites
waters shrimp, and bivalves production ethoprophos: 0.28 µg L
–1
are situated in protected
Caribbean
cadusafos: 0.07 µg L
–1
areas of the coastal zone at
diazinon: 0.31 µg L
–1
the lagoon system.
fenamiphos 0.40 µg L
–1
Frequently, multiple residues
Sediment: were present in the samples.
propiconazole: 19 µg kg
–1
dw
In biota:
DDE: 10 µg kg
–1
dw
1998 Freshwater Tempisque water various Water: Pesticide residues were
River and Nicoya Gulf Estuary sediment pesticides used ametryn: 0.13 µg L
–1
detected only in one sampling
Pacific biota: fish, crabs, in rice and day.
shrimp, bivalves, and technicals
gastropods imported to
formulate
1998 Freshwater drainage water OC and various Water: Samples from drainage
system Arenal-Tempisque sediment pesticides used DDT: 0.5 µg L
–1
systems had higher incidence
Pacific biota: invertebrates in rice lindane: 0.04 µg L
–1
of pesticides.
Table 12.9 continued
continued…
© 2003 Milton D. Taylor, Stephen J. Klaine, Fernando P. Carvalho, Damia Barcelo and Jan Everaarts
360 Elba M. de la Cruz and Luisa E. Castillo
Table 12.9 continued
Year/location Substrates Pesticide class Results Remarks
propanil: 0.8 µg L
–1
There was no relationship
chlorpyrifos: 0.2 µg L
–1
found between the season
In biota: and pesticide content.
aquatic bird’s eggs A relationship between the
OC: 78 mg kg
–1
fw type of crop and pesticides
Shrimp: present in soil was proposed.
HCB: 13 µg kg
–1
fw OC concentrations in bird’s
lindane: 23 µg kg
–1
fw eggs were lower than those
aldrin: 10 µg kg
–1
fw of Hidalgo, 1986.
heptachlor: 3 µg kg
–1
fw
chlordane: 7 µg kg
–1
fw
o,p + p,p-DDT: 25 µg kg
–1
fw
1998 Fresh water drainage water in rice paddies and Some pesticides
Water: Samples for phenoxyacetic
system Arenal -Tempisque sugar cane fields used in rice and ametryn: 1.0 µg L
–1
acids were not taken.
Pacific sugar cane
Source: adapted from Hidalgo, 1986; von Düszelen, 1988; Readman
et al.
, 1992; Abarca and Ruepert, 1992; Castillo
et al.
, 1994; de la Cruz, 1994; Farrington
and Tripp, 1994; Castillo
et al.
, 1995; Rodríguez, 1997; de la Cruz
et al.
, 1998; and Castillo
et al.
, 2000.
© 2003 Milton D. Taylor, Stephen J. Klaine, Fernando P. Carvalho, Damia Barcelo and Jan Everaarts
The use of pesticides in Costa Rica 361
assess the degree of damage in those ecosystems already degraded, and establish
preventive measures against future damage in those affected. Despite protection
of 19 percent of Costa Rica’s territorial area as biological preserves, these areas
are not immune from the extensive use of agrochemicals. Special attention must
focus on coastal and marine ecosystems because they receive and may be reservoirs
for contaminants. Costa Rica has about 1,300 km of coastline, influenced by 34
river basins, and most of it is not protected. Coastal areas are vital to the country’s
economy and are an integral part of the everyday life of Costa Ricans. The Nicoya
Gulf, located on the northwest Pacific coastline, and the Tortuguero lowland
lagoons, located on the northeast Caribbean coastline, are two of the most
important coastal areas (Figure 12.1).
Pacific coast
The Nicoya Gulf is, and has always been, a very important fishing ground and
thus it has a large influence on the Costa Rican economy. More than 11 percent of
Costa Rica’s population lives in its vicinity (Costa Rica, 1987) and an even higher
percentage utilizes the area for recreational and commercial purposes. The Nicoya
Gulf ’s productivity has decreased over time. In 1976, 90 percent of Costa Rica’s
fish catch came from this area (Phillips, 1983) but this has declined to 50 percent
even though fishermen have increased their fishing effort (Campos, 1987). The
decreasing fish populations were explained by Campos in terms of overfishing
and shifts in fishing areas but more comprehensive studies including fish population
dynamics, ecological change analysis, and pollutant loading in the Gulf are needed
to adequately explain the decline. Estuaries play a fundamental role in the life
cycle of many marine organisms. Estuaries and especially mangrove forest areas
within the estuaries are important nursery grounds for juveniles of many commer-
cial and non-commercial fish species, invertebrates, and aquatic birds (Jaccarini
and Martens, 1992). Early stages in the life cycle of a species are known to be the
most vulnerable to the influence of chemicals (Castillo, 1987). Nicoya Gulf ’s estuary
is a very important nursery ground for many species of crab, shrimp, fish, and
mollusk (de Vries et al., 1983a; 1983b; Dittel et al., 1985). The mangrove forests
coupled with islands located in the Gulf are the natural habitats of many marine
and terrestrial birds. They also provide a natural refuge for migratory bird species
during the Northern Hemisphere’s winter season (Smith and Stiles, 1979). Nicoya
Gulf provides many resources for Costa Rica and its pollutant load must be carefully
studied, monitored, and controlled. Regular monitoring programs for chemicals
used in the region are necessary and research to study cause and effect relationships
for contaminants must be conducted to evaluate the risk from contaminants to the
Gulf ’s populations and to the human population utilizing it. The proper use of
resources within a sustainable development management strategy will improve
the quality of life of both humans and other species inhabiting and sharing Nicoya
Gulf. Studies conducted on pesticide loads in different compartments of Pacific
Coast ecosystems are summarized in Table 12.9.
© 2003 Milton D. Taylor, Stephen J. Klaine, Fernando P. Carvalho, Damia Barcelo and Jan Everaarts
362 Elba M. de la Cruz and Luisa E. Castillo
The influence of rice and sugarcane production on coastal aquatic ecosystems
can be observed in Nicoya Gulf. Pesticides generally used on these crops, e.g.
propanil, quinclorac, cypermethrin, oxadiazon, and ametryn, have been reported
in surface water from the region (Table 12.9). Pesticide residues reported in biota
were primarily OCs, including aldrin, lindane, DDT and its metabolites, and the
OP chlorpyrifos (Figure 12.6) (Hidalgo, 1986; de la Cruz, 1994; Castillo et al.,
1995; de la Cruz et al., 1998; Osorio, 1998; Rodríguez, 1997).
Hidalgo (1986) reported the presence of OC residues in eggs of eight different
species of near-shore aquatic birds. Between 1983 and 1984, a total of 137 eggs
was collected on an island nesting site located in the estuary formed by the
Tempisque River and Nicoya Gulf. Residues of p,p´-DDE were found in all samples;
the highest concentration was found in eggs of wood stork Mycteria americana L.
(Ciconiiformes: Ciconiidae) and the lowest in eggs of white ibis Eudocimus albus L.
(Ciconiiformes: Threskiornithidae). Heptachlor epoxide, HCB, p,p´-DDT, and
endrin were present in a high percentage of the samples. For all except two species,
a strong correlation was found between shell thickness and p,p´-DDE residues. In
some eggs of M. americana having the highest DDE concentrations, the author
Figure 12.6 Pesticide residues (µg kg
–1
fw) reported for coastal and natural freshwater
biota of Costa Rica.
COSTA RICA
CARIBBEAN SEA
PACIFIC OCEAN
NICARAGUA
PANAMA
0 40 km
10°00’’ N
Nicaragua
Lake
Nicoya Gulf
Dulce Gulf
1988-1991
0
400
800
1987-1991
0
40
80
1994
0
10
1994
0
30
60
lindane aldrin
∑
DDT
p,p'DDT
chlorpyriphos
© 2003 Milton D. Taylor, Stephen J. Klaine, Fernando P. Carvalho, Damia Barcelo and Jan Everaarts