Radiation and Health - Chapter 9 pptx
Bạn đang xem bản rút gọn của tài liệu. Xem và tải ngay bản đầy đủ của tài liệu tại đây (1.21 MB, 25 trang )
Chapter 9
Nuclear Weapons and Reactor Accidents
Nuclear Bomb Tests
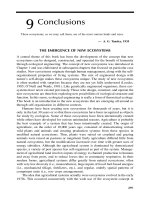
This chapter is concerned with radiation doses to the public from nuclear
weapons tests, as well as those resulting from nuclear reactor accidents that
have occurred over the years. Since the doses involved are mostly small (smal-
ler than the doses from natural radiation), it is extremely difficult to pinpoint the
health effects from these extra doses. This is a widely debated issue and will be
discussed in more detail in Chapters 11 and 12. Here we will concentrate on the
doses.
During the period from 1945 to 1981, 461 nuclear bomb tests were performed in
the atmosphere. The total energy in these tests has been calculated to be the
equivalent of about 550 megatons of TNT (TNT is the abbreviation for
trinitrotoluene). The bombs in Hiroshima and Nagasaki had a blasting power
of, respectively, 15 and 22 thousand tons of TNT. Nuclear tests were particularly
frequent in the two periods from 1954 to 1958 and 1961 to1962.
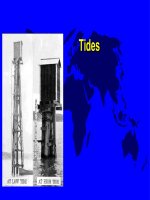
Several nuclear tests were performed in the lower atmosphere. When a blast
takes place in the atmosphere near the ground, large amounts of activation products
are formed from surface materials drawn up into the blast. The fallout is
particularly significant in the neighborhood of the test site. One of the best
known tests with significant fallout took place at the Bikini atoll in the Pacific in
1954 (see next page).
© 2003 Taylor & Francis
94 Radiation and Health
A bomb test in the Pacific
On March 1, 1954, the United States detonated a hydrogen bomb (with a power
of about 15 million tons of TNT) at the Bikini-atoll in the Pacific. The bomb was
placed in a boat in relatively shallow water. Considerable amounts of material
(such as coral) were sucked up into the fireball and large amounts of activation
products were formed.
A couple of hours after the blast, the
instruments on the American weather stat-
ion on Rongerik island (about 250 km
away) indicated a high radiation level.
The radiation increased rapidly and it was
decided to evacuate about 280 people
living on the neighboring islands; Rongelap,
Alingiae and Utirik. Because the fallout
for these islands was so large, the
inhabitants were not allowed to live there
for 3 years.
Approximately 130 km from the test-site
was the Japanese fishing boat Fukuru Maru
with 23 fishermen aboard. After the blast
they pulled in the fishing equipment and
sailed away. Approximately four hours
later, the fallout started in the area where the
boat had moved.
Dust, soot and even larger particles came
down. The crew lived with this for a
number of days and took no special
precautions with regard to hygiene, food,
and clothing since they had practically no
knowledge of radioactivity and its biological
effects.
The fishermen received very large doses,
about 2 to 6 Sv. They felt nauseous and
received skin burns from β-particles in the
fallout. One of the fishermen died within 6
months, but radiation was probably not
the cause of death. Most of the fishermen
were still alive 30 years later. Chromosome
analyses showed larger amounts of damage
than normal in their lymphocytes. The
importance of the damaged lymphocytes is
covered in Chapter 12.
Marshall
islands
Bikini atoll
Australia
Japan
© 2003 Taylor & Francis
95
Nuclear Weapons and Reactor Accidents
Because of the extreme temperature of a nuclear explosion, the radioactive
material becomes finely distributed in the atmosphere. A certain fraction is kept
in the troposphere (the lower 10 km) and is carried by the wind systems almost
at the same latitude as the explosion. This part of the radioactive release will
gradually fall out, the average time in the atmosphere being about one month.
The main fraction of the radioactive debris from an atmospheric test goes up into
the stratosphere (10 to 50 km).This can remain in the stratosphere for years
since there is a very slow exchange between the troposphere and the stratosphere.
The fallout consists of several hundred radioactive isotopes; however, only a
few give significant doses. The most important are listed below.
• Zirconium-95 (Zr-95) has a half-life of 64 days and iodine-131 (I-131) has
a half-life of 8 days. Both of these isotopes, in particular I-131, are of con-
cern for a short period (a few weeks) after being released to the atmosphere.
• Cesium-137 (Cs-137) has a half-life of 30 years. The decay scheme for this
isotope (Figure 2.4) shows that both β-particles and γ-rays are emitted. The
β-emmision has an impact on health when the isotope is in the body or on
the skin. The γ-radiation has an impact both as an internal and external
radiation source.
• Strontium-90 (Sr-90) has a half-life of 29.12 years. This isotope emits
only a β-particle and is difficult to observe (maximum energy of 0.54 MeV).
This isotope is a bone seeker and is important when the isotope enters the
body. It should be noted that Sr-90 has a radioactive decay product, Y-90,
which has a half-life of 64 hours and emits β-particles with a maximum
energy of 2.27 MeV. With this short half-life, it is likely that this amount of
β-energy will be deposited in the same location as those from Sr-90.
• Carbon-14 (C-14), while not a direct product of fission, is formed in the
atmosphere as an indirect product. The fission process releases neutrons
that interact with nitrogen in the atmosphere and, under the right conditions,
C-14 is formed as an activation product. The individual doses from this
isotope are extremely small. However, due to the long half-life of 5,730
years, it will persist for many years. When C-14 is used in archeological
dating, it is necessary to correct for the contribution from the nuclear tests.
© 2003 Taylor & Francis
96 Radiation and Health
Nuclear tests at Novaja Zemlja
in 1961 and 1962
In 1961 and 1962, a number of atmospheric nuclear tests took place at Novaja
Zemlja. The tests have been of great concern for people living in the northern
hemisphere, in particular, Scandinavia. The fallout, which was largely
determined by precipitation, was quite large on the western part of Norway as
illustrated below. The isotopes Cs-137 and Sr-90 then entered the food-chain via
grass (in particular reindeer lichen). Consequently, sheep, cows and reindeer
ingested radioactive material when feeding on grass and reindeer lichen. People
eating the meat or drinking the milk from these animals received some extra
radioactivity.
Many measurements were carried out in
order to determine the activity and types
of isotopes in the food products.
Mainly, scintillation counters were used
and the observations were concentrated
on the γ-radiation from Cs-137. It is far
more difficult to observe Sr-90 since it
only emits β-particles. Attempts were
made in particular experiments to measure
the ratio between Cs-137 and Sr-90. This
ratio was assumed to be rather constant
implying that the Cs-137 observations also
yielded information on Sr-90.
The Cs-137 activity in food products
(meat, milk, cheese, etc.) was measured.
Furthermore, whole - body measurements
were started. The latter were performed
using large scintillation crystals placed
above the stomach. It appeared that Cs-
137 entered the body and can be found in
all of us. A few examples are given in
Figures 9.2 and 9.3.
Novaja Zemlja
Russia
Scandinavia
© 2003 Taylor & Francis
97
Nuclear Weapons and Reactor Accidents
Nuclear Tests on Novaja Zemlja
The nuclear tests of most concern for the Northern Hemisphere were performed
by the former USSR (Russia) on the island Novaja Zemlja located in the Arc-
tic, approximately 1,000 km from northern Norway. When these islands were
chosen as a test site in 1954, more than 100 families lived there. They were all
removed from their homes. Altogether 87 atmospheric nuclear tests were per-
formed at this site. The activity was particularly large during 1961 and in the
fall of 1962. Most of the tests were performed at high altitudes, thus the “fireball”
did not reach the ground. Consequently, the production of activation products
was limited.
However, the radioactive debris from the tests was released into the atmosphere.
Calculations indicate that the atmospheric nuclear tests (including those from
United States, England, France and China) have yielded a total release of Cs-
137 of 1.0–1.4 million TBq (a TBq is 10
12
Bq), or approximately 30 million
Ci. The total release of Cs-137 from all the bomb tests is approximately 30
times larger than that released during the Chernobyl accident. The total release
of Sr-90 is calculated to be about 0.6 million TBq (approximately 75 times
larger than the Chernobyl accident).
As mentioned above, when a blast takes place in the atmosphere, a large fraction
of the radioactivity will go through the troposphere and into the stratosphere.
Since the exchange between the two is rather slow the radioactivity will remain
in the stratosphere for a long time. Westerly winds will bring the activity to the
east. The radioactivity from the nuclear tests in the 1960s was distributed over
large areas; however, the amount of fallout varied from one region to another
according to the variation in rainfall (most of the fallout came down with the
rain). The fallout pattern from the nuclear tests was different from that of the
Chernobyl accident, which was much more dependent on the wind directions
since the release itself was restricted to the troposphere.
From September 10 to November 4, 1961, the Soviets carried out 20 nuclear
tests at Novaja Zemlja. The power of the bombs varied from a few kilotons TNT
(equal in power to Hiroshima bomb) to approximately 58 megatons TNT, which
is probably the largest bomb ever detonated. The release of fission products to
the atmosphere was large and could be observed for long distances from the test
site. For example, in Oslo, Norway (about 2,000 km away), an increased level
of radioactivity in the air was observed (see Figure 9.1). These concentrations
of radioactivity were measured simply by drawing air through a filter. Radioactive
© 2003 Taylor & Francis
98 Radiation and Health
isotopes attached to dust particles in the air became absorbed on the filter (see
picture on page 99). The radioactivity on the filter was measured, and since the
air volume drawn through the filter was known, the activity could be calculated
in Bq per cubic meter.
As can be seen in Figure 9.1, the activity started to increase on September 14 (4
days after the first blast). In October, the air activity 2000 km away was
approximately 30 times larger than normal.
Similar measurements were performed in 1962. On November 7th, the air activity in
Oslo was about 200 times above normal, indicating that one of the bombs (classified
as middle power) which exploded on November 3 or 4, produced large quantities of
fission products.
Figure 9.1. The measurements presented here serve as an example of airborne
radioactivity in combination with nuclear tests in the atmosphere. The data
refer to the Russian nuclear tests on Novaja Zemlja in 1961. The measurements
were carried out about 2,000 km away from the test site. The activity is given in
Bq per cubic meter air.
Courtesy of Anders Storruste, Inst. of Physics, Univ. of Oslo
September October November December
Becquerel per cubicmeter
Activity in the air in
Scandinavia in 1961
0
0.1
0.2
0.3
© 2003 Taylor & Francis
99
Nuclear Weapons and Reactor Accidents
A radioactive filter
The radioactivity in the air
during the nuclear tests at
Novaja Zemlja in 1961 was
measured by sucking air
through a filter. The filter
itself was laid directly on an
x-ray film, and the white dots
indicate small particles
containing radioactive
isotopes. The filter to the left
is taken from an experiment
carried out 2,000 km from
the test site. The radioactivity
reached the area after 4 days.
The types of isotopes in the
filter were measured with a
scintillation counter.
Radioactivity in Food
In the years since the bomb tests in the atmosphere were canceled, the amount of
radioactive isotopes have continued to diminish. The fallout is dominated by the two
isotopes Cs-137 and Sr-90. The fallout has decreased considerably since the mid-
1960s but still, more than 30 years later, a small fallout persists from the bomb tests.
The radioactive isotopes hitting the ground become bound to plants, grass and, in
particular, reindeer lichen. The activity in this plant decreases more slowly than that
for plants withering in the fall.
The radioactive isotopes on the ground slowly diffuse into the soil. Some of them are
taken up in plants via the roots. Consequently, a certain fraction of the fallout will find
its way into the food chain and finally into humans. In addition to containing natural
radioactive isotopes, many food products will also contain a small contribution from
the fallout activity, mainly Cs-137. An interesting example of radioactivity in food is
given in Figure 9.2.
Courtesy of Anders Storruste,
Inst. of Physics, Univ. of Oslo
© 2003 Taylor & Francis
100 Radiation and Health
Figure 9.2. The content of Cs-137 in reindeer meat as well as in the people
who own the animals. The example is taken from northern Norway. The
activity is assumed to be evenly distributed in the body and is therefore given
as Bq/kg. The reason for the difference between women and men is presumably
the same as that for the content of K-40 (see Figure 7.3, page 71). Potassium
and cesium are in the same column of the Periodic table and may be distributed
in the body in the same way with a higher content when the muscle mass is
large relative to the total mass. The ecological half-life (see page 24) is about 6
years.
(Data courtesy of A. Westerlund, Norwegian Radiation Protection Authority)
This figure shows the activity of Cs-137 in reindeer meat. Many of the people
living in that area eat reindeer meat every day and, consequently, they have a
measurable content in their bodies. For a group of 20 people, the average
activity was measured using whole-body counters over a period of more than
20 years. The results are given in Figure 9.2.
As can be seen, the activity has decreased slowly since the tests in the atmosphere
ceased until the end of the period shown. After the Chernobyl accident in 1986
the activity increased due to new fallout.
Based on the results in Figure 9.2, it is possible to estimate the extra radiation
doses as well as the ecological half-life for this area. The observations can be
100
1000
Bq per kilo
Reindeer meat
Men
Women
t
1/2
= 6 years
© 2003 Taylor & Francis
101
Nuclear Weapons and Reactor Accidents
fitted reasonably well to a straight line in the plot, implying that the activity
decreases exponentially. The half-life is about 6 years for both the reindeer meat
as well as for the people.
Looking at other groups of people with a different diet, the amount of activity
due to the nuclear tests appears much smaller. In Figure 9.3 some data from
Sweden, observed by whole body measurements, are presented (R. Falk, Swe-
dish Radiation Protection Institute, SSI). A group of people from the Stockholm
area have been followed since 1959. The measurements, therefore, include the
effect of both the bomb tests of the 1960s and the Chernobyl accident in 1986.
Furthermore, two groups (farmers and non-farmers respectively) from Gävle
have been studied. Gävle is an area, north of Stockholm, which had the highest
fallout (approximately 85 kBq/m
2
) in Sweden from the Chernobyl accident.
Figure 9.3. The figure shows the results of total body measurements on diffe-
rent groups of people in Sweden.
(Data courtesy of R. Falk, Swedish Radiation Protection
Institute, SSI)
t
1/2
= 3.5 years
Atmospheric bomb tests
Chernobyl
t
1/2
= 6 years
Gä vle
Bq/kg
Farmers
Non farmers
© 2003 Taylor & Francis
102 Radiation and Health
Table 9.1. Cs-137 doses due to the atmospheric bomb tests and the
Chernobyl accident
As you can see, the total body activity for the Stockholm group reached a peak
in 1965 (about 13 Bq/kg), which is a factor of 30–50 smaller than that of the
Lapps (Figure 9.2). The data in Figure 9.3 can almost be fitted by straight lines
and consequently half-lives can be caluculated. These half-lives may be con-
sidered as ecological half-lives and some values are given on the figures.
The data presented in the two figures also yield opportunities to make a rough
calculation of the doses involved. Thus, we can estimate the dose obtained for
the peak year (1965 for the bomb tests and 1986 for the Chernobyl accident), as
well as the accumulated dose for the first 10 years (1965–1975 for the bomb
tests and 1986–1996 for Chernobyl fallout). The data for the groups in Figures
9.2 and 9.3 are given in Table 9.1.
The internal doses due to Cs-137 in the Lapps in northern Norway were among
the highest to any group of people and very much higher than that to other mem-
bers of the public. According to Figure 9.2, the Lapps had a whole-body activ-
ity in 1965 of approximately 600 Bq/kg for men and 300 for women correspond-
ing to an equivalent dose of 1.5 mSv for men and 0.7 mSv for women that year.
This extra dose in the peak year was approximately half that obtained by
commercial air crews every year. From the bomb tests over a 10 year period the
dose to the Lapplanders was approximately 8.8 mSv, whereas the dose to the
Stockholm group was about 0.14 mSv. The dose from the natural background
was about 30 mSv for the same period.
The dose figures for the Stockholm group would be equal to or larger than the
dose to the average person on the Northern hemisphere (see page 78).
puorG
stsetbmoBlybonrehC
esoD
raeykaep
esoD
sraey01revo
esoD
raeykaep
esoD
sraey01revo
srednalppaLvSm5.1vSm8.8
sremrafelväGvSm2.0vSm2.1
puorgmlohkcotSvSm30.0vSm41.0vSm30.0vSm81.0
© 2003 Taylor & Francis
103
Nuclear Weapons and Reactor Accidents
On the following pages we describe in more detail how
it is possible to calculate radiation doses from
radioactive isotopes in the body. The calculations are
not exact but give a good overview of the doses
involved. Those not interested can skip this section.
Cs-137
Radiation Doses from Cs-137 in the Body
The effects of nuclear bomb testing as well as the reactor accident in Chernobyl have
been discussed. Now we shall describe in some detail how the doses can be esti-
mated and then apply the calculation for the groups presented in figures 9.2 and 9.3.
A radiation dose is, by definition, the energy deposited
in the body. For radioactive isotopes we can estimate
the energy deposited when we use the decay scheme.
The decay scheme for Cs-137 is given in Figure 2.4.
For every disintegration both a β-particle and γ-
radiation are emitted. The energy given off into the body
consists of the following:
ββ
ββ
β-particles
The β-particles have a very short range in tissue and
will consequently be absorbed completely in the body.
The average β-energy (E
β
) is approximately 1/3 of the
maximum energy given in the decay scheme. The
following calculation is used (see also Figure 2.4):
E
β
= 1/3 (94.6 %
.
0.512 MeV + 5.4%
.
1.174 MeV)
= 0.183 MeV
γγ
γγ
γ-radiation
The γ-radiation will be partly absorbed in the body and partly escape from the body.
It is the part of the γ-radiation that escapes from the body that is used in the measure-
ments presented in Figures 9.2 and 9.3.
This means that the β-particles from Cs-137 deposit
about 0.18 MeV per disintegration.
© 2003 Taylor & Francis
104 Radiation and Health
Dose
The radiation dose is the energy deposited per unit mass, measured in J/kg. Cs-
137 is evenly distributed in the body, and the energy deposited per kg would be
the number of disintegrations multiplied by 0.5 MeV. If we assume that the body
burden is n Bq/kg and constant throughout a full year, the total number of
disintegrations (N) would be n times the number of seconds in a year:
The radiation dose is the product of the number of disintegrations and energy deposited
per disintegration (remember that 1 eV = 1.6
.
10
–19
J):
Since the radiation consists of γ-radiation and β-particles with a radiation weighting
factor of 1, the dose would be the same in Sv.
Returning to figures 9.2 and 9.3, we see that the Lapplanders in 1965 had a body
burden of 600 Bq/kg. The dose that year was, therefore, 1.5 mSv for men and about
half that value for women. The peak year doses for the other groups are given in
Table 9.1.
Accumulated doses
As seen from the curves in Figures 9.2 and 9.3, the activities, and therefore the
doses, decay exponentially. Since we roughly know the half-life, it is possible to
The γ-radiation from Cs-137 has an energy of 0.662 MeV. The radiation is absorbed
according to an exponential function. A layer of about 8 cm of soft tissue will stop half
of the radiation from Cs-137. The half-value layer in water and tissue for this γ-
energy is approximately 8 cm. A rough estimate is, therefore, that approximately half
of the γ-radiation from Cs-137 is deposited in the body (i.e. E
γ
is about 0.33
MeV per disintegration).
The total energy deposited in the body per disintegration is the sum of the ener-
gies from both the β-particle and the γ-radiation, 0.18 MeV plus 0.33 MeV, giving
Nn Bqkg nBqkg=⋅⋅⋅⋅ ≈ ⋅ ⋅60 60 24 365 315 10
7
/. /
Dn JkgnGy=⋅⋅⋅⋅⋅⋅ =⋅⋅
−−
315 10 0 5 10 1 6 10 2 52 10
7619 6
/.
E = E
β
+ E
γ
= 0.183 MeV + 0.33 MeV ≈ 0.5 MeV.
© 2003 Taylor & Francis
105
Nuclear Weapons and Reactor Accidents
estimate the total dose for 10 years. If the activity decays in a similar way, we
can calculate accumulated doses accordingly. The accumulated dose for 10 years
is found by the formula:
Here D
o
is the first year dose,
λ
= ln2/t where t is the half-life in years. Using
this formula, the doses presented in Table 9.1 are obtained. These are doses in
addition to the doses from natural sources. The background radiation dose for a
10 year period in Scandinavia and most of the world is around 30 mSv.
The Chernobyl Accident
The exact amount of radioactive isotopes released during the Chernobyl accident is
not known in detail. According to early reports, the release was approximately
as given in Table 9.2.
Table 9.2. The release of radioactive isotopes from the Chernobyl
accident. The amount given in TBq(10
12
Bq)
Summary Report on the Post-Accident, Safety Series No. 75,Vienna (1991)
Isotope Half-life Amount
(TBq)
Cs-134 2.06 years 19,000
Cs-137 30.0 years 38,000
I-131 8.04 days 260,000
Xe-133 5.3 days 1,700,000
Mo-99 2.8 days 110,000
Zr-95 64 days 140,000
Ru-103 39 days 120,000
Ru-106 368 days 60,000
Ba-140 12.7 days 160,000
Ce-141 32.5 days 100,000
Ce-144 284 days 90,000
Sr-89 50.5 days 80,000
Sr-90 29.2 years 8,000
∫
−λ−
−λ=⋅=
10
0
10
00
)1)(/( eDdteDD
t
total
© 2003 Taylor & Francis
106 Radiation and Health
Chernobyl is in the Ukraine, very near the border of Belarus. Approximately half of
the released activity fell out in the area around the reactor. All of the plutonium
and most of the strontium (Sr-89 and Sr-90) fallout was restricted to a region
within 30 km of the reactor. However, for the cesium isotopes Cs-134 and Cs-
137, the distribution was extensive. Belarus and the western parts of Russia
received most of the cesium fallout, but considerable amounts were transported
by the wind to western Europe.
During the first days after the accident, the wind direction was to the northwest
(towards Scandinavia). Considerable amounts of fission products were
transported to the middle regions of Sweden and Norway. Unfortunately, it was
raining in some of these areas and the fallout was consequently large. Thus, in parts of
Sweden (the area around Gävle, north of Stockholm) and in Norway the fallout
of Cs-137 reached up to 100 kBq/m
2
(about 3 Ci/km
2
). The average value,
however, was much smaller and on the order of 5 to 10 kBq/m
2
.
During the first days, I-131 was the most significant isotope. Due to the short
half-life of 8 days the activity decreased rapidly. As can be seen in Figure 6.4, this
isotope was easily observed during the first phase after the accident.
Radioactivity in Food
Outside the former USSR, the radiation doses due to the Chernobyl accident can
mainly be ascribed to the radioactivity in food products, in particular meat (from
sheep and reindeer). The activity was dominated by the two cesium isotopes.
Due to the short half-life of Cs-134 of 2 years, the activity decreased rapidly
during the first years. Shortly after the accident, the activity ratio between
Cs-134 and Cs-137 was approximately 1 : 2.
The average equivalent dose to people in Scandinavia was approximately 0.2
mSv the first year after the accident. About 2/3 of the dose was due to food
products, and about 1/3 was due to external γ-radiation.
The radioactivity from Chernobyl will gradually decrease and the extra doses to
the public will go down as the years pass. Figure 9.3 yields good information
on the body burden of Cs-137 for different groups in Sweden. The estimates
carried out indicate that the accumulated dose to people in Europe (for example
Table 9.1) will be about 1 mSv in 50 years. In the same period the doses from
natural background sources and medical use would be on the order of 200 mSv.
© 2003 Taylor & Francis
107
Nuclear Weapons and Reactor Accidents
Release of radioactivity from Chernobyl
The Chernobyl nuclear reactor accident took place on April 26, 1986. The
explosion and fire released a large amount of radioactive isotopes. The release
was significant in the first 10 days, as shown in the figure below.
Large amounts of radioactive isotopes were
released into the atmosphere. The isotopes
reached to an altitude of more than 2,000
meters. The compounds were then
transported by the wind. The map
demonstrates how the isotopes moved du-
ring the first days after the accident. The
wind direction was toward northwestern
Europe. Since it was raining at the same
time in Scandinavia, the fallout became
significant in some regions of Sweden and
Norway. Other countries, such as
Denmark, the Netherlands, Belgium,
France and England received small amounts
of activity.
The wind then turned South and countries
like Romania, Bulgaria, Greece and
Czechoslovakia had significant fallout during
the latter part of the accident. The fallout
of some isotopes, such as Sr-90 and
plutonium, was mainly restricted to regions
in the neighborhood of the reactor (within
30 km).
The fallout from the Chernobyl accident is
now well known and maps are available
which show the concentration (given as
Bq/m
2
or sometimes as Ci/km
2
) of the
different long-lived isotopes such as Cs-
137, Sr-90 and plutonium. It is, therefore,
possible to estimate annual doses as well
as lifetime doses for those living in the
area (examples are given above). It is,
however, more difficult to determine the
doses from the short-lived isotopes such
as I-131 as well as the acute doses to those
at Chernobyl fighting the fire and cleaning
the area.
The release during the first
days was transported by the
winds toward Scandinavia. The
figure to the right demonstrates
this transport.
Release of radioactive isotopes
The Chernobyl
region
April May
April
Courtesy of Norwegian Meteorological Inst.
© 2003 Taylor & Francis
108 Radiation and Health
Pollution Around Chernobyl
Most of the fallout was localized to the region in the neighborhood of the reactor.
During the accident, radioactive isotopes were both in the air and on the ground.
This resulted in a radiation level which made it necessary to evacuate about 130,000
people. The doses to these people are not known, but people in the countryside
(within 15 km of the reactor) received the largest doses.
During the first year after the accident more than 200,000 liquidators worked
on stopping the fire and cleaning the area. Some of these liquidators probably
received significant radiation doses.
In 1989, the Soviet Union started to release information about the geographical
distribution of radioactive isotopes. The information was not in agreement with
a number of "reports" describing how radiation from the accident had resulted
in poor public health. Some of these reports from the accident area were in disagreement
with our knowledge on the biological effects of radiation. In 1989, the government in
the former Soviet Union asked for international help to determine dose levels and
health effects.
In the spring of 1990, a group of experts formed the International Advisory
Committee with the purpose of studying the situation in the polluted regions of Ukraine,
Belarus and Russia. The committee would evaluate the data released by radiation
experts in the Soviet Union on pollution, doses and health effects.
The Committee consisted of a total of 200 experts from 23 nations with Itsuzo
Shigematsu from Japan as chairman. He has, for a number of years, been head
of the Radiation Effects Research Foundation in Hiroshima (they have worked
with those irradiated in Hiroshima and Nagasaki). Several international
organizations such as the World Health Organization (WHO), the International
Atomic Energy Agency (IAEA), the UN committee for food and farming (FAO),
the UN Scientific Committee on the Effects of Atomic Radiation (UNSCEAR),
the International Labor Organization (ILO) and the World Meteorological
Organization (WMO) were represented on the Committee. Laboratories in Aust-
ria, France and US took part in the analyses.
The organization made about 40 visits to the Soviet Union. This is one of the
most ambitious international projects ever carried out in the radiation field. The
report was released in May, 1991 (5 years after the accident). The conclusions
can be summarized as follows:
© 2003 Taylor & Francis
109
Nuclear Weapons and Reactor Accidents
• Radioactive pollution
The radioactivity in drinking water and food products, for the most part, were
considerably lower than the regulatory limits set by the Soviet authorities. Oc-
casionally the activity in some food products was found to be above this limit.
• Radiation doses
Estimates made by the Committee concluded that the extra lifetime equivalent
doses in the most polluted regions would be 80–160 mSv. The Soviet authorities
had a higher estimate of 150–400 mSv.
• Health situation in the polluted regions
The only serious health effect found among members of the public due to radiation
was an increase in the incidence of thyroid cancer (see below).
A number of local clinical examinations, which were not carefully administered, have
given confusing and contradictory results. It is evident that some people in the pol-
luted areas were suspicious and believed that they had sicknesses due to radiation
even though this was unlikely.
Children were usually in good health. Some children had low hemoglobin counts in
their blood, but no differences were found between polluted and clean areas.
Some people have claimed that their immune systems were weakened. Since
there is no exact parameter for the strength of the immune system, this is difficult
to evaluate. For example, if the number of lymphocytes in the circulation is used
as a measure for the immune system, the committee found no differences among
people living in polluted and clean areas. There is little evidence to indicate that
their immune systems had been weakened due to the accident.
The general cancer incidence in the area has increased in the last decade. This
tendency had been noted before the accident. Old reports about cancer are
incomplete and part of the increase may be due to improved diagnostic methods
and more numerous health checks. No clear increase in the incidence of leukemia
has been observed. However, there is a clear increase in the incidence of thyroid
cancer for children, which is ascribed to exposures to radioactive iodine during
the first period after the accident. Fourteen years after the accident the thyroid
cancers (altogether about 700 cases) seem to be the most important somatic
effect.
© 2003 Taylor & Francis
110 Radiation and Health
Pollution around Chernobyl
The Chernobyl reactor accident resulted in the radioactive pollution (mainly Cs-
137) of large areas in Ukraine, Belarus and Russia. The map indicates regions
polluted with Cs-137. The gray areas have a pollution of more than 37 kBq/m
2
.
Darker areas are more polluted. The border between the three countries is marked
with a dashed curve. The so-called 30 km zone is marked by the circle. Inside this
zone, there was additional pollution with Sr-90 and plutonium (see page 113).
The UN committee UNSCEAR has given
a rule of thumb for estimating accumulated
doses to people living in areas with Cs-
137 pollution. Thus, a pollution of 1 kBq/
m
2
will give an accumulated extra lifetime
dose of 0.16 mSv.
This means that the people living in the
gray areas for 50 years after the accident
must allow for an extra dose above natural
background.
Altogether about 825,000 people are living
in areas with a Cs-137 pollution of more
than 185 kBq/m
2
(i.e. 5 Ci/km
2
).
These people may expect an increased
lifetime equivalent dose (over 50 years) of
about 30 mSv – and more in the most
polluted areas. According to the rule of
thumb a pollution of about 30 Ci/km
2
(or
1,110 kBq/m
2
) would yield an extra dose
equivalent to the accumulated natural
background dose for 50 years.
It is necessary to take the natural dose into
consideration when the biological effects of
the Chernobyl accident are discussed.
Belarus
Russia
Chernobyl
Ukraine
Kiev
Minsk
Courtesy of the
International Chernobyl
Project. Assessment of
Radiological
Consequences and
Evaluation of Protective
Measures, 1991.
© 2003 Taylor & Francis
111
Nuclear Weapons and Reactor Accidents
Radiation-induced cancer has a long latent period. The onset of leukemia, for
example, does not reach a maximum until 5 to 7 years after exposure. For solid
tumors, the latent period is generally longer. Consequently, it is still too early
to arrive at firm conclusions regarding the increased incidence of cancer due to
the accident.
So far there is no statistical evidence that the radiation exposure has resulted in damage
to fetuses. According to current knowledge about radiation damage, it may be
difficult to observe cancer and genetic damage using epidemiological methods
(see Chapter 11).
Chernobyl Conclusions
Approximately 14 years after the accident we can make the following
observations:
1. The Chernobyl accident was the largest and most severe reactor accident
ever. The accident itself resulted in 31 acute casulties, 28 due to the acute
radiation syndrome.
2. Large areas were contaminated. People in the regions must live with Cs-137
and Sr-90 contamination for hundreds of years to come.
3. An increase of childhood thyroid cancer has been observed in the most
contaminated areas in Belarus, Ukraine and Russia. Since we have used I-131
for medical purposes without similar carcinogenic effect, it is a challenge to
extract more information about the radiation doses involved. Furthermore, it is a
challenge to understand other factors (biological and environmental) which may
influence the risk for radiation-induced cancer.
4. There is no evidence for other radiation-induced cancers in the three most
contaminated countries at this time. This is also a puzzle since, according to the
doses delivered and the risk models, approximately 500 additional leukemias were
expected. Further studies on selected populations, such as the liquidators, are
yielding more information. Since a large number of liquidators worked for a
longer time in the vicinity of the contamination, we may obtain information about
dose protraction, type of radiation and radiation-induced illnesses.
© 2003 Taylor & Francis
112 Radiation and Health
One goal in all these studies is to determine the radiation dose to the people
exposed. A possible approach is to study stable chromosome abnormalities such
as translocations in the lymphocytes taken from exposed individuals. The FISH
technique (Fluorescence In Situ Hybridization) offers a new way of examining
these abnormalities.
5. Psychological effects and mental disorders seem to be the most severe effect
of the Chernobyl reactor accident. It is a fact that a large amount of Post-Traumatic
Stress Disorders (PTSD) have appeared with symptoms such as depression,
hypochondriasis, headache, dizziness, fatigue or chronic tiredness, poor concentration,
anxiety, physical and mental exhaustion, feeling of hopelessness, and lack of libido.
6. For those exposed and/or living in contaminated areas, it has also been
observed that there is an increased incidence of high blood pressure, alcohol
abuse and even suicide. None of these syndromes are caused directly by radiation.
A consequence of the Chernobyl accident is that millions of people now suffer
from psychological effects. The accident has resulted in an increase in what is
known as “radiophobia”. This needs to be taken seriously. An understanding of
radiation and radioactivity combined with the dissemination of properly acquired
data will help reduce radiophobia. An important objective of this book is to
increase understanding and provide some of the relevant data.
We are of the opinion that knowledge about radioactivity, how to calculate
radiation doses, and how to compare doses from accidents with doses from
natural radiation, medical use and air-travel is of considerable value to the pu-
blic. Those who exaggerate the fear of radiation need to take responsibility for
increasing radiophobia and the damage spawned by radiophobia.
© 2003 Taylor & Francis
113
Nuclear Weapons and Reactor Accidents
Plutonium around Chernobyl
This is a map of the region around
Chernobyl. The reactor itself is in the
middle of the circle, which marks the
30 km zone. The reactor is in Ukraine
and the border between Ukraine and
Belarus (shown by a heavy curve) goes
through the 30 km zone.
The dark area on the map indicates plu-
tonium pollution to an extent of more
than 3.7 kBq/m
2
(0.1 Ci/km
2
).
The Sr-90 pollution is mainly restricted
to the same areas, but extends beyond
the 30 km zone. The pollution in this
zone is from 37 to more than 111 kBq/
m
2
. Doses from these isotopes would
be negligible.
1 Ci/km
2
= 37 kBq/m
2
The Cs-137 content in a living
sheep is measured. Measurements
on living animals or humans are
based on the
γ
-radiation emitted
(energy of 0.662 MeV). As
mentioned above, approximately
half of the
γ
-radiation emanates
from a human or animal and can
be recorded by an external detector.
(Courtesy of the International Chernobyl Project.
Assessment of Radiological Consequences and
Evaluation of Protective Measures, 1991.)
Courtesy of The Norwegian Department of Agriculture
© 2003 Taylor & Francis
114 Radiation and Health
Other Reactor Accidents
There were two other major reactor accidents before the one at Chernobyl. How-
ever, neither resulted in a significant release of radioactivity.
• Windscale
In October 1957, a fire started in one of the graphite moderated reactors in
Windscale, England (called Sellafield today). As reported by Crick and Linsley
in 1984, the accident resulted in the release of about 600 TBq I-131, 45 TBq Cs-
137 and 0.2 TBq Sr-90. The relatively large release of iodine caused some
concern and, the day after the accident, I-131 was found in milk. The medical
research council suggested that all milk with an activity above 3,700 Bq/l should
not be used. This restriction affected the milk from an area of about 500 km
2
.
The highest activity of 50,000 Bq/l was found in milk from a farm about 15 km
from the reactor. The iodine uptake by the thyroid gland was monitored and the
highest thyroid dose was calculated to be 160 mGy.
• Three Mile Island
A later and well-publicized accident happened on Three Mile Island near Harris-
burg, Pennsylvania, March 28, 1979. The cooling on a pressurized water reactor
(PWR) was lost, and parts of the reactor core melted down in the course of 6 to 7
hours before the reactor was covered with water. The reactor had a safety
container and only minor amounts of radioactivity were released. In fact, the
activity released was smaller than that normally released every year from the
natural radioactive sources in Badgastein, Austria, a source that some years ago
was considered to be healthy.
Because of some misunderstanding between the Nuclear Regulatory Commission
and the authorities, it was recommended that children and pregnant women,
living within 8 km from the reactor be evacuated. This recommendation, which
was quite unnecessary, had the unfortunate consequence of raising anxiety and
fear among the public.
© 2003 Taylor & Francis
O. T. Avery, C. M. MacLeod, and M. McCarty, Studies on the chemical nature
of the substance inducing transformation of pneumonococcal types; induction
of transformation by a deoxyribonucleic acid fraction isolated from pneumo-
coccus type III. J. Experimental Medicine 79, 137–158 (1944).
M. J. Crick and G. S. Linsley, An assessment of the radiobiological impact of
the Windscale reactor fire. Int. J. Radiation Biology 46, 479–506 (1984).
M. M. Elkind and H. Sutton, Radiation response of mammalian cells grown
in culture. Radiation Research 13, 556–593 (1960).
R.E. Franklin and R. G. Gosling, Molecular structure of deoxypentose nucleic
acids. Nature 171, 738–741 (1953).
S. Furberg, On the structure of nucleic acids. Acta Chem. Scand. 6, 634–640
(1952).
E. I. Hart and J. W. Boag, Absorption spectrum of the hydrated electron in
water and in aqueous solutions. J. Am. Chem. Soc. 84, 4090–4095 (1962).
T. Henriksen, Hydrogen atoms and solvated electrons in irradiated aqueous
solutions at 77 K. Radiation Research 23, 63–77 (1964).
A. D. Hershey and M. Chase, Independent functions of viral proteins and nucleic
acids in growth of bacteriophage. J. General Physiology 36, 39–56 (1952).
R. Livingston, H. Zeldes and E. H. Taylor, Paramagnetic resonance studies of
atomic hydrogen produced by ionizing radiation. Dis. Faraday Soc. 19, 166
(1955).
H. J. Muller, Artificial transmutation of the gene. Science 66, 84–87 (1927).
G. Olivieri, J. Bodycote and S. Wolf, Adaptive response of human lymphocytes
to low concentrations of radioactive thymidine. Science 223, 594 (1984).
H. Planel, J. P. Soleilhvoup, R. Tixador, G. Richoilley, A. Conter, F. Croute,
C. Caratero and Y. Gaubin, Influence on cell proliferation of background
radiation or exposure to very low, chronic gamma radiation. Health Physics
52, 571–578 (1987).
R. L. Platzman, Subexcitation electrons. Radiation Research 2, 1–7 (1955).
J. L. Redpath and R. J. Antoniono, Induction of an adaptive response against
spontaneous neoplastic transformation in vitro by low-dose gamma radiation.
Radiation Research 149, 517 (1998).
E. Sagstuen, H. Theisen and T. Henriksen, Dosemetry by ESR spectroscopy
following a radiation accident. Health Physics 45, 961–968 (1983).
A. C. Upton, The biological effects of low-level ionizing radiation. Scientific
American 246, 29 (1982).
J. D. Watson and F. H. Crick, Molecular structure of nucleic acids. Nature 171,
737–738 (1953).
References
© 2003 Taylor & Francis
Additional Reading
1. Radiation and Life, Eric J. Hall, Pergamon Press, 1984.
2. Environmental Radioactivity, Merril Eisenbud, Academic Press, 1987.
3. 1990 Recommendations of the International Commission on Radio-
logical Protection, ICRP Publication 60, Pergamon Press, 1991.
4. Annual Limits on Intake of Radionuclides by Workers Based on the 1990
Recommendations, ICRP Publication 61, Pergamon Press, 1991.
5. Radon and Its Decay Products in Indoor Air, Editors: W. W. Nazaroff and
A. V. Nero, John Wiley, 1988.
6. Radioisotopic Methods for Biological and Medical Research, Editor:
Herman W. Knoche, Oxford University Press, 1991.
7. Biological Radiation Effects, Editor: J. Kiefer, Springer-Verlag, 1990.
8. Sources, Effects, and Risks of Ionizing Radiation, UNSCEAR Report,
United Nations, New York, 1988.
9. Atoms, Radiation, and Radiation Protection, Editor: James E. Turner,
John Wiley and Sons, Inc. (second edition), 1995.
10. Radiation Biophysics, Editor: Edward L. Alpen, Academic Press (second
edition), 1997.
11. Basic Clinical Radiobiology, G. Gordon Steel, Arnold (second edition),
1997.
12. Radioactivity and Health – A History, J. Newell Standard, Office of
Scientifical and Technical Information, Battelle Memorial Institute, 1988.
13. A History of X-rays and Radium: with a Chapter on Radiation Units,
1895–1937, Richard F. Mould, ICP Building & Contract Journals Ltd.,
London, England, 1980.
14. History of Physics, Spencer R.Weart and Melba Phillips, American
Institute of Physics, New York, N.Y., 1985.
15. Health Effects of Low-level Radiation, Sohei Kondo, Atomic Energy
Research Institute, Kinki University, Kinki University Press, Osaka,
Japan Medical Physics Publishing, Madison, WI USA, 1993.
16. A Century of X-rays and Radioactivity in Medicine with Special
Reference to Photographs of the Early Years, Richard F. Mould, Institute
of Physics Publishing, Bristol, 1993.
17. Radiation Biology, Allison Casarett, Prentice-Hall Inc., Englewood Cliffs,
NJ, 1968.
18. The Children of the Atomic Bomb Survivors: A Genetic Study, J. V. Neel
and W. J. Schull, National Academy Press, Washington, D.C., 1991.
© 2003 Taylor & Francis
Additional Reading
220
19. The International Chernobyl Project. An Overview. IAEA, Vienna. ISBS
92-0-1291-0, 1991.
20. The International Chernobyl Project. Assessment of Radiological
Consequences and Evaluation of the Protective Measures. ISBN
92-0-129091-8. IAEA, Vienna, 1991.
21. IAEA-report: Summary Report on the Post-Accident, Safety Series
No. 75-INSAG-1.IAEA, Vienna, 1991.
22. Chernobyl Conclusions – International Conference on Radiation and
Health, Beer Sheva, Israel, 3.– 7. November 1996. Conference supported
by WHOand IAEA.
23. Chernobyl Record, Richard F. Mould, Institute of Physics Publishing,
Bristol, UK & Philadelphia, USA, 2000.
24. Chernobyl – The Real Story, Richard F. Mould, Pergamon Press, London,
1988.
© 2003 Taylor & Francis