Nanomaterials for Nanoscience and Nanotechnology part 3 potx
Bạn đang xem bản rút gọn của tài liệu. Xem và tải ngay bản đầy đủ của tài liệu tại đây (151.36 KB, 12 trang )
seen as a low-energy electron diffraction process, where the photelectron comes from
an energy-selected atomic element. Concerning nanostructured materials, many
authors have tackled the problem of determining the inter-atomic distances by
EXAFS [31±33]. This measurement is rather difficult to obtain in these systems by
other means, due to the intrinsic lack of long-range order in small particles. In the fol-
lowing sections we describe the basic process and the special features of EXAFS
experiments on nanoparticles, and illustrate these with a particular example.
2.4.2 EXAFS
In order to understand the physical origin of EXAFS oscillations, we must first
remember that the probability for a core electron to absorb an X-ray photon depends
on both the initial and final states. Above the edge, the final state can be described by
an outgoing spherical wave, originating at the absorbing atom. This wave may be scat-
tered by neighboring atoms, resulting in an interference pattern (see Fig. 2-6b). The
final state will depend on both (outgoing and scattered) wave phases, which in turn
will depend on the electron wavevector (k), or equivalently on the ejection energy.
Hence, the exact position of neighboring atoms can affect the probability of exciting a
core electron and gives rise to the oscillatory behavior of the absorption coefficient as
a function of photoelectron energy.
Mathematically, the interference term arising from scattering by a single neighbor
can be expressed as A(k)sin[2kr+f(k)], where k is the modulus of the wavevector, r is
the distance between absorbing and neighbor atoms, and f(k) represents the total
photoelectron phase-shift and depends on both photoabsorber and scattering atoms.
A(k) is the backscattering amplitude and is mainly a characteristic of the scatterer
X-ray Characterization of Nanoparticles 25
hn
XANES EXAFS
I
o
I
t
Energy (keV)
mt
11.8 12.0 12.2 12.4 12.6 12.8
0.0
0.5
1.0
1.5
2.0
(a)
(b)
Figure 2-6. a) X-ray absorption spectrum of Au-L
3
edge of a gold film. Note the modulation of the
absorption coefficient above the edge. b) Pictorial representation of the interference process between
ejected (solid line) and backscattered (dashed line) photoelectron waves that gives rise to the EXAFS
oscillations. See text for explanations.
atom. The total EXAFS signal consists of the superposition of individual pair-wise
contributions from all neighboring atoms; these can be grouped into coordination
shells composed of atoms found at similar distances from the absorbing atom.
The EXAFS oscillations, w(k), are given by [30]:
(2-4)
where
(2-5)
k = photoelectron wavevector modulus;
j = coordination shell index;
r = distance between the absorbing atom and a neighbor;
N = number of identical atoms in the same coordination shell;
A(k) = backscattering amplitude;
s = total Debye-Waller factor (including static and dynamic contributions);
f(k) = total phase shift;
l(k) = photoelectron mean free path;
S
2
0
(k) = amplitude reduction factor due to many-body effects;
E = photon energy;
m = electron mass;
E
0
= threshold energy.
The structural parameters involved in the EXAFS equation are the coordination
number (N), the inter-atomic distance (r), and the Debye-Waller factor (s). The latter
includes two contributions: dynamic, arising from atomic vibration, and static, which
is caused by structural disorder in a given coordination shell. This expression also
includes atomic parameters such as l(k), A(k), f(k), S
2
0
(k). The EXAFS equation sup-
poses that a harmonic approximation applies to atomic vibrations and that the pair-
distribution function for inter-atomic distances, P(r), is assumed to be Gaussian. The
term exp(-2r/l(k)) accounts for the finite photoelectron lifetime and represents the
probability for the photoelectron to travel to, and from, the backscatterer without
additional scattering and before the core hole is filled.
Since it has been assumed that w(k) can be represented by a linear combination of
sine waves from each coordination shell, it is possible, in principle, to separate each
contribution by applying a Fourier transform. By extracting and analyzing the EXAFS
signal we can obtain estimates for the structural parameters: N, r and s for each shell,
however, this requires, prior knowledge of the atomic parameters: l(k), A(k), f(k),
S
2
0
(k). To obtain the required set of atomic parameters, two approaches are possible:
they can be either calculated theoretically, or determined experimentally by using a
standard reference compound; in principle both methods seem to have the same limits
of accuracy [2].
26 Ugarte
2.4.2.1 Special features of EXAFS in nanoparticle systems
The wide use of EXAFS in materials research has led to the development of robust
procedures for the use of this technique for bulk systems. As mentioned in Section
2.4.2, the origin of EXAFS oscillations lies in the interaction of the ejected photoelec-
tron with the neighboring atoms. Since only the local environment of the excited atom
is probed, both experimental methods and data analysis procedures can be applied to
nanostructured systems. However, as might be expected, the structural parameters (N,
r, s) one obtains depend on the characteristic size of the system.
Intuitively, the very small size of particles will lead to a decrease in the mean coor-
dination number, and an absence of higher order coordination shells. Deviation in the
measured value of N, from the bulk, may be used as a rough estimate of the mean
particle diameter [34, 35], however other factors may also influence this measurement,
such as size-induced modification of the particle structure.
One of the main results that can be obtained by EXAFS is a precise determination
of inter-atomic distance (in practice, to better than 0.002 nm). EXAFS is well suited
to this measurement because it does not require long-range order and can be used to
directly determine changes to the nearest-neighbor distance in disordered or finite
systems.
EXAFS can also provide valuable information on nanoparticle structure. Although
structure cannot be fully determined, it has been proposed that through the analysis
of the first and second coordination shell distances, and in particular the ratio r
I
/r
II
(I ± first and II ± second shells), it should be possible to distinguish between MTPs
and bulk-like structures in metals [36]. In other systems, such as semiconductors, a
careful comparison among the parameters has been used to differentiate hexagonal
from cubic structures [35].
Experimental measurements of the Debye-Waller factor can be used to obtain
further structural information. Firstly, the stiffening or softening of the chemical
bonds due to the modification of the surface atomic potential can be observed,
because of modifications in the atomic vibrations [32, 37]. Secondly, we expect, based
on surface studies, that the large surface-to-volume ratio will result in a higher struc-
tural disorder in nanosystems. It is well known that the lack of translational symmetry
in surfaces leads to atomic rearrangement, changing the bond distribution. In nano-
structured materials, this effect will tend to grow as the particle diameter decreases
and will enhance the average static contribution to the Debye-Waller factor. Careful
analysis of EXAFS data at different temperatures can be used to separate the
dynamic and static contributions to the Debye-Waller factor and hence measure the
structural disorder and deduce vibrational properties (such as the Debye tempera-
ture) [35, 36, 38].
In summary, structural information can be obtained by the EXAFS through the pa-
rameters N, r and s. When dealing with nanosystems, these parameters are dependent
on the size of the system. One of the key measurements that EXAFS can perform is
an accurate estimate of nearest-neighbor distance. The technique can also provide
indirect information on: particle dimensions; vibrational properties; and structural
defects.
X-ray Characterization of Nanoparticles 27
2.4.3 Data analysis applied to nanoparticles
We now present an example of an EXAFS study that shows the main aspects of
interest in nanomaterials research. We have selected a system where it is possible to
observe most of the advantages and some specific difficulties of the technique. The
experimental sample consists of the same thiol-capped 2 nm gold nanoparticles de-
scribed in Section 2.3.3. The experiment set out to investigate the possibility of
changes in inter-atomic distances, since a contraction is expected for metal clusters
due to surface stress [39]. Measurements were performed on the Au-L
3
edge (11.919
keV), at low temperature (8 K), in transmission mode and with an energy resolution
of 1.8 eV. Detection used two gas ionization chambers.
From a qualitative point of view, we can expect to observe certain differences
between an absorption spectrum from a bulk sample and one from a sample of thiol-
capped gold nanoparticles (Fig. 2-7). Firstly, a stronger attenuation in the EXAFS
oscillations is expected. The reduction of the mean coordination number, and the
absence of higher order coordination shells, results in a homogeneous attenuation of
the EXAFS oscillation amplitude. In addition, higher structural disorder and the sur-
face metal-ligand bonds contribute to the damping of the EXAFS oscillations at high
k-values. It must be remembered that due to the passivation by thiol molecules, sur-
face gold atoms are coordinated with both sulfur and gold. The metal-ligand damping
effect can be understood because the EXAFS interference term is multiplied by the
backscattering amplitude factor, A(k), which strongly depends on the atomic number
of the scatterer atom. For heavy atoms, A(k) has a significant contribution over the
whole k-range of interest, whereas for light elements, such as sulfur, it decreases
monotonically at high k-values.
Secondly, the characteristic frequency of the EXAFS oscillations may be expected
to change if the nearest-neighbor inter-atomic distance does so. Both, the existence of
Au-Au inter-atomic distance contraction and the presence of the Au-S bond (shorter
28 Ugarte
Figure 2-7. Comparison of the absorption spectrum of 2 nm thiol-capped gold nanoparticles and bulk
gold. The attenuation and damping of the nanoparticle EXAFS oscillations can be clearly observed.
Measurements were performed at low temperature (8 K).
than the Au-Au one) should decrease the oscillation frequency in the k-space. Al-
though it is not easy to see this effect directly in the EXAFS spectrum, it becomes
visible when the signal from the first coordination shell is isolated.
In the remainder of this section, we present an example of practical EXAFS data anal-
ysis insome detail, the individual steps have been assigned to subsections [2, 30, 40].
2.4.3.1 Extraction of EXAFS signal
The absorption spectrum is composed of EXAFS oscillations superposed on a
smooth background, which comes from the other absorption edges and from the other
elements in the sample. In terms of the measured signal, m(E), the EXAFS oscillations
w(E) are defined as:
(2-6)
where m(E) is the absorption coefficient associated with a particular edge (Au-L
3
,
in this case) and m
0
(E) is the absorption coefficient of an isolated gold atom;Dm(E)is
the change in the atomic absorption across the edge, and provides normalization. Con-
sequently, the first step in the analysis involves (see Fig. 2-8):
a) subtraction of the pre-edge background: obtained by a least squares fit with a
straight line or Victoree-like function (al
3
p
± bl
4
p
, l
p
= X-ray wavelength);
b) subtraction of the atomic absorption coefficient (m
0
): estimated by a polynomial fit
in the EXAFS region, by cubic-splines or other interpolation functions;
c) normalization: difference between m
0
and the extrapolation of the pre-edge region.
This extrapolation is usually performed by fitting a standard analytical function, it
requires an estimate of the threshold value, E
0
. The choice of this parameter is
arbitrary, as it is refined during the fitting procedure. Usually it is chosen as a char-
acteristic point in the absorption curve, for example, the first inflection point.
X-ray Characterization of Nanoparticles 29
Figure 2-8. Representation of the EXAFS signal extraction from the X-ray absorption spectrum (m(k)
= absorption coefficient; m
0
(k) = atomic absorption coefficient, Dm(k) = normalization). See text for
explanations.
Because the absorption spectrum is measured as a function of energy, but the
photoelectron interference is better described in terms of k, a change of variable is
made to transform from E-tok-space using Eq. 2-5.
A check on the quality with which the EXAFS signal has been extracted can be
made by verifying that the oscillations are symmetrically distributed around zero.
Another point to check is that the function representing the atomic absorption coeffi-
cient does not match the EXAFS oscillations, this can be seen by taking its derivative.
Finally, we obtain the EXAFS oscillations shown in Fig. 2-9.
2.4.3.2 Fourier Transform
To separate the EXAFS contributions from individual coordination shells, we can
Fourier Transform (FT) w(k) into r-space. The FT of the EXAFS oscillations corre-
sponds to a pseudo-radial function, where peak positions, R, are related to inter-atom-
ic distances (although they also include phase-shift effects), and the area under peaks
30 Ugarte
4 6 8 10 12 14 16
–0.1
0.0
0.1
c
(k)*k
k(Å
–
1
)
Figure 2-9. EXAFS oscillations of 2 nm gold nanoparticles.
02468
Au - Au
Au - S
FT intensity (arb. units)
R(Å)
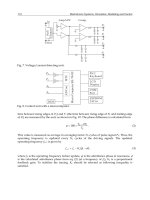
Figure 2-10. Fourier transform of the EXAFS signal using Dk = 12.6
±1
; k
min
= 3.4
±1
. Note the con-
tribution of Au-S at R » 2 , where R is the raw inter-atomic distance, not corrected by phase shift.
can be associated with the number and type of backscatterers. It is usual to truncate
the FT at a lower limit ~ k
min
=3
±1
, in order to avoid the contamination by multiple
scattering effects (XANES region). Figure 2-10 shows the resulting FT curve; in this
particular case, only the first Au-Au coordination shell can be clearly identified due to
the small size of particles (2 nm).
2.4.3.3 Isolation of a specific coordination shell
A selected r-space range can be transformed again, from r-space to k-space. This
has been done in Fig. 2-11, where the k-space signal now refers to what is the first
coordination shell. In this particular case, the difference between Au-Au and Au-S
inter-atomic distances is too close to separate out the two contributions by FT, and as
a result, it will be necessary to treat the two shells together.
2.4.3.4 Fitting procedure
The last step consists of a procedure to estimate the structural parameters (N, r, s)
by least-squares. Values for the atomic parameters: l(k), A(k), f(k) and S
2
0
(k) must be
provided. Because there are two contributions (Au-Au, Au-S) to be modeled, two sets
of atomic parameters are necessary. We have used a thin gold film to derive the Au-
Au shell atomic parameters (N = 12, r = 2.865 , s = 0), whereas Au-S parameters
were obtained theoretically (McKale tables [41], r
Au-S
= 2.32 ). In the first case, an
identical EXAFS procedure is applied to experimental data of the standard com-
pound however now, in the fit, the known parameters are the structural ones. The
resulting parameters are presented in Table 2-2; uncertainty estimates were obtained
by doubling the residual at the minimum [42].
X-ray Characterization of Nanoparticles 31
Figure 2-11. Fourier filtering of the nanoparticles first coordination shell and corresponding simulation,
which includes both Au-Au and Au-S contributions (DR = 1.85 , R
min
= 1.55 ).
Table 2-2. Fit results of EXAFS spectrum for 2.0 nm nanoparticles. Bulk gold structural parameters
are: r
Au-Au
= 2.865 and N
Au-Au
= 12; s
Au-Au
is assumed to be equal zero. DE
0
takes into account the
threshold energy refinement.
Au-Au Au-S
r [] 2.843 ± 0.007 2.34 ± 0.02
N 7.2 ± 0.8 0.8 ± 0.2
s [] 0.078 ± 0.004 0.06 ±0.02
DE
0
[eV] 0.0 ± 0.6 10 ± 2
In this example, the EXAFS analysis reveals two important effects: the existence of
a slight Au-Au inter-atomic distance contraction of about 0.8% (r
Au-Au
= 2.843 ) and
a short Au-S distance (r
Au-S
= 2.34 ), comparable to other gold-sulfur systems [43].
These results indicate that the expected contraction, verified in gold particles
immersed in a weakly interacting matrix (~ 1.4% [37]), may be partially compensated
by the bonding with thiol molecules. It has already been established that the presence
of sulfur on (100) surfaces of fcc metals induces an expansion between surface planes
[44]. As for the coordination number (N), the estimated value (7.2) is smaller than the
expected one (» 9.3) for an ideal 2 nm fcc particle formed by » 200 atoms. Several
experimental factors, such as thickness variations in the sample, may affect the deter-
mination of N, and account for this discrepancy. However, it is important to realize
that the error in N is usually quite large (10±20%) and its relationship to other sample
parameters (such as nanoparticle size) needs to be handled with care.
2.4.4 Troublesome points in the data treatment
In the example above, we have chosen to use the conventional method of analysis,
by Fourier transforms, because of its mathematical simplicity, which makes it easier to
understand the processes involved. Although we have only analyzed the first coordi-
nation shell, it is also possible to treat higher order coordination shells in systems
where these can be easily identified, such as bigger particles or when the Debye-Wal-
ler factor is small enough. However, the analysis of higher-order shells is usually more
complex, because of possible multiple scattering processes (ex. focusing); also, addi-
tional care must be taken to account for possible mean free path effects [2].
The formulation of the EXAFS spectrum presented in Section 2.4.2 is valid in the
small structural disorder limit, or the harmonic approximation, where the Debye-Wal-
ler factor is given by exp(±2s
2
k
2
). However, this expression is not valid for systems
with a high degree of disorder or high-temperature experiments, where anharmonic
contributions are no longer negligible. In fact, for nanosystems, due to the intrinsic
asymmetry of the surface atomic potential, the temperature effect can be much more
pronounced than in bulk materials. In many cases, it is necessary to use a more general
equation, where the probability of finding the jth species in the range r
j
to r
j
+dr
j
is
represented by the distribution function P(r), which may be asymmetric. However, in
such cases the data treatment becomes more complex due to the inclusion of addi-
tional free parameters in the fitting procedure [2, 45, 46]. It is worth pointing out that
the existence of an asymmetric distribution function, if not properly taken into
32 Ugarte
account, leads to serious errors in calculated structural parameters. In general, the
main consequences will be a reduction in the coordination number and a fictitious
inter-atomic distance contraction [46].
One alternative to solve the more general EXAFS problem is to use the method of
cumulants, which involves the expansion of a function associated with P(r)ina
moment-series; deviations from a Gaussian distribution are represented by the high-
er-order terms of the expansion [2]. Unfortunately, the inclusion of these extra terms
may lead to trouble in the data analysis, such as strong correlations among the param-
eters [37]. In addition, for the system where two types of atom constitute the first
shell, as studied here, this method has to be applied with care.
Another approach is to analyze the absorption spectrum directly, instead of just the
EXAFS oscillations. In this method, the background and all the coordination shells
are fitted simultaneously. This provides a more complete description of the absorption
phenomenon but requires more complex theoretical calculations. In particular, it is
necessary to use a cluster model that is close to the actual structure. This method has
been implemented in a software package called GNXAS, which was initially devel-
oped for disordered structures and it has also been applied to nanosystems [45, 47].
The EXAFS technique, as presented above, has been used widely in materials
research because of its relatively straightforward data treatment.
The use of more sophisticated packages, although essential in particular cases,
make it more difficult to ascribe physical meaning to the additional parameters in-
cluded in an analysis. In general, in a first attempt, one should try to analyze and eval-
uate possible sources of asymmetry in the distribution function. In particular, per-
forming measurements at low temperature avoids problems with anharmonic terms
[48]. In our example, this was clearly demonstrated: room temperature experiments
suggested an inter-atomic distance (2.82 ± 0.01 ) shorter than the one measured at
8 K (2.843 ± 0.007 ). Another source of problems is high structural disorder, it is
prudent to use complementary techniques, such as XRD and HRTEM to evaluate the
importance of this in a particular study.
As in all experimental data analysis, results from the EXAFS fits should be quali-
fied with uncertainty estimates for each parameter, as well as the correlations between
them. There are some well-established and specific guidelines for EXAFS analysis
that must be considered in the data treatment [42]. In particular, it is necessary to
take care about the correlation between N and s (related to the oscillation amplitude)
and r and E
0
(related to the oscillation frequency).
In this section, we have attempted to give a basic introduction to EXAFS as well as
the treatment of data when applied to nanosystems. There are, however, new analyti-
cal procedures that have been implemented and it was not intended to cover all possi-
ble methodologies here. Readers will find ample details in the specialized literature,
where there are many other examples related to nanostructured materials [31±38, 47,
48].
2.5 Conclusions
X-ray methods of characterization represent a powerful approach to the study of
nanophase materials. The advantage of these techniques is to provide meaningful
ensemble-averaged information about both medium range, and local, atomic structure
X-ray Characterization of Nanoparticles 33
in nanosystems. By characterizing the sample as a whole, they are an essential comple-
ment to other high-resolution methods, which provide rather detailed information on
only a few particles.
In particular, we have discussed the application of two of the most popular X-ray
based structural probes: diffraction and EXAFS. We have shown that it is possible to
acquire detailed information about the structure of very small gold particles (2 nm in
diameter), identifying and characterizing non-crystallographic atomic arrangements
in the sample, as well as making a precise measurement of the nearest-neighbor dis-
tance in the clusters.
We do not wish the reader to conclude that the application of EXAFS and XRD
are limited by the parameters of our two examples. Concerning EXAFS, we have only
discussed the details of inter-atomic distance determination in small metal clusters.
However, in favorable cases, a more extensive study, could yield reliable estimates of
other parameters, such as structure [32, 35, 36], mean particle diameter [34] and struc-
tural disorder [32, 35, 36]. It is important to note that our examples dealt with gold,
where the very interesting occurrence of MTP structures greatly complicates the anal-
ysis. MTPs are multi-domain structures in which the constituent units represent slight
distortions of the fcc lattice. Both EXAFS and XRD methods could be expected to
perform much better in systems of nanoparticles where the structural variety of clus-
ters is better differentiated, such as semiconductors (e.g.: the transition between wur-
zite and zinblende structures [35]).
In dealing with nanoparticle samples, it must be stressed that results of high-quality
can only be acquired if very careful attention is paid to both the measurement of raw
data and its subsequent processing and interpretation. Synchrotron radiation sources
are virtually a necessity to obtain measurements of sufficient quality; such data can
then be subjected to detailed analysis, and valuable information derived. Modern
optics and the existence of special devices, such as wigglers allow measurements of
small quantities of sample material at good signal levels.
For EXAFS in particular, the association of more intense sources with an optimized
setup for low temperature measurements would allow inclusion of the additional
structural information in the high k-range (> 16
±1
); thereby improving the precision
in parameter estimates through the use of the Fourier transform in EXAFS analysis.
For diffraction, it would be desirable to include a greater range of scattering param-
eter in future studies. The range should be extended to collect data both at larger val-
ues of s, and in the low-angle region. The latter provides direct information about par-
ticle size and shape, complementing the results of DFA. This would allow a more defi-
nitive statement to be made about the numbers of defective structures in the sample,
by allowing comparison of particle size information (from small-angles) with domain
size information (from wide-angles). Experiments performed with higher energy
photons would permit measurements to be extended out to higher values of s. Such
measurements would capture more structural information and thus improve the selec-
tivity of the DFA method. If the range of s can be made sufficiently great, then it is
also possible to use Fourier techniques to invert the diffraction pattern, thereby
obtaining the distribution of inter-atomic distances in the clusters. This information
could be compared directly with estimates of nearest-neighbor distance determined
by EXAFS.
We hope that the examples presented will have shown the reader the possibilities
offered by X-ray techniques in probing nanosystems, and that the information pro-
vided may assist in the correct application of the methods described.
34 Ugarte
Acknowledgement
The authors acknowledge the invaluable help of the LNLS staff, and thank H.
Tolentino for stimulating discussions. DZ and DU are indebted to FAPESP (Con-
tracts 96/12550±8, 97/04236-4) and CNPq for funding. BDH gratefully acknowledges
financial support for travel under the NZ/BRAP STC Agreement Programme (99-
BRAP-11-HALL).
References
[1] B. D. Cullity, Elements of X-Ray Diffraction, Reading, Addison-Wesley Publishing Co. Inc., 1978.
[2] D. C. Koningsberger and R. Prins, X-Ray Absorption: Principles, Applications, Techniques of
EXAFS, SEXAFS and XANES, New York, John Wiley & Sons, 1988, Chapters 1, 6 and 9.
[3] A. Guinier and G. Fournet, Small-Angle Scattering of X-Rays, New York, Wiley, 1955.
[4] O. Glatter and O. Kratky, Small-Angle X-Ray Scattering, London, Academic Press, 1982.
[5] G. Margaritondo, Introduction to Synchrotron Radiation, Oxford, Oxford University Press, 1988,
Chapter 1.
[6] A. Guinier, X-ray diffraction in crystals, imperfect crystals, and amorphous bodies, New York,
Dover, 1994.
[7] A. J. C. Wilson (Ed.), International Tables for Crystallography, Dordrecht, Netherlands, Kluwer
Academic, 1992.
[8] C. W. B. Grigson and E. Barton, Brit. J. Appl. Phys. 1967, 18, 175.
[9] J. B. Cohen, Ultramicroscopy 1990, 34, 41.
[10] S. Ino, J. Phys. Soc. Japan 1966, 21, 346; S. Ino and D. Ogawa, J. Phys. Soc. Japan 1967, 22, 1365; J.
G. Allpress and J. V. Sanders, Surf. Sci. 1967, 7, 1.
[11] L. D. Marks, Rep. Prog. Phys. 1994, 57, 603.
[12] C. L. Briant and J. J. Burton, Surf. Sci. 1975, 51, 345.
[13] A. L. Mackay, Acta Cryst. 1962, 15, 916.
[14] S. Ino, J. Phys. Soc. Jpn. 1969, 26, 1559; S. Ino, J. Phys. Soc. Jpn. 1969, 27, 941.
[15] B. G. Bagley, Nature 1965, 208, 674.
[16] C. Y. Yang, J. Cryst. Growth 1979, 47, 274.
[17] J. W. Lee and G. D. Stein, J. Phys. Chem. 1987, 91, 2450.
[18] D. Reinhard, B. D. Hall, D. Ugarte, and R. Monot, Phys. Rev. B 1997, 55, 7868.
[19] B. D. Hall, M. Flüeli, R. Monot and J P. Borel, Z. Phys. D 1989, 12, 97.
[20] B. D. Hall, M. Flüeli, R. Monot, and J. -P. Borel, Phys. Rev. B 1991, 43, 3906.
[21] D. Reinhard, B. D. Hall, P. Berthoud, S. Valkealahti and R. Monot, Phys. Rev. Lett. 1997, 79,
1459.
[22] D. Reinhard, B. D. Hall, P. Berthoud, S. Valkealahti and R. Monot, Phys. Rev. B 1998, 58, 4917.
[23] V. Gnutzmann and W. Vogel, J. Phys. Chem. 1990, 94, 4991.
[24] W. Vogel, B. Rosner and B. Tesche, J. Phys. Chem. 1993, 97, 11611; W. Vogel, D. A. H. Cunning-
ham, K. Tanaka and M. Haruta, Catal. Lett. 1996, 40, 175.
[25] B. D. Hall, J. Appl. Phys., submitted.
[26] B. W. van de Waal, Phys. Rev. Lett. 1996, 76, 1083.
[27] M. Brust, M. Walker, D. Bethell, D. J. Schiffrin and R. Whyman., J. Chem. Soc., Chem. Commun.
1994, 801.
[28] D. Zanchet et al., J. Phys. Chem. B., submitted.
[29] W. H. Press, S. A. Teukolsky, W. T. Vetterling, and B. P. Flannery, Numerical Recipes in C: The
Art of Scientific Computing, Cambridge, Cambridge UK, 1992.
[30] B. K. Teo, EXAFS: Basic Principles and Data Analysis, Heidelberg, Springer-Verlag, 1986.
[31] P. A. Montano, G. K. Shenoy, E. E. Alp, W. Schulze and J. Urban, Phys. Rev. Lett. 1986, 56, 2076.
[32] M. A. Marcus, M. P. Andrews, J. Zegenhagen, A. S. Bommannavar and P. Montano, Phys. Rev. B
1990, 42, 3312.
[33] A. Balerna et al., Phys. Rev. B 1985, 31, 5058.
[34] M. Borovisky, J. Phys. IV 1997, 7, C2-259.
[35] J. Rockenberger et al., J. Phys. Chem. 1997, 101, 2691.
[36] A. Balerna et al., Surf. Sci. 1985, 156, 206.
[37] A. Pinto et al., Phys. Rev. B 1995, 51, 5315.
[38] A. Balerna and S. Mobilio, Phys. Rev. B 1986, 34, 2293.
X-ray Characterization of Nanoparticles 35
[39] C. W. Mays, J. S. Vermaak and D. Kuhlmann-Wilsorf, Surf. Sci. 1968, 12, 134.
[40] We have used the software packaged ªEXAFS pour le MACº developed by A Michailowitz,
Ph.D. Thesis, UniversitØ Paris Val de Marne 1990.
[41] A. G. McKale, J. Amer. Chem. Soc. 1988, 110, 3763.
[42] F. W. Lytle, D. E. Sayers and E. A. Stern, Phys. B 1989, 158, 701.
[43] R. C. Elder et al., ACS Sym. Ser. 1983, 209.
[44] F. Sette, T. Hashizume, F. Comin, A. A. MacDowell and P. H. Citrin, Phys. Rev. Lett. 1988, 61,
1384.
[45] A. Filipponi, A. Di Cicco and C. R. Natoli, Phys. Rev. B 1995, 52, 15122; A. Filipponi and A. Di
Cicco, Phys. Rev. B 1995, 52, 15135; A. Di Cicco, Phys. B 1995, 208&209, 125.
[46] P. Eisenberg and G. S. Brown, Solid State Commun. 1979, 29, 481.
[47] R. E. Benfield et al., Phys. B 1995, 208&209, 671.
[48] L.B. Hansen, P. Stoltze, J. K. Noskov, B. S. Clausen, W. Niemann, Phys. Rev. Lett. 1990, 64, 3155.
36 Ugarte