Composite Materials Handbook Vol4 [US DOD 2010] 4A Part 10 pptx
Bạn đang xem bản rút gọn của tài liệu. Xem và tải ngay bản đầy đủ của tài liệu tại đây (65.6 KB, 15 trang )
MIL-HDBK-17-4
126
3.4
FIBER COATING PROPERTIES
3.4.1
INTRODUCTION
3.4.2
CARBON
3.4.3
TITANIUM DIBORIDE
3.4.4
YTTRIA
3.4.5
OTHERS
3.5
ALUMINUM MATRIX COMPOSITE PROPERTIES
3.5.1
INTRODUCTION
3.5.2
ALUMINA/ALUMINUM
3.5.3
BORON/ALUMINUM
3.5.4
BORON CARBIDE/ALUMINUM
3.5.5
GRAPHITE/ALUMINUM
3.5.6
SILICON CARBIDE/ALUMINUM
3.5.7
STEEL/ALUMINUM
3.5.8
TUNGSTEN/ALUMINUM
3.5.9
OTHERS/ALUMINUM
3.6
COPPER MATRIX COMPOSITE PROPERTIES
3.6.1
INTRODUCTION
3.6.2
GRAPHITE/COPPER
3.6.3
OTHERS/COPPER
3.7
MAGNESIUM MATRIX COMPOSITE PROPERTIES
3.7.1
INTRODUCTION
3.7.2
GRAPHITE/MAGNESIUM
3.7.3
ALUMINA/MAGNESIUM
3.7.4
OTHER/MAGNESIUM
MIL-HDBK-17-4
127
3.8
TITANIUM MATRIX COMPOSITE PROPERTIES
3.8.1
INTRODUCTION
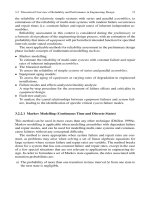
At the time of this edition, only data for SiC-reinforced titanium alloys are presented in this section.
They have all been produced by foil-fiber-foil compactions (see Section 1.2.6.2.2). The SiC fiber used in
all cases is the SCS-6 monofilament. This fiber has a nominal UTS of 500 ksi, with a 50-60 Msi modulus.
Due to these high values, the fiber properties dominate in directions parallel to the fiber axis in the compo-
sited form.
The SCS-6 monofilament is coated with a double-pass, carbon-rich layer. This coating protects the
surface of the fiber from handling damage. Additionally, it acts as a diffusion barrier to prevent reaction of
the titanium matrices with the SiC fiber during consolidation. The coating forms a weak interface which
leads to fiber/matrix debonding and low transverse properties. Thus, the properties of the materials listed
in this section are extremely anisotropic.
3.8.2
SILICON CARBIDE/TITANIUM
3.8.2.1
SiC/Ti-15-3
Composite plates were consolidated by Textron using the foil-fiber-foil method. The matrix foils were of
the alloy Ti-15V-3Cr-3Al-3Sn (Ti-15-3) and the reinforcement was the SCS-6 fibers. Plates were either 8
or 32-ply thick and had dimensions of 10” x 14”. All fiber mats used in these plates were woven with me-
tallic ribbons. The type of ribbon used (Ti, Mo, or Ti-Nb) depended upon the manufacturing year.
Tensile specimens were cut from the plates and prepared according to Section 1.3.2.4. All specimens
were heat treated in vacuum for 24 h at 1292°F (700°C). Tensile tests were conducted in air according to
the test methods in Section 1.4.2.1. Direct induction heating was used for testing at elevated tempera-
tures.
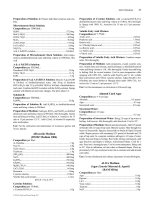
Effects of Fiber Volume Fraction
Tables of average tensile properties for the [0] orientation are given in Tables 3.8.2.1(a) through (d) for
materials with various fiber volume fractions. In these and all subsequent tables, the term “lot” refers to
one plate of material. Tensile properties and pedigree information for each specimen are presented in the
Raw Data Table in Appendix C.
Average tensile properties for the [90] orientation are given in Tables 3.8.2.1(e) and (f) for three fiber
volume fractions. Average tensile properties for cross-ply laminates with various fiber lay-ups are pre-
sented in Table 3.8.2.1(g) through (n). The tensile properties and pedigree information for these tests are
given in the Raw Data Table in Appendix C. There are three tests in the Raw Data Tables which have a “>”
sign preceding the values for the failure strains. These tests were interrupted and unloaded at the strain
value listed and, therefore, the real value for the failure strain is larger that those indicated in the table.
The ultimate tensile strength (UTS) is plotted in Figure 3.8.2.1(a) as a function of fiber volume percent
and temperature for [0] and [90] laminates. The UTS increases with increasing fiber volume percent for
the [0] laminate. There is little difference in the UTS between 75°F (24°C) and 800°F (427°C) for fiber vol-
ume percents greater than 25%. However, at a fiber volume percent of 15 there is a stronger dependence
of the UTS on temperature, indicating the stronger influence of the matrix properties. In contrast to the [0]
laminates, the UTS of the [90] laminates at 75°F (24°C) decreases with increasing fiber volume fraction.
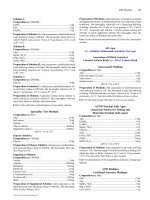
The elastic modulus is plotted in Figure 3.8.2.1(b) as a function of temperature and fiber volume per-
cent for [0] and [90] laminates. The modulus increases for the [0] laminates as fiber volume percent in-
creases. There is no significant difference between the modulus at 75°F (24°C) and 800°F (427°C) for the
[0] laminates. The modulus for the [90] laminates is independent of fiber volume percent.
MIL-HDBK-17-4
128
The proportional limits is given in Figure 3.8.2.1(c) as a function of temperature and volume fraction
for [0] and [90] laminates. For the limited amount of data present, there is no change in proportional limit
as a function of either volume fraction nor temperature. This is in part due to the large variation in these
values and the subjective manner in which these values are determined.
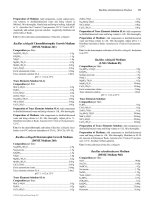
The 0.02% yield strength is given in Figure 3.8.2.1(d) as a function of volume fraction and temperature
for [0] and [90] laminates. There is a slight increase in the [0] yield strength as a function of fiber volume
fraction, but no significant difference as a function of temperature. The yield strength of the [90] laminate
is independent of both parameters.
Selected tensile curves at 75°F (24°C) (Figure 3.8.2.1(e)) and 800°F (427°C) (Figure 3.8.2.1(f)) are
plotted as a function of fiber volume percent. The material becomes increasingly stiffer and stronger with
increasing fiber volume percent. At a fiber volume fraction of 15%, there is significantly more inelasticity,
as indicated by the curvature in the stress-strain behavior, than for the materials with higher fiber volume
percents. Note also that the failure strain is independent of fiber volume percent, particularly at 800°F
(427°C).
Figure 3.8.2.1(g) shows the stress-transverse width strain curves at 800°F (427°C) as a function of
fiber volume percent. Again, the curves are stiffer and stronger at higher fiber volume percents.
Effects of Fiber Orientation for a Fiber Volume Percent of 35%
The average elastic modulus is plotted in Figure 3.8.2.1(h) as a function of fiber layup for both the
75°F (24°C) and 800°F (427°C) test temperatures. The modulus decreases for fiber lay-ups moving from
the left to the right in this figure, which represents a trend towards less influence from the fiber and more
influence from the matrix properties. Given the paucity of tests, no significant difference between the
modulus at 75°F (24°C) and 800°F (427°C) could be observed.
The average UTS is shown in Figure 3.8.2.1(i) as a function of fiber layup for test temperatures of
75°F (24°C) and 800°F (427°C). The UTS decreases from a value of approximately 200 ksi for the
strongest orientation (that is, [0]), to a value of approximately 60 ksi for the weakest orientation (that is,
[90]). The strength of the cross-ply laminates lie somewhere in between and depend on the amount of
contribution from a near-zero ply. There is no significant difference in the UTS values between the two
temperatures.
Tensile curves at 75°F (24°C) for various laminate orientations are given in Figure 3.8.2.1(j). The initial
portion of the tensile curve for the unreinforced matrix is also given for comparison (the arrows indicate
that those curves continue to higher strains). All of the composite laminates are stiffer than the unrein-
forced matrix material. However, only three of the composite laminates ([0], [90/0] and [+/-30]) are
stronger than the unreinforced matrix. Also, all of the composite laminates have far less ductility than the
unreinforced matrix.
MIL-HDBK-17-4
129
3.8.2.1 SCS-6/Ti-15V-3Cr-3Al-3Sn foil/fiber/foil*
SiC/Ti
MATERIAL:
SCS-6/Ti-15V-3Cr-3Al-3Sn foil/fiber/foil
SCS-6/Ti-15-3
Summary
FIBER SCS-6, continuous, 145
µ
m
MATRIX: Ti-15V-3Cr-3Sn-3Al
MANUFACTURER: Textron
PROCESS SEQUENCE: Hipped Foil/Fiber/Foil Preforms
PROCESSING: SOURCE: NASA LeRC
Date of fiber manufacture Date of testing 6/98-10/96
Date of matrix manufacture Date of data submittal 5/98
Date of composite manufacture Date of analysis 9/98
LAMINA PROPERTY SUMMARY
Temperature 75°F 800°F
Environment Air Air
Fiber
v/o
15 35 41 15 25 35 41
[0]
Tension, 1-axis
SS-SSSS SSSSSS- SS-SSS- SSSS-S- SSSS-S- SS-SSS- SSSS
[90]
Tension, 2-axis
SS-SSSS SSSSSSS SS-S SS-SSSS
Classes of data: F - Fully approved, S - Screening in order: Strength/Modulus/Poisson’s Ratio/Strain-to-failure/Proportional
Limit/0.02-offset-strength/0.2-offset-strength.
* Raw data tables in Appendix C.
MIL-HDBK-17-4
130
Nominal As Submitted Test Method
Fiber Density (g/cm
3
)3.0 3.0
Foil Matrix Density (g/cm
3
)4.8
Composite Density (g/cm
3
)
Ply Thickness* (in)
* Fiber center to fiber center
LAMINATE PROPERTY SUMMARY
Temperature 75°F 800°F
Environment Air Air
Fiber
v/o
35 35
[+/- 30]
Tension, x-axis
SS-SSSS SS-SSSS
[+/- 45]
Tension, x-axis
SS-SSSS SS-SSSS
[+/-60]
Tension, x-axis
SS-SSSS SS-SSSS
[0/90]
Tension, x-axis
SSSSSSS
Classes of data: F - Fully approved, S - Screening in order: Strength/Modulus/Poisson’s Ratio/Strain-to-failure/Proportional
Limit/0.02-offset-strength/0.2-offset-strength.
MIL-HDBK-17-4
131
MATERIAL: SCS-6/Ti-15V-3Cr-3Al-3Sn foil/fiber/foil
Table 3.8.2.1(a)
SiC/Ti Foil/fiber/foil
MACHINING: EDM FIBER VOLUME: 15-41 %
SCS-6/Ti-15-3
FIBER SPACING:
Tension, 1-axis
[0
]
8
SPECIMEN THICKNESS: 0.06-0.12 in. MODULUS Least squares analysis
75
CALCULATION: up to proportional limit
Screening
TEST METHOD: Sec. 1.4.2.1
PRE-TEST EXPOSURE: Vac. 1292
°
F, 24 hrs. SOURCE: NASA LeRC
NORMALIZED BY: Not normalized
Temperature (°F) 75 75 75
Environment Air Air Air
Fiber Volume (%) 15 35 41
Strain Rate (1/s)
1·10
-
4
1·10
-
4
1·10
-
4
Mean 185 200 227
Minimum 168 201
Maximum 217 252
C.V.(%) 7.16
B-value (2)
F
tu
1
Distribution Normal
(ksi) C
1
200
C
2
14.3
No. Specimens 1 9 2
No. Lots 1 2 1
Approval Class Screening Screening Screening
Mean 20 26.6 31
Minimum 25.0 31
Maximum 29.0 31
E
t
1
C.V.(%) 5.66
(Msi) No. Specimens 1 8 2
No. Lots 1 2 1
Approval Class Screening Screening Screening
Mean 0.28
ν
12
t
No. Specimens 1
No. Lots 1
Approval Class Screening
Mean 1.21 0.84 0.82
Minimum 0.66 0.73
Maximum 1 0.9
C.V.(%) 14
B-value (1)
ε
1
tu
Distribution Normal
(%) C
1
0.84
C
2
0.12
No. Specimens 1 9 2
No. Lots 1 2 1
Approval Class Screening Screening Screening
(1) B-basis values appear for fully-approved data only.
MIL-HDBK-17-4
132
MATERIAL: SCS-6/Ti-15V-3Cr-3Al-3Sn foil/fiber/foil
Table 3.8.2.1(b)
SiC/Ti Foil/fiber/foil
MACHINING: EDM/water jet/diamond grind FIBER VOLUME: 15-41 %
SCS-6/Ti-15-3
FIBER SPACING:
Tension, 1-axis
[0]
8
(1)
SPECIMEN THICKNESS: in. MODULUS Least squares analysis
800
CALCULATION: up to proportional limit
Screening
TEST METHOD: Sec. 1.4.2.1
PRE-TEST EXPOSURE: Vac. 1292
°
F, 24 hrs. SOURCE: NASA LeRC
NORMALIZED BY: Not normalized
Temperature (°F) 800 800 800 800 800 800
Environment Air Air Air Air Air Air
Fiber Volume (%) 152535353541
Strain Rate (1/s)
1·10
-3
1·10
-
3
1·10
-
5
1·10
-4
1·10
-
3
1·10
-3
Mean 137 195 198 200 226 248
Minimum 136 192 201 245
Maximum 138 197 252 251
C.V.(%)
B-value
F
tu
1
Distribution
(ksi) C
1
C
2
No. Specimens 2 2 1 1 4 2
No. Lots 111111
Approval Class Screening Screening Screening Screening Screening Screening
Mean 19 24 29 32 27 31
Minimum 19 24 26 30
Maximum 19 24 29 32
E
t
1
C.V.(%)
(Msi) No. Specimens 2 2 1 1 4 2
No. Lots 111111
Approval Class Screening Screening Screening Screening Screening Screening
Mean 0.38 0.32 0.3
ν
12
t
No. Specimens 2 2 2
No. Lots 1 1 1
Approval Class Screening Screening Screening
Mean 0.81 0.90 0.82 0.77 0.95 0.84
Minimum 0.75 0.88 0.84 0.83
Maximum 0.86 0.91 1.06 0.84
C.V.(%)
B-value
ε
1
tu
Distribution
(%) C
1
C
2
No. Specimens 2 2 1 1 4 2
No. Lots 111111
Approval Class Screening Screening Screening Screening Screening Screening
(1) Also contains data from 32-ply material.
(2) B-basis values appear for fully-approved data only.
MIL-HDBK-17-4
133
MATERIAL: SCS-6/Ti-15V-3Cr-3Al-3Sn foil/fiber/foil
Table 3.8.2.1(c)
SiC/Ti Foil/fiber/foil
MACHINING: EDM FIBER VOLUME: 15-41 %
SCS-6/Ti-15-3
FIBER SPACING:
Tension, 1-axis
[0]
8
SPECIMEN THICKNESS: 0.06-0.12 in. MODULUS Least squares analysis
75
CALCULATION: up to proportional limit
Screening
TEST METHOD: Sec. 1.4.2.1
PRE-TEST EXPOSURE: Vac. 1292
°
F, 24 hrs. SOURCE: NASA LeRC
NORMALIZED BY: Not normalized
Temperature (°F) 75 75 75
Environment Air Air Air
Fiber Volume (%) 15 35 41
Strain Rate (1/s)
1·10
-
4
1·10
-
4
1·10
-
4
Mean 123 116 140
Minimum 33 128
Maximum 150 151
C.V.(%) 31.9
B-value (1)
F
pl
1
Distribution ANOVA
(ksi) C
1
36.6
C
2
2.45
No. Specimens 1 9 2
No. Lots 1 2 1
Approval Class Screening Screening Screening
Mean 141 145 176
Minimum 82 160
Maximum 186 192
C.V.(%) 25.8
B-value (1)
F
ty
1
002.
Distribution ANOVA
(ksi) C
1
40.6
C
2
6.35
No. Specimens 1 9 2
No. Lots 1 2 1
Approval Class Screening Screening Screening
Mean 172
Minimum
Maximum
C.V.(%)
B-value
F
ty
1
0.2
Distribution
(ksi) C
1
C
2
No. Specimens 1
No. Lots 1
Approval Class Screening
(1) B-basis values appear for fully-approved data only.
MIL-HDBK-17-4
134
MATERIAL: SCS-6/Ti-15V-3Cr-3Al-3Sn foil/fiber/foil
Table 3.8.2.1(d)
SiC/Ti Foil/fiber/foil
MACHINING: EDM/water jet/diamond grind FIBER VOLUME: 15-41 %
SCS-6/Ti-15-3
FIBER SPACING:
Tension, 1-axis
[0
]
8
(1)
SPECIMEN THICKNESS: in. MODULUS Least squares analysis
800
CALCULATION: up to proportional limit
Screening
TEST METHOD: Sec. 1.4.2.1
PRE-TEST EXPOSURE: Vac. 1292
°
F, 24 hrs. SOURCE: NASA LeRC
NORMALIZED BY: Not normalized
Temperature (°F) 800 800 800 800 800 800
Environment Air Air Air Air Air Air
Fiber Volume (%) 152535353541
Strain Rate (1/s)
1·10
-3
1·10
-3
1·10
-
5
1·10
-
4
1·10
-
3
1·10
-3
Mean 24 17 91
Minimum 31
Maximum 151
C.V.(%)
B-value
F
pl
1
Distribution
(ksi) C
1
C
2
No. Specimens 1 1 2
No. Lots 1 1 1
Approval Class Screening Screening Screening
Mean 116 158 90 42 175 200
Minimum 115 151 147 187
Maximum 116 164 187 212
C.V.(%)
B-value
F
ty
1
002.
Distribution
(ksi) C
1
C
2
No. Specimens 2 2 1 1 4 2
No. Lots 111111
Approval Class Screening Screening Screening Screening Screening Screening
Mean
Minimum
Maximum
C.V.(%)
B-value
F
ty
1
0.2
Distribution
(ksi) C
1
C
2
No. Specimens
No. Lots
Approval Class
(1) Also contains data from 32-ply material.
MIL-HDBK-17-4
135
MATERIAL: SCS-6/Ti-15V-3Cr-3Al-3Sn foil/fiber/foil
Table 3.8.2.1(e)
SiC/Ti Foil/fiber/foil
MACHINING: EDM FIBER VOLUME: 15-41 %
SCS-6/Ti-15-3
FIBER SPACING:
Tension, 2-axis
[90]
8
SPECIMEN THICKNESS: 0.06-0.12 in. MODULUS Least squares analysis
75, 800
CALCULATION: up to proportional limit
Screening
TEST METHOD: Sec. 1.4.2.1
PRE-TEST EXPOSURE: Vac. 1292
°
F, 24 hrs. SOURCE: NASA LeRC
NORMALIZED BY: Not normalized
Temperature (°F) 75 75 75 800 800
Environment Air Air Air Air Air
Fiber Volume (%) 15 35 41 35 35
Strain Rate (1/s)
1·10
-
4
1·10
-4
1·10
-4
1·10
-
5
1·10
-
4
Mean 96 61 28 41 42
Minimum 59 23
Maximum 62 33
C.V.(%)
B-value
F
tu
2
Distribution
(ksi) C
1
C
2
No. Specimens 1 2 2 1 1
No. Lots 11111
Approval Class Screening Screening Screening Screening Screening
Mean 18 18 18 17 17
Minimum 17 18
Maximum 19 18
E
t
2
C.V.(%)
(Msi) No. Specimens 1 2 2 1 1
No. Lots 11111
Approval Class Screening Screening Screening Screening Screening
Mean 0.18
ν
νν
ν
21
t
No. Specimens 2
No. Lots 1
Approval Class
Screening
Mean 1.91 1.41 0.16 0.99 0.71
Minimum 1.38 0.12
Maximum 1.43 0.19
C.V.(%)
B-value
ε
2
tu
Distribution
(%) C
1
C
2
No. Specimens 1 2 2 1 1
No. Lots 11111
Approval Class Screening Screening Screening Screening Screening
MIL-HDBK-17-4
136
MATERIAL: SCS-6/Ti-15V-3Cr-3Al-3Sn foil/fiber/foil
Table 3.8.2.1(f)
SiC/Ti Foil/fiber/foil
MACHINING: EDM FIBER VOLUME: 15-41 %
SCS-6/Ti-15-3
FIBER SPACING:
Tension, 2-axis
[90]
8
SPECIMEN THICKNESS: 0.06-0.12 in. MODULUS Least squares analysis
75, 800
CALCULATION: up to proportional limit
Screening
TEST METHOD: Sec. 1.4.2.1
PRE-TEST EXPOSURE: Vac. 1292
°
F, 24 hrs. SOURCE: NASA LeRC
NORMALIZED BY: Not normalized
Temperature (°F) 75 75 75 800 800
Environment Air Air Air Air Air
Fiber Volume (%) 15 35 41 35 35
Strain Rate (1/s)
1·10
-4
1·10
-4
1·10
-4
1·10
-
5
1·10
-4
Mean 42 16 15 16
Minimum 15
Maximum 17
C.V.(%)
B-value
F
pl
1
Distribution
(ksi) C
1
C
2
No. Specimens 2 2 1 1
No. Lots 1 1 1 1
Approval Class Screening Screening Screening Screening
Mean 44 39 22 25
Minimum 38
Maximum 40
C.V.(%)
B-value
F
ty
2
002.
Distribution
(ksi) C
1
C
2
No. Specimens 1 2 1 1
No. Lots 1 1 1 1
Approval Class Screening Screening Screening Screening
Mean 75 49.5 30 34
Minimum 49
Maximum 50
C.V.(%)
B-value
F
ty
2
0.2
Distribution
(ksi) C
1
C
2
No. Specimens 1 2 1 1
No. Lots 1 1 1 1
Approval Class Screening Screening Screening Screening
MIL-HDBK-17-4
137
MATERIAL: SCS-6/Ti-15V-3Cr-3Al-3Sn foil/fiber/foil
Table 3.8.2.1(g)
SiC/Ti Foil/fiber/foil
MACHINING: EDM/diamond grind FIBER VOLUME: 35 %
SCS-6/Ti-15-3
FIBER SPACING:
Tension, x-axis
[+/-30]
2s
(1)
SPECIMEN THICKNESS: in. MODULUS Least squares analysis
75, 800
CALCULATION: up to proportional limit
Screening
TEST METHOD: Sec. 1.4.2.1
PRE-TEST EXPOSURE: Vac. 1292
°
F, 24 hrs. SOURCE: NASA LeRC
NORMALIZED BY: Not normalized
Temperature (°F) 75 800
Environment Air Air
Fiber Volume (%) 35 35
Strain Rate (1/s)
1·10
-
4
1·10
-
3
Mean 148 134
Minimum 133
Maximum 179
C.V.(%) 8.16
B-value (2)
F
x
tu
Distribution ANOVA
(ksi) C
1
24.6
C
2
19.8
No. Specimens 10 1
No. Lots 2 1
Approval Class Screening Screening
Mean 22.2 20
Minimum 20.0
Maximum 24.0
E
x
t
C.V.(%) 5.64
(Msi) No. Specimens 11 1
No. Lots 2 1
Approval Class Screening Screening
Mean
ν
xy
t
No. Specimens
No. Lots
Approval Class
Mean 1.24 1.52
Minimum 0.99
Maximum 1.66
C.V.(%) 17.0
B-value (2)
ε
x
tu
Distribution ANOVA
(%) C
1
0.35
C
2
17.6
No. Specimens 9 1
No. Lots 2 1
Approval Class Screening Screening
(1) Also contains data from 32-ply material.
(2) B-basis values appear for fully-approved data only.
MIL-HDBK-17-4
138
MATERIAL: SCS-6/Ti-15V-3Cr-3Al-3Sn foil/fiber/foil
Table 3.8.2.1(h)
SiC/Ti Foil/fiber/foil
MACHINING: EDM/diamond grind FIBER VOLUME: 35 %
SCS-6/Ti-15-3
FIBER SPACING:
Tension, x-axis
[+/-30]
2s
(1)
SPECIMEN THICKNESS: in. MODULUS Least squares analysis
75, 800
CALCULATION: up to proportional limit
Screening
TEST METHOD: Sec. 1.4.2.1
PRE-TEST EXPOSURE: Vac. 1292
°
F, 24 hrs. SOURCE: NASA LeRC
NORMALIZED BY: Not normalized
Temperature (°F) 75 800
Environment Air Air
Fiber Volume (%) 35 35
Strain Rate (1/s)
1·10
-
4
1·10
-3
Mean 55.3 40
Minimum 33
Maximum 67
C.V.(%) 19.1
B-value (2)
F
pl
1
Distribution Weibull
(ksi) C
1
59.3
C
2
7.3
No. Specimens 11 1
No. Lots 2 1
Approval Class Screening Screening
Mean 69.1 50
Minimum 26
Maximum 97
C.V.(%) 25.7
B-value (2)
F
x
ty0 02.
Distribution Weibull
(ksi) C
1
75.1
C
2
5.0
No. Specimens 11 1
No. Lots 2 1
Approval Class Screening Screening
Mean 112 86
Minimum 91
Maximum 146
C.V.(%) 12.8
B-value (2)
F
x
ty0.2
Distribution Normal
(ksi) C
1
112
C
2
14.3
No. Specimens 11 1
No. Lots 2 1
Approval Class Screening Screening
(1) Also contains data from 32-ply material.
(2) B-basis values appear for fully-approved data only.
MIL-HDBK-17-4
139
MATERIAL: SCS-6/Ti-15V-3Cr-3Al-3Sn foil/fiber/foil
Table 3.8.2.1(i)
SiC/Ti Foil/fiber/foil
MACHINING: EDM FIBER VOLUME: 35 %
SCS-6/Ti-15-3
FIBER SPACING:
Tension, x-axis
[+/-45]
2s
SPECIMEN THICKNESS: 0.08 in. MODULUS Least squares analysis
75, 800
CALCULATION: up to proportional limit
Screening
TEST METHOD: Sec. 1.4.2.1
PRE-TEST EXPOSURE: Vac. 1292
°
F, 24 hrs. SOURCE: NASA LeRC
NORMALIZED BY: Not normalized
Temperature (°F) 75 800 800
Environment Air Air Air
Fiber Volume (%) 35 35 35
Strain Rate (1/s)
1·10
-
4
1·10
-
5
1·10
-
4
Mean 77 64 68
Minimum
Maximum
C.V.(%)
B-value
F
x
tu
Distribution
(ksi) C
1
C
2
No. Specimens 1 1 1
No. Lots 1 1 1
Approval Class Screening Screening Screening
Mean 17 17 13
Minimum
Maximum
E
x
t
C.V.(%)
(Msi) No. Specimens 1 1 1
No. Lots 1 1 1
Approval Class Screening Screening Screening
Mean
ν
xy
t
No. Specimens
No. Lots
Approval Class
Mean >4 >4.6 7.29
Minimum
Maximum
C.V.(%)
B-value
ε
x
tu
Distribution
(%) C
1
C
2
No. Specimens 1 1 1
No. Lots 1 1 1
Approval Class Screening Screening Screening
MIL-HDBK-17-4
140
MATERIAL: SCS-6/Ti-15V-3Cr-3Al-3Sn foil/fiber/foil
Table 3.8.2.1(j)
SiC/Ti Foil/fiber/foil
MACHINING: EDM FIBER VOLUME: 35 %
SCS-6/Ti-15-3
FIBER SPACING:
Tension, x-axis
[+/-45]
2s
SPECIMEN THICKNESS: 0.08 in. MODULUS Least squares analysis
75, 800
CALCULATION: up to proportional limit
Screening
TEST METHOD: Sec. 1.4.2.1
PRE-TEST EXPOSURE: Vac. 1292
°
F, 24 hrs. SOURCE: NASA LeRC
NORMALIZED BY: Not normalized
Temperature (°F) 75 800 800
Environment Air Air Air
Fiber Volume (%) 35 35 35
Strain Rate (1/s)
1·10
-
4
1·10
-
5
1·10
-
4
Mean 30 28 21
Minimum
Maximum
C.V.(%)
B-value
F
pl
1
Distribution
(ksi) C
1
C
2
No. Specimens 1 1 1
No. Lots 1 1 1
Approval Class Screening Screening Screening
Mean 40 30 35
Minimum
Maximum
C.V.(%)
B-value
F
x
ty0 02.
Distribution
(ksi) C
1
C
2
No. Specimens 1 1 1
No. Lots 1 1 1
Approval Class Screening Screening Screening
Mean 52 29 47
Minimum
Maximum
C.V.(%)
B-value
F
x
ty0.2
Distribution
(ksi) C
1
C
2
No. Specimens 1 1 1
No. Lots 1 1 1
Approval Class Screening Screening Screening