Environmental Site Assessment Phase 1: Fundamentals, Guidelines, and Regulations - Chapter 4 pps
Bạn đang xem bản rút gọn của tài liệu. Xem và tải ngay bản đầy đủ của tài liệu tại đây (9.06 MB, 23 trang )
61
Chapter 4
Physical Setting
Introduction
The physical setting is a description of the land on which the property is
located. The physical characteristics are relied on to assist in the speculation
as to the potential for migration of contaminants to the groundwater and
soils within surrounding areas.
The level of diligence in an investigation should be escalated where migra‑
tion potential of a contaminant to a major aquifer is signicant. A site may
have soils that conne and prevent migration of hazardous substances. The
closest drinking water source is a private well outside a 1‑mile radius, and
the water source is 400 feet down with a layer of impermeable, unfractured
slate (at rock) as a barrier. The concern for a site such as this is not as great
as one involving a property that is directly over a recharge zone to a major
aquifer where surface contaminants may easily migrate to the groundwater.
The information contained within this chapter provides the reader with
the basic concepts for understanding the relationship between a physical set‑
ting and its impact on the spread potential of hazardous substances. Hazard‑
ous substances may spread through soil or rock formations, surface water,
groundwater, and air.
If you require a more in‑depth understanding of the soils and ground‑
water, consult a geologist or hydrogeologist. For instance, if the investigator
determines that there is probable soil co
ntamination on an adjacent prop
‑
erty that could result in a costly impact to the property being evaluated, the
investigator may seek add
itional expertise. A possible problem has been
identied, and the soil is highly variable, so it is difcult to predict migra‑
tory ow. Then, a geologist or hydrogeologist could project the probability
for that contaminant to migrate to where it could have a detrimental effect
on the property and its immediate environment.
Environmental factors include the relative location (geography), land con‑
touring (topography), geological characteristics (surface soils and subsurface
geology), surface water characteristics (hydrology), subsurface water and soil
characteristics (hydrogeology), and ood plain inuences. All are a basis for
potential impact on the migration potential of hazardous substance contami‑
nation in a given environment.
The only thing required by the ASTM Standard, and mandated by the All
Appropriate Inquiries Rule, is a current topographic map. One or more addi‑
tional sources of physical information are discretionary. The discretionary
7966.indb 61 10/19/07 6:49:11 AM
© 2008 by Taylor & Francis Group, LLC
62 Environmental Site Assessment Phase I
physical setting sources should be sought: (1) when conditions have been
identied to indicate that hazardous substances or petroleum products are
likely to migrate to the property or from the property via the soil or ground‑
water; and (2) in order to assess the probable impact of known contaminants
and project the direction of migration.
Geographic Description
The relative location of the property provides information concerning proxim‑
ity to population centers. Numerous sources can provide geographic maps.
Each state Department of Highways has a complete set that covers the
entire state, including rural areas. Each city Chamber of Commerce has
maps that cover their city and some of the surrounding areas. Commercial
street directories (e.g., Rand McNally Street Direction Finders), which can be
purchased wherever maps are sold, are available for large population centers
and the surrounding areas (e.g., Dallas Metroplex). All can be purchased for
a nominal fee, and those that contain block numbers will prove useful later
when you are plotting locations associated with the property.
A parcel of land is not an isolated entity. Its relative associations and activ‑
ities may impact or be impacted by other properties. For instance, raw land
located adjacent to an industrial complex may be impacted by the others’
environmental pollutants.
Likewise, an industrial activity located 10 miles from the nearest resi‑
dence is unlikely to either be affected by or affect the other. On the other
hand, an industrial site may be near a water reservoir that the neighboring
community relies on for drinking water. Poorly managed hazardous wastes
could end up in the reservoir due to its proximity.
Topographic Characteristics
Topography is land contouring information, a delineation of relative eleva‑
tions of land surfaces. Knowledge of the ground topography may be used to
predict directional movement of soil contaminants. If the soil is known to
be contaminated in a given area, migration potential to other areas will be
affected by ground contours, which inuence the direction of ow.
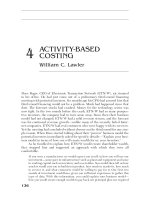
Maps are prepared by the U.S. Geological Survey and can be obtained
from them, the city planning department, and retail stores. The most com‑
monly used map is the U.S. Geological 7.5‑Minute Series. The minutes refer
to the scale; thus, a 7.5‑minute series spans 7.5 minutes of longitude and 7.5
minutes of latitude and is on a scale of 1:24,000, 1 inch to 2,000 feet. As can
be observed in Figure 4.1, the most prominent information is the depiction
of elevation levels, within contour lines. Rivers and lakes are delineated on
these maps, as are some major population centers, roads, marine shoreline
features, mines, and caves. However, the information does not stop with
7966.indb 62 10/19/07 6:49:11 AM
© 2008 by Taylor & Francis Group, LLC
Physical Setting 63
topographic features. There is more that could be helpful when identifying
other land features.
Probable pathways and direction of ow of soil contaminants are impacted
by the rise and fall of the land. Although the ground formations below the
surface do not always lend themselves to the same contours as that which is
observed on the surface, the surface and subsurface contours are generally
similar. Geologists can further interpret topographic maps with their knowl‑
edge of how the earth is formed.
It should be noted that topography changes over time due to the forces
of nature, mining, landll activities, and development of articial lakes.
Figure 4.1 Topographic maps of Key Largo, Florida, depicting ground elevations
and land usage changes over time, showing golf course, sewage disposal, airport,
buildings, and roads. Continued
.
Mapped in 1949
7966.indb 63 10/19/07 6:49:13 AM
© 2008 by Taylor & Francis Group, LLC
64 Environmental Site Assessment Phase I
Topographic maps are, thus, updated when these changes are known and
sufcient money is available to contract for the updates. In some instances,
updates may be as frequent as every ve to ten years, but some are as much
as fty years old.
The old topographic maps are generally sold prior to the more dated maps
if an investigator does not know to request the latest version. All the maps
have the data accumulation date on them. Check the dates.
Surface Soils and Subsurface Geologic Characteristics
1
Surface soils are the top layer of the earth’s surface, and geology involves the
interpretation of soils and rock near the earth’s surface. Information concerning
Mapped in 1973
Figure 4.1
Continued.
7966.indb 64 10/19/07 6:49:16 AM
© 2008 by Taylor & Francis Group, LLC
Physical Setting 65
surface soils and subsurface geologic formations is used to determine the poten‑
tial for contaminant migration, once again providing the investigator a means
by which to predict the movement and environmental impact of contaminants.
Surface Soils
Surface soil information may be obtained from the U.S. Department of Agri‑
culture or the county soil conservation service. The U.S. Department of Agri‑
culture publishes information about the suitability of identied areas for
general land use. Data includes the types of soil; steepness of slopes; drainage
information; soil pH; depth to bedrock; and anticipated native vegetation.
Each document, published by county, has a series of soil maps, presented
on aerial photographs, in the back of each manual. The scale is 1:24,000, and
the maps are marked to denote soil types, as depicted in Figure 4.2. Other
designated markings include man
‑made features (e.g., roads, railroads, and
pipelines), water features (e.g., wet spots, rivers, and lakes), and other perti‑
nent information (e.g., rock outcroppings, gullies, and dumps). Table 4.1 con
‑
tains a more detailed list of features provided on these maps.
Permeability serves as an indicator regarding the accessibility of rainwater
or surface water and associated contaminants to the subsurface ge
ologic for
‑
mations. Permeability is measured in inches per hour and is based on water’s
ability to migrate downward through saturated soil. Permeability rates range
from very slow, less than 0.06 inches per hour (e.g., certain types of clay), to
very rapid, greater than 20 inches per hour (e.g., sandy soil). See Table 4.2 for
a relative description of the permeability rates. If there is no potential for con‑
taminants, the point is moot, and the soil type provides nothing more than
land usability information. However, if a potential for contaminants does
exist, the soil permeability is relevant. For instance, if there is an oil renery
on a site where the soil permeability is 20 inches per hour, the threat of a
chemical contaminant migrating downward is highly probable.
Slope steepness is provided in degrees for each soil type. Sloping infor‑
mation gives the potential direction of ow and migration, not only through
the soil, but over the uppermost surface. A 30‑degree slope poses a greater
possibility for migration downhill than a 2‑degree slope.
Drainage information is qualied by soil type and subtype. This is gen‑
erally part of the written description and merely states extent of drainage,
ranging from excessively drained (i.e., water is removed from the soil very
rapidly) to very poorly drained (i.e., water is removed so slowly that free
water remains at or on the surface during most of the growing season).
Soil pH information is found in the soil tables. This information may be
useful where there are underground storage tanks or waste drums. Con‑
tainer deterioration is attributed to corrosive soils and other environmental
contacts. A soil type that has a pH between 6.6 and 7.3 is neutral. The lower
the pH, the stronger the acidity. The higher the pH, the stronger the alkalin‑
ity. Both extremes may have an impact on steel.
7966.indb 65 10/19/07 6:49:16 AM
© 2008 by Taylor & Francis Group, LLC
66 Environmental Site Assessment Phase I
Depth to bedrock is found in the soil tables as well. This is the depth
of the soils and other unconsolidated material before it reaches the under‑
lying rock. Keep in mind that some bedrock extends to the surface and fails
to support soils (e.g., Enchanted Rock, Texas). Thus, surface bedrock is not
affected by soil data whereas soil data will affect the migration potential
down to bedrock.
Native vegetation information, rarely used by investigators, is difcult to
interpret if one is not familiar with native plants. Yet, where it is known that
grasses and trees normally occupy the landscape and the land is void of
Figure 4.2 Soil survey map of area north of Georgetown, Texas, depicting soil
types, municipal airport, quarries, roads, and buildings.
7966.indb 66 10/19/07 6:49:19 AM
© 2008 by Taylor & Francis Group, LLC
Physical Setting 67
Table 4.1 Features Depicted on Soil and Topographic Maps
Land Features U.S. Soil Survey Maps USGS Topographic Maps
Contours
Soil type
X —
Elevations
— X
Land features
— X
Coastal features
— X
Mines and caves
Mine dump
— X
Pits
X X
Quarry
X X
Tailings
— X
Parks X X
Oil/gas pipelines X X
Power transmission lines X X
Railroads X X
Roads & highways X X
Structures
Aboveground tanks
X X
Airports
X X
Cemeteries
X X
Dams
X X
Dumps
— X
Fence lines
Occasionally X
Oil/gas wells
X X
Pits
X X
Water wells
X X
Windmills
X X
Submerged areas
Gully
X —
Swamp/marsh
X X
Vegetation — X
Water features
Lakes, ponds, and reservoirs
X X
Marine shorelines
— X
Note: Partial extraction from the respective map legends.
7966.indb 67 10/19/07 6:49:19 AM
© 2008 by Taylor & Francis Group, LLC
68 Environmental Site Assessment Phase I
vegetation, this may be a ready clue that vegetation has died or is unable to
grow, likely due to contaminated soil.
Subsurface Geology
Subsurface geology refers to the formation characteristics of an area that is
below the surface soil or directly exposed at the surface and precedes or con‑
tains groundwater. Information regarding subsurface geology is provided
on U.S. Geological Survey maps. They may be purchased or can even be
found in some university libraries.
Characteristics of interest are rock types—permeability and thickness.
This information should assist the investigator in determining the ground
‑
water susceptibility to contamination through the bedrock. An aquifer
located beneath impermeable layers of rock and clay is less susceptible to
surface contaminants than one located beneath fractured rock and sand.
The geologic maps are typically on a scale of 1:250,000 and encompass
part of or all of several counties. See Figure 4.3 for an example of the geologic
atlas of the area around Texas A&M University.
Each set has an index with the area of coverage delineated in a rectangle or
square. The formations, indicated on a map, are detailed within an explanatory
book enclosed with each map. An example of explanatory information follows:
Catahoula Formation [Mc]: Clay and sand; clay, benton‑
itic, noncalcareous except for some calcareous concretions
locally, light olive gray; sand, tuffaceous, ne to medium
grained, crossbedded lenses, light gray to grayish brown;
thickness 120–300 feet, thins southwestward.
This information may require the assistance of a geologist to ascertain per‑
meability of the various layers.
Surface Water Hydrologic Characteristics
Hydrology is the study of the occurrence, movement, and quality of water
above, on, and beneath the earth’s surface. Surface water is another mode for
transporting hazardous substances from one site to another. When the rate of
Table 4.2 Permeability of Soils
Very slow Less than 0.06 in./hr
Slow 0.2 to 0.6 in./hr
Moderate 0.6 to 2.0 in./hr
Moderately rapid 2.0 to 6.0 in./hr
Rapid 6.0 to 20 in./hr
7966.indb 68 10/19/07 6:49:20 AM
© 2008 by Taylor & Francis Group, LLC
Physical Setting 69
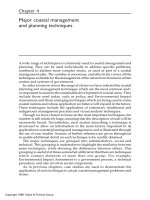
precipitation exceeds the rate of soil inltration, overland ow occurs. Excesses
also percolate downward to the groundwater, then laterally to sites of ground‑
water discharge, feeding into the surface waters. See Table 4.3 for relative avail‑
able freshwater content of the earth’s surface and Figure 4.4 for a depiction of
the impact of the hydrologic cycle on the spread of contaminants.
Figure 4.3 Geologic atlas of area around Texas A&M University, College Station,
Texas, depicting geologic formations, airports, roads, and railroads. (Source: Bureau
of Economic Geology, The University of Texas at Austin, 1974.)
7966.indb 69 10/19/07 6:49:23 AM
© 2008 by Taylor & Francis Group, LLC
70 Environmental Site Assessment Phase I
Surface water includes lakes, rivers, ponds, creek beds, and streams. Lakes
and rivers may be located on the soil survey maps and other maps of the area
(e.g., street and topographic maps).
Ponds, creek beds, and streams are sometimes identied on topographic
maps, but they will most likely require visual conrmation. Conrmation
may be through an on‑site visit or by aerial photographs.
Most lakes are man‑made. They have been installed with a sp
ecic purpose
in mind. Although most are intended for recreation, some are used as a water
reservoir for a community. In the latter case, boating may not be allowed.
Table 4.3 Freshwater Volume from the
Hydrosphere
Ice sheets and glaciers 5,800,000 mi 85%
Groundwater 960,000 mi 14%
Lakes and reservoirs 37,000 mi 0.5%
Soil moisture 20,000 mi 0.3%
Vapors in the atmosphere 3,400 mi <0.1
River water 300 mi <0.1
Source: Heath, Ralph C.: Basic Ground‑Water
Hydrology. U.S. Geological Survey, Water‑Supply
Paper 2220, p. G‑3.
City
Shale Confining Layer
Sand and Gravel Aquifer
Water Table
Septic Tank
Underground
Storage Tank
Wellhead Protection Area
Contaminant
Migration
River
Landfills
Industrial
Impoundments
Urban Runoff
Acid Rain Recharge to
Groundwater & Surface Water
Abandoned Well
Manure Piles
Pesticides &
Fertilizers
Groundwater Flow
Municipal
Water Supply
Gasoline
Service Station
Groundwater Flow
Hazardous
Waste
Dumpsite
Figure 4.4 Hydrologic impact on the spread of contaminants. Environmental con‑
tamination is under stricter controls in the “wellhead protection areas.” (Source: Texas
Water Commission: A Wellhead Protection Area. Austin, Texas, July 1990, pp. 6–7.)
7966.indb 70 10/19/07 6:49:25 AM
© 2008 by Taylor & Francis Group, LLC
Physical Setting 71
Rivers are aboveground conduits for owing water. They vary in ow
rate and depth throughout the year, and they generally have a direction of
movement. Rivers may serve as a means for transporting contaminants to
and from a site. Industrial efuence is a major consideration, as efuent may
travel miles from its point source (e.g., an overow relief valve pouring into
the nearby river).
Creek beds are depressed, aboveground formations that connect to form
a conduit for water collection and migration. They may or may not contain
water. Some may ow over ground ssures (e.g., karst limestone) where the
water seems to disappear. These are evident where there is considerable
rainwater collection and movement. Some creek beds dry up during a dry
spell. They may, however, serve as collection basins for contaminants, even
in the absence of water.
Streams are small rivers. They usually contain water, and the water typ
‑
ically ows in one direction. It moves at various rates, depending on the
amount of water and the size of the passage. Streams may serve as a means
for transporting contaminants to and from a site. Industrial efuence is, once
again, a consideration.
Contaminants may be picked up by a body of water and transported to
other areas, or they may be dissolved and enter into the su
rface water, such
as a pond, and remain as a localized contaminant. Surface waters thus retain
or transport.
Hydrogeologic Characteristics
Hydrogeology is the study of groundwater and its associated soil and rock
formations. Because it varies in depth from a couple feet to thousands of feet
deep and has a direction of ow, groundwater may serve as another means
for chemical migration. Contamination of potable groundwater also must be
avoided. Thus, depth and usage data should be investigated as well.
Groundwater is contained within a myriad of spaces created by sand and
silt (e.g., between particles of clay, within fractures in rock, and in under‑
ground caverns). The spaces, found in subsurface openings beneath the sur‑
face of U.S. soil alone, are estimated to include a volume of 125,000 cubic
miles. Visualize a continuous cave beneath the surface of the United States,
186 feet deep. This is the expansiveness of all the subsurface openings—pre‑
dominantly groundwater, of which 14% is considered fresh, potable water.
The remaining spaces contain brackish saltwater, gas, and crude oil.
Fresh groundwater ranges from near the surface to 3,000 feet below the
surface, and the soil and rock formations may either restrict m
igration or
enhance it. The thickness of a water saturation zone may be as much as 8,500
feet (e.g., certain areas of the Mississippi Delta).
Relevant groundwater characteristics include depth, ow direction, ow
rate, and usage. This information is obtained from the state government
agency that is responsible for managing its water resources. State publica‑
7966.indb 71 10/19/07 6:49:25 AM
© 2008 by Taylor & Francis Group, LLC
72 Environmental Site Assessment Phase I
tions concerning groundwater are the most readily available, easiest to access
source for information.
Although some are identied on the soil survey maps, most well informa‑
tion is not so easily accessed. States maintain their own well maps, but these
also are incomplete. Water and gas well maps are sometimes charted on old
tax maps, and some states have transferred this information to computer
les. In Texas, these maps are maintained by the Texas State Railroad Com
‑
mission. Each state maintains its own le of registered water wells as well.
Installed private water wells around the vicinity of a site will have
records, completed by the driller, as to the depth, type of soils, water quality
and quantity, and direction of groundwater ow. Yet, this information is not
always available or complete. Reporting has not always been required and/
or enforced, and old private wells typically were not recorded. Also, when
the well logs are led, locations are sketchy at best. Some are located by gen‑
eral area (i.e., within a 1‑mile radius), and some locations are noted simply
by the name of the owner, who may have long since departed from the area.
Then, to complicate matters, information may be sparse, and an educated
guess can be sketchy at best. Only records on one well may not provide ade‑
quate or reliable data. It may have been a small pocket of water, conned
within a limited area and may not be located 10 feet away from the rst drill
hole. Well logs may be incomplete. A well that is brackish, has an unpleasant
odor, or contains a visible mineral deposit may be abandoned and no well
log completed. Yet, a state publication is the easiest, most reliable source, if
available. See Figure
4.5 for a sample of published information.
Groundwater occurs in two different zones, unsaturated and saturated.
The unsaturated zone consists of a layer of soil to a maximum depth of 1 or
2 yards and an intermediate zone that varies in thickness from a few feet
to thousands of feet. The surface soil layer supports plant growth, and the
porosity/permeability tends to be higher than that of the underlying geol‑
ogy. The intermediate zone generally has reduced porosity and permeabil‑
ity. The saturated zone consists of a capillary fringe and groundwater. The
capillary fringe is where water may rise into small pores in the rock or soil,
resulting in upward water movement of unconned groundwater.
Unconned groundwater is directly inuenced by atmospheric pressure.
Its depth is inuenced by atmospheric pressure, and the upper surface is
referred to as the “water table.” Groundwater that has restricted movement,
however, is conned within a given space. It tends to be under great pressure,
and if the conning layer is drilled into, the water will rise rapidly to the sur‑
face through the hole, which has become a pressure relief penetration into the
restricted groundwater. Its water table is at the base of the conning region.
The depth of the water table and extent of connement will have a bearing
on the chances for groundwater contamination through soil migration. The
quality and quantity will provide information as to the potential impact a
contaminant may have on the water if it were to become contaminated. Pota‑
ble water is of greater concern than brackish water, and aquifers that supply
7966.indb 72 10/19/07 6:49:25 AM
© 2008 by Taylor & Francis Group, LLC
Physical Setting 73
Figure 4.5 Table of groundwater depths. (Source: Texas Department of Water Resources: Occurrence, Availability, and Quality of Ground
Water in Travis County, Texas.
Austin, Texas, Report 276, June 1983, p. 131.)
Well
* YD-58-43-105
* 106
* 201
* 203
* 103
* 305
* 307
* 308
* 309
* 401
* 403
* 404
* 405
* 501
107
204
304
306
402
Owner
City of Austin
W. F. Robinson
Koger Properties
Fred Parsons
John Teagle
R. R. Sansom
B. F. Payton
C. J. Graves
C. R. Anderson
R. E. Joseph
John Wilder
G. B. Heath
Elmo Miertschin
North Austin State
Hospital
J. C. Campbell, Jr.
Texas Department of
Public Safety
Duggers Florist
Austin Parks
Department
Walling Estate
W. Watson
Driller
Wesley Hunt
Albert Neans
B. F. Payton
Hugh McGillvray
Texas Water Wells,
Incorporated
Date
Completed
1927
1940
1941
1920
1963
1971
1895
1962
1920
Depth
of
well
(ft)
Spring
395
Spring
400
484
750
1,456
41
22
23
23
27
33
1,975
184
353
27
Spring
442
Casing
Diam-
eter
(in.)
Depth
(ft)
5
6
6
6
30
36
36
36
36
6
10
10
5
248
150
460
41
22
23
23
27
33
300
Water
bearing
unit
Kce
Kce
Kce
Kce
Kce
Kce
Kce
Kgn,
Kgn,
Kgt
Kgt
Kgn,
Kgt
Kgn,
Kgt
Kgn,
Kgt
Kgn,
Kgt
Kcho
Kgac
Kce
Qter
Kce
Kce
Altitude
of land
surface
(ft)
675
733
740
674
721
694
633
615
640
625
600
560
540
635
675
680
650
590
718
Water Level
Below
land-
surface
datum
(ft)
93.80
174.60
126.37
152.76
151.05
21.18
56.70
28.80
24.10
4.10
18.80
20.10
25.10
15
135.06
124.60
63
12.00
181.79
182.61
Date of
measurement
Oct. 17, 1940
Feb. 4, 1940
Nov. 18, 1958
June 4, 1940
Aug. 4, 1948
July 24, 1941
Mar. 14, 1978
June 23, 1950
Dec. 28 1972
Apr. 12, 1972
do
do
do
Sept. 1941
Oct. 17, 1940
Dec. 6, 1950
Apr. 20, 1962
Apr. 20, 1971
Oct. 17, 1940
Apr. 15, 1953
Method
of
lift
Flows
C, W
Flows
C, G
N
N
N
N
J, E
Cf, G
J, E
J, E
J, E
N
C, W
N
J, E
Flows
C, W
Use
of
water
P
D
P
D, S
N
N
N
N
D
S
D, S
Irr
Irr
N
N
N
D, Irr
N
S
Remarks
Spring in Northwest Park. Measured Flow 10 gal/
min on Feb. 16, 1973.
Show of oil in the Edwards Limestone. Well D-133
in 1957 Travis County report. 3/4
Estimated yield 10 gal/min on Feb. 9, 1974.
Well D-149 in 1957 Travis County report. 4/
Well D-148 in 1957 Travis County report. 2/4/
Well D-144 in 1957 Travis County report. 2/4/
Well E-41 in 1957 Travis County report. 2/3/4/
Dug well. Well E-51 in 1957 Travis County
report. 4/
Dug well.
Do.
Do.
Do.
Destroyed. Reported flow 104 gal/min when
drilled. Stopped flowing in 1938. Well H-19 in
1957 Travis County report. 3/4/5/
Well H-22 in 1957 Travis County report. 2/4/
Cemented from 300 ft to surface. Reported draw-
dow 23 ft after pumping 24 hours at 300 gal/
min on Apr. 28, 1962. 3/
Dug well. Well H-18 in 1957 Travis County
report. 4/
Seiders Springs. Discharge: Sept. 4, 1971, 150
gal/min; June 7, 1942, 30 gal/min.
Well H-24 in 1957 Travis County report. 2/4/
Travis County—Continued
7966.indb 73 10/19/07 6:49:27 AM
© 2008 by Taylor & Francis Group, LLC
74 Environmental Site Assessment Phase I
water to thousands of people are of greater concern than a small pocket of
water supplying a single household. All these considerations must be evalu‑
ated in each assessment.
Private Wells
Public and private well water may become contaminated by chemical migra‑
tion into the ground. If a well becomes contaminated, the owners may not
suspect anything until a group of people begin to notice a trend of exces‑
sive numbers becoming ill, the taste and/or odor of the water is altered, or a
sample is taken and analyzed for a specic contaminant.
Although water quality is checked routinely, an evaluation does not
include analysis for hazardous substances unless there has been a special
request. Even then, a substance may not be identied by the laboratory
unless quantitation has been specied for that specic material. No single
test covers all hazardous chemicals. A laboratory can test for priority pol‑
lutants, heavy metals, or any given chemical that is suspected. However, it
cannot tell with just one test that there are no contaminants. Contaminated
water may go undetected for years due to the specicity required to tag a
contaminant in the drinking water. Such situations eventually are found out
about the hard way (e.g., elevated cancer rates within a community).
The quality of the water, soil types penetrated, depth to the top of the
water table, and sometimes productivity (e.g., 100 gallons per minute) are
recorded in the driller’s log. These logs are grouped and led by area. Yet,
forewarned is foretold! Clarity as to the specic location of each logged well
may be illusive. Some records pinpoint the exact site on an area map. Others
generalize to within a 100‑foot radius, sometimes up to a 1‑mile radius. Some
have even generalized as to direction and distance, “as the crow ies,” from
a town.
Aquifers
More than 50% of U.S. drinking water is supplied by aquifers.
3
An aquifer
is a water‑containing layer of rock, sand, or gravel that will yield potable
water. It may be just beneath the surface or hundreds of feet down, and the
water‑containing layer may be a few feet or hundreds of feet thick. Major
and minor aquifers are generally mapped as is the example in Figure 4.6,
and the maps are available to the public through the state agency that man‑
ages the water resources.
Aquifers are a source of drinking water either for small communities
using private wells or for municipalities (e.g., the Edwards Aquifer supplies
water to San Antonio, Texas, and surrounding areas). A sole‑source aquifer,
as dened under the Safe Drinking Water Act of 1974, is “an aquifer of criti‑
cal value as the main or only supply of drinking water for a specic area.”
Some municipalities rely solely or primarily on aquifers for their drinking
7966.indb 74 10/19/07 6:49:27 AM
© 2008 by Taylor & Francis Group, LLC
Physical Setting 75
water. Contamination of these major aquifers could, thus, have a devastating
impact on a large population.
Contaminants are difcult to remove from groundwater, and remediation
could take decades. Because groundwater remediation is the most expen‑
sive, time‑consuming form of cleanup, contamination of a major sole‑source
aquifer could have a devastating impact.
Aquifers are fed from surface water sources, cavities, and precipitation
percolating downward from the surface. The area where water percolates
from the surface to an aquifer is referred to as a recharge zone. Yet, some
areas over an aquifer do not permit easy movement from the surface down‑
ward. The geological characteristics of the ground may restrict movement.
Aquifers are typed on the basis of these characteristics.
There are three types of aquifers: (1) unconned (water table); (2) con‑
ned (artesian); and (3) leaky artesian. Each type is depicted graphically in
Figure 4.6 Major aquifers in Texas. (Source: Texas Natural Resource Conservation
Commission, 1990.)
EXPLANATION
MAJOR AQUIFERS
Ogallala
Gulf Coast
Edwards (BFZ)
Corrizo-Wilcox
Trinity
Cenozoic Pecos Alluvium
Hueco-Mesilla Bolson
Seymour
Edwards-Trinity (Plateau)
7966.indb 75 10/19/07 6:49:31 AM
© 2008 by Taylor & Francis Group, LLC
76 Environmental Site Assessment Phase I
Figure 4.7. Water table aquifers are the most sensitive. They are the easiest
to contaminate. Contaminant‑bearing water moves downward through an
unsaturated zone of soil or rock to the water table.
Groundwater monitoring wells provide early warnings as to real or
potential problems associated with these vital resources. Monitoring wells
are installed at various locations so the water can be inspected and sampled
routinely. The intent is to identify signicant changes or trends in the water
quality and/or quantity.
Figure 4.7 Depiction of types of aquifers.
7966.indb 76 10/19/07 6:49:32 AM
© 2008 by Taylor & Francis Group, LLC
Physical Setting 77
Municipal groundwater samples are analyzed for conductivity, alkalinity,
pH, trace heavy metals (e.g., arsenic), nutrients (e.g., nitrates), radioactivity,
and total organic constituents. These reports are a matter of public record,
led and maintained by state water quality control agencies.
Unknowns may, however, go undetected unless there is a reason to suspect
their presence (e.g., pesticides in agricultural areas). In other words, changes
in the water quality may go unchecked if a specic hazardous substance that
is not part of the routine analyses (e.g., pest
icides in an urban environment)
migrates into the water supply, and there was no reason to suspect its pres‑
ence (e.g., groundwater contamination from commercial activities). For this
reason, special attention should be paid in those areas where contaminants
have a high probability of impacting a major aquifer.
100‑Year Floodplain
The 100‑year oodplain refers to a demarcation of areas that have a high
probability of ooding within one hundred years. These areas are generally
cutout ravines through the property. They may serve as a means of transport
for hazardous substances at various times when the water level is up and
deposit it downstream when the bed dries.
One‑hundred‑year oodplain maps are also referred to as ood insur
‑
ance rate maps. (See Figure 4.8.) Flood insurance rate maps are published
by the Federal Emergency Management Agency (FEMA) and are available
for all U.S. property, incorporated and unincorporated. You can write to the
address below to obtain their maps:
Federal Emergency Management Agency
Flood Map Distribution Center
6930 (A‑F) San Tomas Road
Baltimore, MD 21227‑6227
Maps may also be obtained from city planning departments. More recent
FEMA proposed updates are available on the FEMA Web site and sometimes
on county Web sites. County Web sites may have additional area ood infor‑
mation as well. (See Figures 4.9 and 4.10.)
Inuences and Relationships
The primary concern in determining the potential impact of hazardous mate‑
rials on an environment is contamination of the water sources that people so
rely upon. Depletion or poisoning of the water supplies is to be avoided.
Sources of contamination include polluted surface waters, land disposal
of solid or liquid wastes, stockpiled materials leaching into the ground, hold‑
ing ponds and lagoons (e.g., brine associated with the oil industry), leaking
sewer lines, leaking septic tanks, leaking underground storage tanks and/or
pipelines, spills, industrial waste, exploratory wells and shafts, graveyards,
7966.indb 77 10/19/07 6:49:33 AM
© 2008 by Taylor & Francis Group, LLC
78 Environmental Site Assessment Phase I
ZONE B
ZONE
A10
ZONE B
ZONE B
ZONE C
ZONE B
Creek
Creek
Cree
k
58
8
59
0
59
2
585
58
3
58
1
ZONE B
RM 48-05
NE B
ZONE A4
57
4
57
3
575
Figure 4.8 A 100‑year oodplain map (ood insurance rate map), depicting Zone A
(areas of 100‑year ood), Zone B (100‑year to 500‑year ood), quarry, airport, roads,
buildings, and ood elevations
7966.indb 78 10/19/07 6:49:35 AM
© 2008 by Taylor & Francis Group, LLC
Physical Setting 79
Figure 4.9 Published Comal County ood photos of areas previously considered
above the 100‑year oodplain. Many areas ooded that were above the 100‑year
ood zone, and houses oated down the river in 1998 and in 2002. As of 2007, the
ood insurance rate maps had yet to be changed to reect the ood‑prone areas. The
proposed maps were available only on the FEMA and some county ood maps.
7966.indb 79 10/19/07 6:49:37 AM
© 2008 by Taylor & Francis Group, LLC
80 Environmental Site Assessment Phase I
Figure 4.10 Web site publication of existing and proposed 100‑year ood zones. Area in Comal County that had ooding above the
ood zones in 1998 and 2002.
SUMMIT
4854630090C
R
OCKY
TOP RANCH
MOUNT
AIN
V
ALLEY
RIVER
RU
N
Sattler
RIVER
RIVER GA
TE
MARKET HT
S
SA
TTLER
EMERALD FORES
T
PLA
TE
AU
RD
G
PE
AC
H
TREES
WA
LNUT
VA
LLE
Y
CHERR
Y
HANO
VER
GU
AD
ALUPE
PECAN
RO
W
4854630085C
Mapped in1998
7966.indb 80 10/19/07 6:49:38 AM
© 2008 by Taylor & Francis Group, LLC
Physical Setting 81
Figure 4.10 Continued.
SUMMIT
4854630090C
R
OCKY
TO
P RANCH
MOUNT
AIN
V
ALLEY
RIVER
RU
N
Sattler
RIVER
RIVER GA
TE
MARKET HTS
SA
TTLER
EMERALD FORES
T
PLA
TE
AU
RD
G
PE
AC
H
TREES
WA
LNUT
VA
LLE
Y
CHERR
Y
HANO
VER
GU
AD
ALUP
E
PECAN
RO
W
4854630085C
48091C0260F
Mapped in 2002
7966.indb 81 10/19/07 6:49:39 AM
© 2008 by Taylor & Francis Group, LLC
82 Environmental Site Assessment Phase I
de‑icing salt for roads, animal feedlots, fertilizers and pesticides, sumps and
dry wells, and agricultural drainage holes. Contamination may migrate from
municipal landlls, spills around railroad tracks and roads, illegal dumping
of waste, and streams containing hazardous substances.
Improper closure, or discontinued use and abandonment, of under‑
ground storage tanks, water wells, and/or oil/gas wells can provide another
avenue for contaminating the groundwater with hazardous substances. The
methods of choice for well closure are lling the void with a specialized oil
mud (a gel‑like material) or with bentonite cement.
Groundwater quality may be endangered if an abandoned well connects
with another source of drinking water. An abandoned well may become a
receptacle for hazardous waste or human excrement. Failure to properly
seal the abandoned water well may result in contamination of an adjacent
water source. People who construct a replacement well often attempt to save
money by not properly closing, or plugging, the old well. They don’t real‑
ize, however, that the new well, their source of drinking water, may become
contaminated by the old one, which may be as far as a quarter of a mile away
from the new well.
Septic tank pollution occurs when a drain eld receives more water from
the septic tank than it is designed to lter; the soil can no longer provide the
ltration needed for removal of nitrates, phosphates, and pathogens; or the
hazardous substances are part of the wastewater. If the drain eld becomes
saturated, liquid wastes migrate downward toward the groundwater and
surface on the ground above the drain eld. This is called efuent, untreated
wastewater. It still contains large amounts of bacteria, which are associated
with a foul odor and potential pathogens.
Automotive service stations generate waste during daily operations:
spilled gasoline, automotive uids (e.g., motor oil, transmission uid, brake
uid), coolants from radiators, and solvents for cleaning parts (e.g., degreas
‑
ing uids). These wastes are disposed of through several means, both legal
and illegal. They should be sent to a recycling plant, but they do not always
get that far. The waste might be disposed of in an abandoned well, down
a latrine hole, in a storm sewer, or into a pit. Some operators have simply
dumped drums of waste on someone else’s pasture land.
There is no end to the possibilities and the complex nature in the relation‑
ship between the physical setting and migration of hazardous substances. The
investigator must manipulate, speculate about, and consider all possibilities.
Many of the research methodologies for investigating the possibilities that
a hazardous substance does pose a threat are discussed in this book. They
should serve as tools and must not restrict other avenues of investigation.
Summary
A property is not an entity unto itself. It impacts and is impacted by all that
is around it. The physical setting must be claried in order to determine the
7966.indb 82 10/19/07 6:49:39 AM
© 2008 by Taylor & Francis Group, LLC
Physical Setting 83
potential impact of one property on another or to project the possibilities for
existing soil contaminants to migrate from the surface to potable groundwa‑
ter, which is ultimately that which must be protected.
A minimum property conditions assessment, as recommended by the
ASTM protocol, includes the following:
Topography
Geology
Hydrology
Hydrogeology
Concerns and the depth of this portion of the assessment become more important
with increased possibilities of site contamination. Be aware of the possibilities!
References
1. Werchan, Leroy E., and John L. Coker: Soil Survey of Williamson County Texas.
Soil Conservation Service, U.S. Department of Agriculture, 1980.
2. Heath, Ralph C.: Basic Ground‑Water Hydrology
. U.S. Geological Survey,
Water‑Supply Paper 2220, p. 1.
3. U.S. EPA: A Summary of the New Regulations for Underground Storage Tanks
. Wash‑
ington, DC, Sept. 1988.
4. The Underground Subject
. [Product Bulletin], Texas Water Commission, 1989, pp.
4–7.
•
•
•
•
7966.indb 83 10/19/07 6:49:39 AM
© 2008 by Taylor & Francis Group, LLC