báo cáo khoa học: " Characterization of PR-10 genes from eight Betula species and detection of Bet v 1 isoforms in birch pollen" pot
Bạn đang xem bản rút gọn của tài liệu. Xem và tải ngay bản đầy đủ của tài liệu tại đây (739.2 KB, 15 trang )
BioMed Central
Page 1 of 15
(page number not for citation purposes)
BMC Plant Biology
Open Access
Research article
Characterization of PR-10 genes from eight Betula species and
detection of Bet v 1 isoforms in birch pollen
Martijn F Schenk*
1,2
, Jan HG Cordewener
1
, Antoine HP America
1
,
Wendy PC van't Westende
1
, Marinus JM Smulders
1,2
and Luud JWJ Gilissen
1,2
Address:
1
Plant Research International, Wageningen UR, Wageningen, the Netherlands and
2
Allergy Consortium Wageningen, Wageningen UR,
Wageningen, the Netherlands
Email: Martijn F Schenk* - ; Jan HG Cordewener - ; Antoine HP America - ;
Wendy PC van't Westende - ; Marinus JM Smulders - ;
Luud JWJ Gilissen -
* Corresponding author
Abstract
Background: Bet v 1 is an important cause of hay fever in northern Europe. Bet v 1 isoforms from
the European white birch (Betula pendula) have been investigated extensively, but the allergenic
potency of other birch species is unknown. The presence of Bet v 1 and closely related PR-10 genes
in the genome was established by amplification and sequencing of alleles from eight birch species
that represent the four subgenera within the genus Betula. Q-TOF LC-MS
E
was applied to identify
which PR-10/Bet v 1 genes are actually expressed in pollen and to determine the relative
abundances of individual isoforms in the pollen proteome.
Results: All examined birch species contained several PR-10 genes. In total, 134 unique sequences
were recovered. Sequences were attributed to different genes or pseudogenes that were, in turn,
ordered into seven subfamilies. Five subfamilies were common to all birch species. Genes of two
subfamilies were expressed in pollen, while each birch species expressed a mixture of isoforms
with at least four different isoforms. Isoforms that were similar to isoforms with a high IgE-
reactivity (Bet v 1a = PR-10.01A01) were abundant in all species except B. lenta, while the
hypoallergenic isoform Bet v 1d (= PR-10.01B01) was only found in B. pendula and its closest
relatives.
Conclusion: Q-TOF LC-MS
E
allows efficient screening of Bet v 1 isoforms by determining the
presence and relative abundance of these isoforms in pollen. B. pendula contains a Bet v 1-mixture
in which isoforms with a high and low IgE-reactivity are both abundant. With the possible exception
of B. lenta, isoforms identical or very similar to those with a high IgE-reactivity were found in the
pollen proteome of all examined birch species. Consequently, these species are also predicted to
be allergenic with regard to Bet v 1 related allergies.
Background
Birch trees grow in the temperate climate zone of the
northern hemisphere and release large amounts of pollen
during spring. This pollen is a major cause of Type I aller-
gies. The main birch allergen in northern Europe is a
pathogenesis-related class 10 (PR-10) protein from the
Published: 3 March 2009
BMC Plant Biology 2009, 9:24 doi:10.1186/1471-2229-9-24
Received: 9 July 2008
Accepted: 3 March 2009
This article is available from: />© 2009 Schenk et al; licensee BioMed Central Ltd.
This is an Open Access article distributed under the terms of the Creative Commons Attribution License ( />),
which permits unrestricted use, distribution, and reproduction in any medium, provided the original work is properly cited.
BMC Plant Biology 2009, 9:24 />Page 2 of 15
(page number not for citation purposes)
European white birch (Betula pendula) termed Bet v 1
[1,2]. Pollen of other Fagales species contains PR-10
homologues that share epitopes with Bet v 1 [3], as do sev-
eral fruits, nuts and vegetables [4-7]. An IgE-mediated
cross-reaction to these food homologues causes the so-
called oral allergy syndrome (OAS) [8,9]. PR-10 proteins
constitute the largest group of aeroallergens and are
among the four most common food allergens [10].
The genus Betula encompasses over 30 tree and shrub spe-
cies that are found in diverse habitats in the boreal and
temperate climate zone of the Northern Hemisphere. The
taxonomy of the Betula genus is debated, as is the number
of recognized species. The genus is either divided into
three, four or five groups or subgenera [11-13]. B. pendula
occurs in Europe and is the only species whose relation to
birch pollen allergy has been extensively investigated.
Sensitization to birch pollen is also reported across Asia
and North America, where B. pendula is not present
[14,15]. Other Betula species occur in these areas, but their
allergenic potency is unknown. Betula species may vary in
their allergenicity as variation in allergenicity has been
found among cultivars of apple [16-18], peach and nectar-
ine [19], and among olive trees [20].
PR-10 proteins are present as a multigene family in many
higher plants, including Gymnosperms as well as Mono-
cots and Dicots [21-23]. The classification as PR-proteins
[24] is based on the induced expression in response to
pathogen infections by viruses, bacteria or fungi [25-27],
to wounding [28] or to abiotic stress [29,30]. Some mem-
bers of the PR-10 gene family are constitutively expressed
during plant development [31] or expressed in specific tis-
sues [23]. Multiple PR-10 genes have been reported for B.
pendula as well [32]. mRNAs of these genes have been
detected in various birch tissues, including pollen
[1,33,34], roots, leaves [28,30], and in cells that are grown
in a liquid medium in the presence of microbial patho-
gens [27]. PR-10 genes share a high sequence similarity
and form a homogeneous group. Homogeneity is
believed to be maintained by concerted evolution [35].
Arrangements of PR-10 genes into clusters, such as found
for Mal d 1 genes in apple, may facilitate concerted evolu-
tion [22].
Several Bet v 1 isoforms have been described for B. pendula
[1,32-34,36], including both allergenic and hypoaller-
genic isoforms [37]. Individual B. pendula trees have the
genetic background to produce a mixture of Bet v 1 iso-
forms with varying IgE-reactivity [32]. The relative abun-
dance of individual isoforms at the protein level will
influence the allergenicity of the pollen. Molecular masses
and sequences of tryptic peptides from Bet v 1 can be
determined by Q-TOF MS/MS [38]. The recently devel-
oped Q-TOF LC-MS
E
method enables peptide identifica-
tion, but has the additional advantage of being able to
determine relative abundances of peptides in a single run
[39]. By quantifying isoforms with a known IgE-reactivity
[37], the allergenicity of particular birch trees can be pre-
dicted. The existence of allergenic and hypoallergenic iso-
forms indicates that PR-10 isoforms vary in allergenicity,
and some PR-10 isoforms do not bind IgE at all. This has
already been demonstrated for two truncated Bet v 1 iso-
forms [33]. Therefore, not all PR-10 isoforms are necessar-
ily isoallergens.
Knowledge on the allergenicity of birch species may facil-
itate selection and breeding of hypoallergenic birch trees.
To investigate the presence and abundance of Bet v 1 iso-
forms in Betula species that are potential crossing mate-
rial, we: (I) cloned and sequenced PR-10 alleles from eight
representative Betula species to detect PR-10 genes at the
genomic level, (II) applied Q-TOF LC-MS
E
to identify the
pollen-expressed Bet v 1 genes, (III) determined relative
abundances of isoforms in the pollen proteome, and (IV)
compared these isoforms to isoforms with a known IgE-
reactivity.
Results
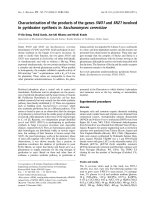
This study encompasses several experimental and analyti-
cal steps, involving both genomics and proteomics. All
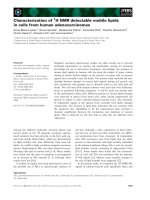
main steps have been summarized in Fig. 1.
PR-10 subfamilies
We examined eight Betula species for the presence of PR-
10 genes by sequencing 1029 individual clones in both
directions (Table 1). Sequences that contained PCR arti-
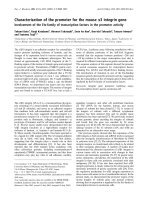
Study workflow diagramFigure 1
Study workflow diagram. This diagram gives an overview
of the experimental steps (green boxes) and analyses (white
boxes) performed in this study.
Ͳ
Ͳ
Ͳ
Ͳ
Ͳ
Ͳ
BMC Plant Biology 2009, 9:24 />Page 3 of 15
(page number not for citation purposes)
facts were excluded by combining information from inde-
pendent PCRs. The Open Reading Frames (ORF) of the
sequences were highly conserved, making the alignment
straightforward. The consensus sequence of the exon had
452 positions excluding the 31 bps in the primer regions.
228 out of the 274 variable consensus positions were phy-
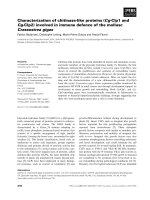
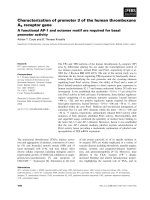
logenetically informative. The sequences grouped into
seven well-supported clusters in the Neighbor Joining
(NJ) tree (Fig. 2). Five clusters coincided with the division
between subfamilies as found in B. pendula [32]. Two new
subfamilies (06 and 07) were identified, which occurred
only in two species, contrary to the previously described
subfamilies 01 to 05 that were found in all species (Table
1). In all sequences, an intron was located between the
first and second nucleotide of codon 62. This intron was
highly variable in length and composition, which was an
additional characteristic for inferring the proper sub-
family. Intron sequences were excluded from the phe-
netic/phylogenetic analysis because introns evolve at a
different speed compared to exons.
PR-10 sequences and genes
We recovered 12 to 25 unique PR-10 sequences per spe-
cies, adding up to 146 sequences in total (Table 1). Out of
the 134 unique sequences, over 100 sequences have never
been described before. B. pendula, B. plathyphylla and B.
populifolia are closely related members of the subgenus
Betula and consequently had multiple alleles in common.
These species shared one allele with B. costata, which is
another member of the subgenus Betula. We applied a pre-
defined cut-off level of 98.5% to attribute all sequences to
different genes, while allowing maximally two alleles per
gene per species. These criteria coincided in the majority
of cases, but several genes of B. chichibuensis in the large
cluster in subfamily 03 and of B. lenta in subfamily 02,
and the genes 02A/02B and 03C/03D in B. pendula were
more than 98.5% similar. Table 1 shows the total number
of identified PR-10 genes per species. Out of the 13 genes
that have previously been identified in B. pendula (Table
1; Fig. 2), 11 genes were recovered from the newly
sequenced B. pendula cultivar 'Youngii'. This study identi-
fied no new genes in this cultivar. This indicates that the
majority of genes has been recovered by sequencing over
100 clones per species, and that only a small number of
genes might be missing in the dataset.
Homologues of the PR-10 genes of B. pendula were identi-
fied in B. populifolia and B. plathyphylla. Sequences from
these species were labeled according to the procedure
described by Gao et al. [22] that was previously used for B.
pendula [32]. These labels consist of the subfamily's
number, followed by a letter for each distinct gene, then a
number for each unique protein variant and an additional
number referring to silent mutations. When applicable,
an additional letter indicates variations in the intron. The
PR-10 genes in B. costata displayed a considerable degree
of homology to the genes in B. pendula, but differentiating
homologues and paralogues was not always possible. It
was not possible to differentiate between homologues
and paralogues of the PR-10 genes in B. lenta, B chichibuen-
Table 1: Number of identified PR-10 sequences in nine birch species.
Species Number of
sequenced
clones
Subfamily 01 Subfamily 02 Subfamily 03 Subfamily 04 Subfamily 05 Subfamily 06 Subfamily 07 Total
Seqs Genes Seqs Genes Seqs Genes Seqs Genes Seqs Genes Seqs Genes Seqs Genes Seqs Genes
Subgenus Betu-
laster:
B. nigra 155 10643742121 25 15
Subgenus Neu-
robetula:
B. chichibuensis 170 5432107111122 - -22 17
B. schmidtii 184 3232111111221112 10
Subgenus Betu-
lenta:
B. lenta 106 3232441121- - 1114 11
Subgenus Betula:
B. costata 103 9832551121 20 17
B. pendula 102 5322542121 16 11
B. plathyphylla 103 6443632121 20 12
B. populifolia 106 4442532121 17 11
B. pendula
reference*
2
- -4-3-4-1-1 13
The number of clones sequenced in both directions and the number of identified sequences and genes are shown per species.
1
Subfamily 01 to 05 were previously identified
[
32], while subfamily 06 and 07 are new. Homology to mRNA sequences suggests that subfamily 01 and 02 are expressed in pollen.
*1 Species were diploid (2n) as measured by flow cytometry. The identification of alleles of a single gene is based on the criterion of having > 98.5% sequence similarity, and by
allowing maximally two alleles per gene.
*2 Genes identified in B. pendula [
32].
BMC Plant Biology 2009, 9:24 />Page 4 of 15
(page number not for citation purposes)
Grouping of PR-10 sequences into subfamiliesFigure 2
Grouping of PR-10 sequences into subfamilies. Clustering of the PR-10 sequences from eight Betula species in a Neigh-
bor Joining tree with Kimura two-parameter distances. The sequences group into seven subfamilies. Bootstraps percentages on
the branches indicate support for these groups.
BMC Plant Biology 2009, 9:24 />Page 5 of 15
(page number not for citation purposes)
sis, B. nigra, and B. schmidtii. Rather than developing a sep-
arate denomination scheme for each species, we labeled
sequences with the PR-10 subfamily number, followed by
a number for each unique protein variant and an addi-
tional number referring to silent mutations. This facili-
tates the protein analysis which distinguishes protein
variants rather than separate alleles or genes.
The PR-10 gene copy number varied between different
birch species. This is caused by evolutionary processes
such as duplication, extinction, and recombination. The
overall clustering pattern appears to reflect a combination
of such events. Genes from the same species tend to group
close to each other on several positions in the NJ tree (Fig.
2). Examples are the clusters of highly similar sequences
from B. costata in subfamily 01 and from B. chichibuensis
in subfamily 03, which either reflect unequal crossing-
over, gene conversion or duplication events. The B. popu-
lifolia genome harbors two clear examples of unequal
crossing-over. Allele 01E01.01 is a recombination
between the 01A gene and the 01B gene. The first part
matches exactly to allele 01A01.01, while the second part
differs by 1 SNP from 01B01.01 with position 267 of the
ORF as the point of recombination. Both original genes
were also present. Similarly, allele 03E01.01 is a recombi-
nation between the 03B gene and the 03D gene. In this
case, the recombination probably occurred without gene
duplication, since the original 03B gene, as present in B.
pendula, was absent.
PR-10 protein predictions
Not all PR-10 alleles will be expressed as a full-sized pro-
tein. 112 unique sequences had an intact ORF, while the
remaining 22 sequences contain early stop codons or
indels in the ORF that result in frame shifts followed by an
early stop codon. The latter sequences were denoted as
pseudogenes, although it cannot be excluded that these
sequences produce truncated proteins. We calculated K
a
/
K
s
ratios within each subfamily. The suspected pseudo-
genes displayed higher K
a
/K
s
ratios than the alleles with an
intact ORF in the subfamilies 01, 02 and 03 (Table 2). This
points to an alleviated selection pressure in the pseudo-
genes. The other PR-10 subfamilies do not contain suffi-
cient numbers of both genes and pseudogenes to perform
this comparison. The majority of sequences had 5' splic-
ing sites of AG:GT and 3' splicing sites of AG:GC, AG:GT
or AG:GA, which is in concordance with known motifs for
plant introns. Notable exceptions were: an AC:GT (B.
schmidtii, 01pseudo04) and an AG:AT (B. nigra,
04var05.01a) 5' splicing site, an AC:GC (B. schmidtii,
01pseudo04) and a TG:GC (B. nigra, 02pseudo04) 3'
splicing site, and two deletions (B. costata, 01pseudo05
and 02pseudo01) at the 3' end of the intron. Except for
the AG:AT splicing site, all exceptions belonged to
sequences that were denoted as pseudogenes, providing
additional evidence for these designations.
Depending on the subfamily, K
a
/K
s
ratios ranged from
0.09 to 0.36 for sequences with an intact ORF (Table 2),
indicating strong purifying selection. The PR-10 alleles in
birch encode a putative protein that consists of 160 amino
acids, yielding a relative molecular mass of approximately
17 kDa. The only exception is 01var17.01 in B. chichibuen-
sis, which contains an indel that results in the deletion of
two amino acids. The allelic variation is lower at the pro-
tein level than at the nucleic acid level, which is consistent
with the low K
a
/K
s
ratios. Hence, the 112 unique genomic
sequences encode 80 unique isoforms. The PR-10.05 gene
is an extreme example for which only four putative iso-
forms are predicted, despite the presence of 14 allelic var-
iants. One of these isoforms is predicted in all species
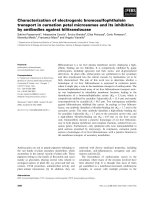
except B. nigra. Parts of the PR-10 protein sequences are
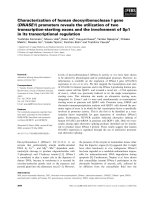
highly conserved, as is demonstrated in the amino-acid
alignment of five PR-10 isoforms (one per subfamily)
from B. pendula (Fig. 3). The most prominent region lies
between Glu
42
and Ile
56
and contains only a single amino
acid variation among all 80 isoforms. A phosphate-bind-
ing loop with the sequence motive GxGGxGx character-
izes this region. Additional conserved Glycine residues are
present at positions 88, 89, 92, 110 and 111.
Table 2: Sequence conservation within subfamilies of the PR-10 family among eight Betula species.
Subfamily 01 02 03 04 05 06 07
Sequences with an intact ORF
n = 33 193961401
K
a
/K
s
ratio 0.18 0.27 0.10 0.36 0.09 n. d. n. d.
Range substitutions 0 – 16 0 – 9 0 – 8 0 – 6 0 – 4 n. d. n. d.
Average # substitutions 7.0 3.1 2.8 3.3 0.9 n. d. n. d.
Pseudogene sequences
n = 9 530041
K
a
/K
s
ratio 0.38 0.30 0.20 n. d. n. d. 0.57 n. d.
n = number of unique sequences. K
a
/K
s
ratio = ratio between non-synonymous and synonymous mutations. Range substitutions = minimum and
maximum number of amino acid substitutions in pair wise comparisons between sequences of the same subfamilies. n. d. = not determined.
BMC Plant Biology 2009, 9:24 />Page 6 of 15
(page number not for citation purposes)
Bet v 1 expression in pollen
The presence of Bet v 1-like proteins was examined in pol-
len of B. nigra, B. chichibuensis, B. lenta, B. costata and B.
pendula 'Youngii'. Pollen proteins were solubilized in an
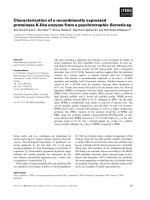
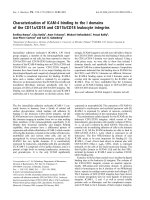
aqueous buffer and analyzed by SDS-PAGE. Each sample
displayed an intense protein band after CBB-staining at
the expected molecular mass of Bet v 1, between 16–18
kDa (Fig. 4), while other intense bands were visible at 28
kDa and 35 kDa. No 16–18 kDa band was visible when
the pellet that remained after extraction was separated by
SDS-PAGE (not shown), indicating the efficiency of the
extraction procedure with regard to Bet v 1.
To establish the identity of the proteins in the 16–18 kDa
band, we cut out this band from the lane of B. pendula
(Fig. 4) and performed in-gel digestion with trypsin. Q-
TOF LC-MS/MS analysis of the tryptic peptides yielded
multiple Bet v 1 isoforms (details given below). The bands
just above and below the 16–18 kDa band were also
sequenced and checked for the presence of Bet v 1. The
lower band at 14 kDa contained birch profilin (Bet v 2;
GenBank AAA16522
; 2 peptides, coverage 24%) and con-
tained no Bet v 1 fragments. The higher band at 19 kDa
contained birch cyclophilin (Bet v 7; CAC841116; 3 pep-
tides, coverage 28%) and some minor traces of Bet v 1 (Bet
v 1a; CAA33887; 1 peptide, coverage 14%). Bollen et al.
[4] detected a band of ~35 kDa when purified Bet v 1 was
analyzed by SDS-PAGE, consisting of (dimeric) Bet v 1.
We identified the intense band at ~35 kDa in our B. pen-
dula extract as isoflavone reductase (Bet v 6; GenBank
AAG22740
; 19 peptides, coverage 49%) and detected no
Bet v 1 fragments in this band.
Analysis of Bet v 1 isoforms by Q-TOF LC-MS
E
The tryptic digests of the 16–18 kDa bands were examined
in detail to elucidate the expression of separate Bet v 1 iso-
forms in pollen. Trypsin cleaves proteins exclusively at the
C-terminus of Arginine and Lysine. Fig. 3 shows an exam-
ple of the fragments I to XVII that are theoretically formed
after tryptic digestion of isoforms from the subfamilies 01
to 05. Isoforms of different subfamilies can be discrimi-
nated by several fragments on the basis of peptide mass
and sequence. The number of discriminating fragments
becomes lower for Bet v 1 isoforms within a subfamily. A
new mass spectrometric technique called Q-TOF LC-MS
E
allows simultaneous identification and quantification of
peptides (see Method section for details). A distinct fea-
ture of the LC-MS
E
procedure is that information is
obtained for all peptides. This contrasts MS/MS, in which
a subset of peptides is selected for fragmentation. A soft-
ware program analyses the data, while using a search data-
base for interpretation of the fragmentation spectra. This
Alignment of theoretical tryptic peptides of PR-10 proteins in B. pendula 'Youngii'Figure 3
Alignment of theoretical tryptic peptides of PR-10 proteins in B. pendula 'Youngii'. For clarity, one amino acid
sequence is shown per subfamily. Only those fragments that are large enough to be detected by Q-TOF LC-MS/MS are labeled.
Variable amino acids are marked in black.
Fragment
I III IV
position 1-17 21-32 33-55
01A01 I
a
:(M)GVFNYETETTSVIPAAR LFK III
a
: AFILDGDNLFPK IV
a
: VAPQAISSVENIEGNGGPGTIK(K)
02A01 I
j
:(M)GVFNYESETTSVIPAAR LFK III
e
: AFILDGDNLIPK IV
a
: VAPQAISSVENIEGNGGPGTIK(K)
03A02 I
z
:(M)GVFDYEGETTSVIPAAR LFK III
e
: AFILDGDNLIPK IV
z
: VAPQAVSCVENIEGNGGPGTIK(K)
04 01 I
y
:(M)GVFNDEAETTSVIPPAR LFK III
z
: SFILDADNILSK IV
x
: IAPQAFK SAENIEGNGGPGTIK(K)
05 01 I
x
:(M)GVFNYEDEATSVIAPAR LFK III
y
: SFVLDADNLIPK IV
v
: VAPENVSSAENIEGNGGPGTIK(K)
V
VII VIII
56-65 69-80 81-97
01A01 V
a
: ISFPEGFPFK YVK VII
a
:(DR)VDEVDHTNFK VIII
a
: YNYSVIEGGPIGDTLEK ISNEIK
02A01 V
e
: ITFPEGSPFK YVK VII
k
:(ER)VDEVDHANFK VIII
k
: YSYSMIEGGALGDTLEK ICNEIK
03A02 V
e
: ITFPEGSPFK YVK VII
z
:(ER)IDEVDHVNFK VIII
z
: YSYSVIEGGAVGDTLEK ICNEIK
04 01 V
z
: ITFVEGSHFK HLK VII
y
:(QR)IDEIDHTNFK VIII
y
: YSYSLIEGGPLGDTLEK ISK EIK
05 01 V
y
: ITFPEGSHFK YMK VII
x
:(HR)VDEIDHANFK VIII
x
: YCYSIIEGGPLGDTLEK ISYEIK
X
XVI XVII
104-115 138-145 146-159
01A01 X
a
: IVATPDGGSILK ISNK YHTK GDHEVK AEQVK ASK XVI
a
: EM GETLLR XVII
a
: AVESYLLAHSDAYN
02A01 X
g
: LVATPDGGSILK ISNK YHTK GDHEMK AEHMK AIK XVI
b
:(EK)GETLLR XVII
a
: AVESYLLAHSDAYN
03A02 X
z
: IVAAPGGGSILK ISNK YHTK GNHEMK AEQIK ASK XVI
z
:(EK)AEALFR XVII
a
: AVESYLLAHSDAYN
04 01 X
y
: IAAAPDGGSILK FSSK YYTK GNISINQEQIK AEK XVI
y
:(EK)GAGLFK XVII
z
: AIEGYLL???????
05 01 X
x
: IVAAPGGGSILK ITSK YHTK GDISLNEEEIK AGK XVI
x
:(EK)GAGLFK XVII
x
: AVENYLVAHPNAYN
BMC Plant Biology 2009, 9:24 />Page 7 of 15
(page number not for citation purposes)
database contained the sequence information of all PR-10
isoforms described in this paper and of previously
described PR-10 isoforms from B. pendula [32].
The LC-MS
E
results indicated that PR-10 proteins of sub-
family 01 and 02 are expressed in the pollen of the five
examined birch species. We found no evidence for the
expression of genes from subfamilies 03 to 07 in pollen.
For example, we identified 22 Bet v 1 peptide fragments in
B. pendula (Table 3), all of which were predicted from the
gDNA sequences. Eight detected peptides could distin-
guish between isoforms of subfamily 01 and 02. The B.
pendula genome contains seven genes from subfamily 01
and 02. The expression of four of these (01A, 01B, 01C,
02C) was confirmed (Table 3). Sequence coverage of the
expressed isoforms amounted to 71 to 79% (Table 3).
Four peptides were specific for isoform 01B01, while one
peptide was specific for isoform 02C01. Two peptides
were specific for both isoforms of gene 01A, while two
others were specific for both isoforms of gene 01C. Iso-
forms 02A01 and 02B01 could not be separated, so either
one or both of them are expressed. Table 3 also shows the
peptide fragments that were long enough to be detected in
the tryptic digest, but were not observed. Information on
absent fragments can be used to exclude expression of par-
ticular isoforms, such as isoform 01D01 in B. pendula.
Altogether, at least 4 to 6 isoforms were expressed in each
of the five examined species. In total, the presence of
unique peptides confirmed the expression of 14 isoforms
among the five species in total (Table 3). An additional 15
isoforms lacked one or more unique peptides to distin-
guish them from other isoforms or from each other, but
several of these must be expressed. The expression of five
isoforms was ruled out, because multiple unique peptides
from these variants were lacking from the peptide mix-
ture. Two identified peptides in B. costata and one peptide
from B. nigra did not match to any sequence that was
recovered from these species. These peptides belong to
"unknown isoforms" (Table 3) and this indicates that the
sequences that encode these isoforms are missing from
the dataset. Finally, conflicting evidence was found for
expression of the isoforms 01var10 and 01var11 in B.
lenta. Two peptides that were unique for these isoforms
were detected, while three peptides that were expected if
the isoforms would be expressed were lacking. Expression
of an allele that is missing from our dataset is a more
likely explanation than the expression of 01var10 or
01var11.
Quantification by Q-TOF LC-MS
E
We determined the relative amounts of individual Bet v 1
isoforms in pollen from B. pendula 'Youngii' (Table 4).
This information can be deduced from the peak intensi-
ties of Bet v 1 peptides in the tryptic digest. Not all identi-
fied fragments can be used for quantification, because the
peak detection algorithm groups peaks with highly similar
masses and retention times together, also when they
might belong to different fragments. For example, frag-
ment I
a
(1854,91 Da) and VII
a
(1854,89 Da) have a reten-
tion time that is marginally different, causing a strong
overlap in peak area. The relative amounts of two iso-
forms could be estimated directly: peptide III
f
is unique
for isoform 02C01 and comprises 17% of all fragment III-
variants, while peptides III
b
and X
b
are unique for 01B01
and comprise 18–19% of all fragment III and X-variants.
The isoforms 02A01 and 02B01 could not be separated,
but together they comprise 13% of the mixture based on
fragment III
e
. The relative amounts of the other isoforms
were estimated indirectly. Isoform 01A06 and 01B01
share fragment V
b
, which comprises 23% of all fragment
V-variants. 01A06 is thus estimated to comprise 4–5% of
the mixture. The ratio between 01B01 and 01C04 plus
01C05 can be deduced from fragment I
b
. 01C04 plus
01C05 are thus estimated to comprise 6% of the mixture.
This leaves 40–41% of the total amount of Bet v 1 for iso-
form 01A01.
Isoform 01A01 is identical to isoform Bet v 1a, which had
the highest IgE-reactivity in several tests performed by Fer-
reira et al. [37]. Pollen of B. costata, B. nigra and B. chich-
ibuensis contained isoforms that are highly similar to Bet v
1a and differ by only 1–3 amino acids from this isoform.
We determined the expression of individual Bet v 1 iso-
SDS-PAGE analysis of birch pollen extractsFigure 4
SDS-PAGE analysis of birch pollen extracts. (Lane 1) B.
chichibuensis, (2) B. costata, (3) B. nigra, (4) B. lenta and (5) B.
pendula. Bands of allergens that were analyzed and identified
with Q-TOF LC-MS/MS are indicated by arrows. (M) LMW
size marker proteins.
Bet v 6
Bet v 7
Bet v 1
Bet v 2
14.4
21.5
31
45
66
97 kDa
6.5
BMC Plant Biology 2009, 9:24 />Page 8 of 15
(page number not for citation purposes)
Table 3: Peptides fragments of PR-10 isoforms in pollen from five Betula species as identified by Q-TOF LC-MS
E
.
Species Fragment I III IV V VII VIII X XVI XVII Sequence coverage
Isoform Gene *
2
B. pendula 01A01 1A A a a aa A a? a a79%
01A06 1A A a a ba A a? a a79%
01B01 1B BB a ba CBa a79%
01C04 1C D a a aa D c? a a71%
01C05 1C D a a aa D c? a a71%
01D01 1D (E) a a (C) (C) (E) a? a a-
02A01 2A j eaekkg?(B*
3
) a74%
02B01 2B j eaekkg?(c*
3
) a74%
02C01 2C jF aekka? (c*
3
) a74%
03 *
1
(C), (z) e (z), (Y) e (Z), (y)(z), (Y) (z), (Y) (z) a-
04 *
1
(Y) (Z) (X), (W) (Z) (X) (X) (X) (Y) (Z), (Y) -
05 *
1
(X) (Y) (V) (Y) (W) (W) (W) (X) (X) -
B. chichibuensis 01var09 1A aa a aa d a? a a79%
01var12 1B C a a aa d a? a a79%
01var17 1C aa a a H(H)c? a a-
01var18 1C aa a a H dc?aa71%
01var19 1D (E) a a (C) (J) (E) a? a a-
02var03 2A j e B e kka? (c*
3
) a 74%
02var08 2B j F aekka? (c*
3
) a 74%
B. costata 01var01 1A F a a aa c a a a79%
01var02 1B aa a aa c a a a79%
01var04 1C a (C) a b (E) c (D) a a-
01var05 1D aa a ba c (E) a a71%
01var13 1E D a a aa D a a a79%
Unknown E ?
02var05 2A j (J) aekka (c*
3
) a-
02var10 2B j G aekka (c*
3
) a74%
Unknown F ?
B. lenta 01var10 1A GA a (A) (F) d a (a*
3
) a60%
01var11 1A GA a (A) (G) d a (a*
3
) a60%
01var16 1B BD a DA d a (a*
3
) a74%
02var01 2A j eaekka (c*
3
) a74%
02var04 2B j H aekka (c*
3
) a74%
02var07 2C j F aekka (c*
3
) a74%
B. nigra 01var03 1A B a a B a F a a a79%
01var06 1B aa a a - C a a a74%
01var07 1C aa a aa C a a a79%
01var08 1D aa a aa DFa a79%
02var06 2A JK aeKK a (c*
3
) a74%
unknown F ?
Each isoform is displayed on a separate line. When isoforms are encoded by the same gene this is indicated in the third column. Note that gene labels in one species do not
correspond to gene labels in other species. Peptide fragments are shown at the top of the table and are labelled with Roman numbers as indicated in Fig. 3. Each variant of
these fragments is displayed in the Table by a letter. Bold capital letters indicate that a fragment is unique for the isoforms of a particular gene. Bold italic letters indicate that
a fragment is unique for the isoforms of a particular subfamily. Letters displayed between brackets indicate that a particular fragment was predicted, but was absent in the PR-
10 mixture. Finally, the last column displays the coverage of the total protein sequence, including the fragments that were too small to be detected (II, VI, IX, XI, XII, XIII, XIV,
XV). Fig. 3 displays the representative amino acid sequences of the isoforms 01A01 and 02A01.
*1 The isoforms in subfamily 03 to 05 were summarized into a single row and not displayed for the other species, because specific peptides were not detected in any of the
species.
*2 Fragments X
a
and X
g
have exactly the same mass and cannot be distinguished. The peak of peptide X
c
overlaps with the first isotope peak of peptide X
a = g
because they
differ exactly 1 Da in size and have the same charge. As a consequence, X
c
cannot be identified separately.
*3 The XVI-peptides are not always detected because of their small size.
BMC Plant Biology 2009, 9:24 />Page 9 of 15
(page number not for citation purposes)
forms in a similar fashion as reported for B. pendula. The
Bet v 1a-like isoforms were estimated to comprise 38% (B.
chichibuensis), 36–44% (B. nigra) and 36–41% (B. costata)
of the total amount of Bet v 1. B. lenta differed from the
other species, because the isoform with the highest simi-
larity to Bet v 1a differed by seven amino acids. This iso-
form was estimated to comprise 12–19% of the total
amount of Bet v 1. The expression of subfamily 01 iso-
forms relative to subfamily 02 isoforms was another
major difference between B. lenta and the other species. In
B. lenta, subfamily 02 accounted for 74–83% of the total
amount of Bet v 1, compared to 25–40% in B. pendula, B.
nigra and B. chichibuensis and 49–56% in B. costata.
Discussion
PR-10 gene family organization and evolution
The presence and diversity of Bet v 1 and closely related
PR-10 genes in eight birch species was established by
amplification and sequencing of more than 100 clones
per species. The eight species belong to four different sub-
genera/groups in the genus Betula [13] and thereby repre-
sent a large part of the existing variation within the genus.
Each birch species contains PR-10 genes, as could be
expected given the broad range of plant species in which
PR-10 genes are found [21-23]. The PR-10 genes grouped
into subfamilies, as previously reported for B. pendula
[32]. Five subfamilies were recovered from all species.
Two new subfamilies were identified, but these were each
restricted to two species and were mostly composed of
pseudogenes.
The PR-10 subfamily has a complex genomic organiza-
tion. Differentiating between paralogues and homologues
was not possible beyond closely related species. One
likely explanation is concerted evolution, for which cla-
distic evidence was found (Fig. 2). Concerted evolution
causes genes to evolve as a single unit whose members
(occasionally) exchange genetic information through
gene conversion or unequal crossing-over [40]. Tandemly
arranged genes have increased conversion rates, while
such an arrangement is a prerequisite for the occurrence of
unequal crossing-over [41]. Most PR-10 genes in apple are
arranged in a duplicated cluster [22], thus facilitating the
main mechanisms for concerted evolution. We obtained
two alleles that appear the direct result of unequal cross-
ing-over between Bet v 1 genes. On a higher taxonomic
level, cladistic evidence for concerted evolution is present
in the overall gene tree of the PR-10 family [35], as
sequence divergence is generally smaller between differ-
ent genes from the same species than between genes from
different species.
Nei and Rooney [42] suggested that a combination of
recent gene duplications and purifying selection could
also explain why tandem gene duplicates appear similar.
In their model of birth-and-death evolution of genes, new
genes arise due to gene duplications, evolve independ-
Table 4: Quantification of identified peptides by Q-TOF LC-MS
E
in the pollen of B. pendula 'Youngii'.
Fragment I*
1
III IV V VII VIII*
1
X *
2
XVII Direct
coverage
estimate
Indirect
coverage
estimate
Subfamil
y
Direct
estimate
Isoform Gene
01A01 1A Ia: n.q. IIIa: 51 IVa: 100 Va: 46 VIIa: 75 VIIIa:
n.q.
Xa+g+c:
82
XVIIa:
100
-4–41%01 68–75%
01A06 1A Ia: n.q. IIIa: 51 IVa: 100 Vb: 23 VIIa: 75 VIIIa:
n.q.
Xa+g+c:
82
XVIIa:
100
- 4–5%
01B01 1B Ib: 69 IIIb: 19 IVa: 100 Vb: 23 VIIa: 75 VIIIc:
n.q.
Xb: 18 XVIIa:
100
18–19% -
01C04/
01C05
1C Id: 31 IIIa: 51 IVa: 100 Va: 46 VIIa: 75 VIIId:
100
Xa+g+c:
82
XVIIa:
100
-6%
01D01 1D Ie: 0 IIIa: 51 IVa: 100 Vc: 0 VIIc: 0 VIIIe: 0 Xa+g+c:
82:
XVIIa:
100
0% -
02A01/
02B01
2A Ia: n.q. IIIe: 13 IVa: 100 Ve: 32 VIIk: 25 VIIIk:
n.q.
Xa+g+c:
82
XVIIa:
100
13% - 02 25–32%
02C01 2C Ia: n.q. IIIf: 17 IVa: 100 Ve: 32 VIIk: 25 VIIIk:
n.q.
Xa+g+c:
82
XVIIa:
100
17% -
Numbers indicate the relative amount of fragment variants compared to the total amount of homologues fragments. Amounts were averaged over
the two duplicates. Note that quantification was not possible for all peptide variants
1,2
and that the displayed abundances indicate the relative
amounts among those variants that could be quantified. n.q. = not possible to quantify.
* 1 Quantification was not possible for all the peptide variants, because I
a
(1854,91 Da) and VIII
a
(1854,89 Da), and I
j
(1840,89 Da) and VIII
c
(1840,88
Da) had a similar mass. Fragment VIII
k
overlaps with a keratin peptide.
* 2 Fragments X
a
and X
g
have exactly the same mass and cannot be distinguished. The peptide peak of X
c
overlaps with the first isotope peak of
peptide X
a = g
because they differ exactly 1Da in size and have the same charge. X
c
cannot be identified as a result.
BMC Plant Biology 2009, 9:24 />Page 10 of 15
(page number not for citation purposes)
ently while undergoing purifying selection, and go extinct
after becoming non-functional. Pseudogenes are charac-
teristic for this process. The low K
a
/K
s
ratios clearly point
to the occurrence of purifying selection. Pseudogenes are
a common feature among the PR-10 genes in birch, since
we recovered them from six out of eight species. As much
as one-third of the recovered alleles in B. nigra had an
interrupted ORF. We did not determine the potential
expression of these alleles, since truncated isoforms
would have migrated outside the 16–18 kDa band in the
SDS-PAGE. None were, however, detected in the 14 kDa
band. Basically, all ingredients for the "birth-and-death"
model are present, except that independent evolution is
questionable due to the presences of duplicates that
resulted from unequal crossing-over. Moreover, the clus-
tering of for example the B. chichibuensis alleles (Fig. 2)
would suggest an extremely high number of recent dupli-
cations. Both processes of "birth-and-death" and con-
certed evolution may, therefore, be active in the PR-10
gene family. Regardless of the evolutionary processes, its
outcome is clear: PR-10 proteins are homogenous as a
group and even stronger so within subfamilies. The high
homogeneity allowed us to use Q-TOF LC-MS
E
to quantify
the relative expression of separate Bet v 1 isoforms,
because large differences in amino acid composition
would have distorted the quantification.
Bet v 1 expression
Which PR-10 genes are actually expressed in pollen and
are thereby the true Bet v 1 allergens? We used Q-TOF
analysis to investigate the expression of Bet v 1 isoforms
in pollen of five Betula species. Isoforms from subfamily
01 and 02 were identified in birch pollen, confirming pre-
dictions based on mRNA expression [1,33,34]. The single
gene in subfamily 05 that was present in all eight birch
species, is homologous to ãpr10c, which has a high basal
transcription level in roots and a relatively lower basal
transcription level in leaves [27,28,43]. Its expression is
induced by copper stress [30] and during senescence in
leaves [44]. Regarding subfamily 03, the genes PR-10.03C
and 03D (=
γ
pr10a and
γ
pr10b) in B. pendula become tran-
scriptionally upregulated upon infection of the leaves
with fungal pathogens [27]. Their transcription is induced
by wounding or auxin treatment in roots [28,43]. No data
have been reported about the expression of the sequenced
PR-10 genes in subfamilies 04, 06 and 07.
The pollen-expressed Bet v 1 genes are transcribed during
the late stages of anther development [45], but which fac-
tors induce transcription is unknown. Bet v 1 is an abun-
dant pollen protein that has been estimated to encompass
10% of the total protein in B. pendula pollen [46]. The Bet
v 1 band was the most intense band in the SDS-PAGE gels
of birch pollen extracts. Its exact abundance is difficult to
estimate due to differences in extraction efficiency
between different proteins. However, given the low
amount of residual protein in the pellet, our results sug-
gest that the abundance of Bet v 1 is higher than 10% of
the total protein content and is likely to exceed 20%. The
occurrence of Bet v 1 isoforms in B. pendula has previously
been studied in a mixture of pollen from different trees by
Swoboda et al. [34]. They analyzed tryptic digests of puri-
fied Bet v 1 isoforms by Plasma Desorption Mass Spec-
trometry (PDMS), a technique that only reveals peptide
masses. We examined pollen from individual trees and
analyzed the tryptic digests by Q-TOF LC-MS
E
, which
reveals total masses of peptides and the underlying amino
acid sequences, based on available sequence information.
The ability to determine the peptide sequences yields
more accurate information on expression of individual
isoforms. We demonstrated that at least 4 to 6 isoforms
were expressed in the pollen of one single tree of the birch
species B. pendula, B. nigra, B. chichibuensis, B. lenta and B.
costata. The actual number is likely to be higher since we
could not discriminate each individual isoform due to the
high similarity between some isoforms.
Q-TOF LC-MS
E
has the advantageous ability to simultane-
ously separate, identify and quantify peptide fragments. A
similar strategy has recently been followed by Chassaigne
et al. [47]. They identified five peanut-specific peptide
ions that were used as specific tags for the peanut aller-
genic proteins Ara h 1, Ara h 2, and Ara h 3. The relative
intensity of the specific peptides even provided informa-
tion on the processing history of the peanut material.
Napoli et al. [48] also used mass spectrometry to analyze
an Ole e 1 mixture of multiple isoforms and their post-
translational modifications, which could not be separate
completely by 2-Dimension gel electrophoresis. A disad-
vantage of using Q-TOF LC-MS
E
instead of Q-TOF LC-
MSMS in combination with 2D gel electrophoresis and
Western blotting – in which allergic sera and specific anti-
IgE antibodies are employed – is that our method does
not distinguish IgE-binding isoforms from non-IgE-bind-
ing isoforms. Therefore, not all described PR-10 isoforms
are necessarily true isoallergens.
We included no purification step in the extraction proce-
dure apart from protein separation on SDS-PAGE. This
minimizes the chance that certain isoforms are lost during
purification, but the Bet v 1 protein band might be con-
taminated with other pollen proteins with a similar mass.
Three peptides of the pollen allergen Bet v 7 were detected
in the 16–18 kDa band, but the amount of Bet v 7 was
estimated to be less than 2% of the amount of Bet v 1,
based on the peak intensities of these peptides. All pep-
tides with high peak intensities could be attributed to Bet
v 1 isoforms. Full sequence coverage of Bet v 1 isoforms
cannot be achieved by using only trypsin as a protease, as
smaller peptides will be lost during peptide extraction
BMC Plant Biology 2009, 9:24 />Page 11 of 15
(page number not for citation purposes)
from the SDS-PAGE gel. Proteases that cleave at other sites
will yield peptides that cover part of the missing protein
sequence. Coverage with Q-TOF LC-MS
E
was 71–79% for
the B. pendula isoforms, which is higher than the 57–60%
coverage reported for Q-TOF MS/MS [38].
Swoboda et al. [34] estimated that, based on PDMS peak
areas of peptides, the relative amount of Bet v 1a (= PR-
10.01A01) in the pollen mixture from several B. pendula
trees was at least 50% of the total amount of Bet v 1. Fer-
reira et al. [37] estimated the relative amounts of different
Bet v 1 isoforms by NH
2
-terminal sequencing of purified
natural Bet v 1 and reported a ~2:2:1 ratio for isoforms
that respectively contain Ser, Thr and Ile at the 7
th
amino
acid position. This would correspond to expression of the
isoforms 02A01+02B01+02C01: 01A01+01A06:
01B01+01C04+01C05 in pollen of B. pendula 'Youngii'.
When we sum our results in this way, a ratio of
30%:45%:25% is obtained. The similarity between our
results and previously obtained estimates suggests that the
quantities obtained from B. pendula 'Youngii' are also rep-
resentative for other B. pendula trees.
Allergenicity
Ferreira et al. [37] distinguished Bet v 1 isoforms with a
low, intermediate and high IgE-reactivity. Expression of
the isoforms 01B01 (= Bet v 1d, low IgE-reactivity), 02C01
(= Bet v 1c, intermediate IgE-reactivity), 01C04 (= Bet v 1f,
intermediate IgE-reactivity) and 01A01 (= Bet v 1a, high
IgE-reactivity) in the pollen of B. pendula 'Youngii' was
confirmed by identification of unique peptides (Table 3).
Isoforms of all three levels of IgE-reactivity were abundant
and encompassed 35–38% (high), 22–24% (intermedi-
ate) and 18–19% (low) of the total amount of Bet v 1.
This leaves 17–22% of the total Bet v 1 for isoforms with
an unknown IgE-reactivity. We observed similar quanti-
ties in two other B. pendula cultivars as well (results not
shown). Since B. pendula is known to be highly allergenic,
the presence of isoforms with a high IgE-reactivity is
apparently of determining influence on its allergenicity.
Interestingly, people that are not yet sensitized to B. pen-
dula pollen come into contact with several abundant iso-
forms. However, the ability of these isoforms to provoke
an IgE-mediated response varies in patients that have
become sensitized [49,50]. The factors that cause one iso-
form to develop into having a high IgE-reactivity and
another isoform into having a low IgE-reactivity are cur-
rently unknown. The abundance of the isoforms may play
a role, but as isoforms with intermediate or low IgE-reac-
tivity are also present in considerable quantities, this is
unlikely to be the only factor. Recently, Gao et al. [18],
investigated the association of allelic diversity of Mal d 1
and allergenicity in ten pedigree-linked apple cultivars,
and found that qualitative as well as quantitative factors
were involved.
The opportunities for identifying birch trees that only
express hypoallergenic isoforms are limited. The isoforms
Bet v 1l and Bet v1d (= 01B01) are currently known as
hypoallergenic [37]. The crystal-structure of Bet v 1l has
been determined [51] and its allergenicity has recently
been tested on a large group of patients [50]. However,
none of the examined species contained Bet v 1l, despite
thorough examination, and Bet v 1l may represent a
sequencing artifact or an unexpressed allele. Only B. pen-
dula, B. populifolia and B. plathyphylla contained 01B01.
The most similar isoforms in the other species differed by
at least five amino acids. In contrast, the highly allergenic
isoform 01A01 is expressed in pollen of B. pendula
'Youngii', while the B. populifolia genome also contains the
01A01 sequence. The other Betula species do not harbor
Bet v 1a, but B. chichibuensis, B. costata and B. nigra contain
isoforms that differ only by 1–3 amino acids from Bet v
1a. A high similarity between isoforms increases the
chance that they share epitopes, although a few amino
acid substitutions may influence the allergenicity drasti-
cally [52-54]. In all species, these isoforms are abundant.
B. lenta forms an exception as the isoform most similar to
Bet v 1a has a sequence similarity of 95.5% and encodes a
protein that differs by seven amino acids.
Conclusion
We identified 12 to 25 unique PR-10 sequences in each of
eight different birch species. Application of Q-TOF LC-
MS
E
revealed that genes from two large subfamilies (01
and 02) were expressed in birch pollen. We showed that
Q-TOF LC-MS
E
allowed fast screening of Bet v 1 isoforms
in birch pollen by determining presence and relative
abundances of individual isoforms. The pollen of four
birch species contained a mixture of Bet v 1 isoforms, with
abundant levels of isoforms that were similar to isoforms
with a high IgE-reactivity. We predict that the allergenic
potency of these species will be high. B. lenta (subgenus
Betulenta) lacked isoforms with a high similarity to iso-
forms with a high IgE-reactivity. This species and related
species represent the most promising candidates for fur-
ther screening of hypoallergenicity by for example skin
prick tests or nasal challenges.
Methods
Plant Material
We collected young leaves from eight Betula species (Table
1). A recent phylogenetic analysis identified four groups
(subgenera) of species within the genus Betula [13]. Each
subgenus is represented by at least one species. Four spe-
cies from the subgenus Betula were included here to cover
the variation within this large group. Plant material was
collected from the botanical collections of PPO Boskoop
(Boskoop, the Netherlands), the Botanical Garden of
Wageningen (Wageningen, the Netherlands) and the Von
Gimborn Arboretum (Doorn, the Netherlands). Fresh leaf
BMC Plant Biology 2009, 9:24 />Page 12 of 15
(page number not for citation purposes)
samples were analyzed by flow cytometry (Plant Cytome-
try Services, Schijndel, The Netherlands) to estimate the
ploidy level. Diploid (B. pendula) and tetraploid (B. pubes-
cens) controls were included. All examined accessions
were diploid, thus keeping the number of expected
sequences per accession small. During the flowering
period of birch in April-May 2004, we collected pollen
from the same trees for the species B. nigra, B. chichibuen-
sis, B. lenta, B. costata and B. pendula.
PCR, cloning and sequencing
DNA was extracted using the DNeasy Plant Mini kit (Qia-
gen) according to the manufacturer's instructions. PR-10
alleles were amplified from genomic DNA with two
primer pairs that had been tested and used in previous
research on B. pendula [32]. PCR amplification with both
primer pairs was performed in 20 μl reactions containing
0.1 mM dNTP, PCR Reaction buffer (Eurogentec), 1.5 mM
MgCl
2
, 0.6 μM forward primer, 0.6 μM reverse primer, 0.5
U Taq polymerase (Goldstar), and 20–80 ng template
DNA. PCR reactions started with a heating step at 95°C
for 15 minutes, followed by 16–24 cycles of denaturation
at 94°C for 30 s, annealing at 50°C for 45 s, and extension
at 72°C for 2 min. A final extension step of 10 min at
72°C was added after the last cycle. To reduce the number
of PCR recombination artifacts, we used as few PCR cycles
as possible. The minimum number of cycles required to
generate sufficient product for cloning was assessed by vis-
ual inspection of the amplified products on agarose gel.
PCR products were purified with the MinElute PCR Puri-
fication Kit (Qiagen). Purified samples were ligated into
the pGEM-T easy Vector (Promega) and established in
Escherichia coli Subcloning Efficiency DH5α cells (Invitro-
gen) according to the manufacturer's instructions. White
colonies were picked from agar plates and grown over-
night at 37°C in freeze medium. We performed PCR-
based screening with vector-specific M13 primers. These
PCR products were purified with Sephadex G-50 (Milli-
pore). The DYEnamic™ ET Terminator Cycle Sequencing
Kit (Amersham) was used for the sequence reactions. We
analyzed sequence products on a 96-capillary system (ABI
3730 × l). The genomic Betula sequences have been sub-
mitted to GenBank as EU526132
–EU526277.
Phenetic/phylogenetic analysis
Potential PCR artifacts (strand switching and base misin-
corporation) were excluded by retaining only those
sequences that were confirmed in independent PCRs. We
included one reference sequence per B. pendula gene in the
dataset for comparison with previous results [32]. Nucle-
otide sequences were aligned using CLUSTAL W with a
gap penalty of 10 and a gap extension penalty of 2. We
excluded primer traces and introns from further analysis.
A Neighbor Joining (NJ) tree was constructed with Kimura
two-parameter distances. Gaps were treated as missing
characters. Bootstrapping was carried out with 1,000 rep-
licates in PAUP 4.0b10 [55]. The outgroup was composed
of PR-10 sequences from Castanea sativa (AJ417550
) and
Fagus sylvatica (AJ130889
), which are two related Fagales
species. Parsimony analysis was conducted in PAUP as a
heuristic search, while using the following options:
100,000 random additions while holding one tree at each
step, TBR branch swapping, the MulTrees option switched
on, and ACCTRAN for character optimization. A strict
consensus tree was calculated for all of the most parsimo-
nious trees. Branch support was assessed by bootstrap
analysis comprising 10,000 replicates consisting of 10
random addition sequences with TBR branch swapping.
Both analyses produced highly similar results; therefore,
only the NJ analysis is shown.
Protein search database
Nucleotide sequences were aligned codon-by-codon. We
analyzed general selection patterns at the molecular level
using DnaSp 4.00 [56]. The number of non-synonymous
(K
a
) and synonymous substitutions (K
s
) per site were cal-
culated from pair wise comparisons with incorporation of
the Jukes-Cantor correction. Nucleotide data were trans-
lated. A Fasta database with the resulting protein
sequences was used as a search database in the Q-TOF LC-
MS
E
analysis. As sequence information for the primer
region was unavailable, we used the GenBank sequences
X15877
(subfamily 01), X77265 (02), X77600 (03), and
X77601
(05) to fill these gaps in sequences from the
respective subfamilies. The initiating Methionine is
removed during PR-10 protein synthesis [30,37] and was
therefore removed from the predicted proteins. Protein
sequences of birch PR-10 isoforms in GenBank (overview
in: Schenk et al., 2006), keratin, trypsin and Bet v 7
(AJ311666
) were added to the database.
Protein extraction
Fifty mg of pollen were suspended in 1 ml of 0.05 M Tris-
HCl (pH 7.5) following Cadot et al. [57], who found that
yield and diversity of the extracted allergens are optimal at
pH 7.5 for birch pollen. After incubation under constant
shaking at room temperature for 1 hr, the pollen extract
was centrifuged at 10.000 rpm for 5 min. The pellet was
ground with an Eppendorf-fitting pestle. The extract was
then shaken for another hour. The supernatant was col-
lected after centrifugation (10.000 rpm; 5 min) and freeze
dried for storage.
SDS-PAGE
The freeze-dried protein extract was redissolved in 0.05 M
Tris-HCL (pH 7.5) and analyzed with SDS-PAGE to local-
ize Bet v 1-type proteins. Proteins were separated on a
15% w/v acrylamide SDS-PAGE gel with a 5% w/v stack-
ing gel using the Mini-Protean II gel system (Bio-Rad).
BMC Plant Biology 2009, 9:24 />Page 13 of 15
(page number not for citation purposes)
After staining with Coomassie BB R-250, the gels were
scanned and analyzed by Quantity One (Bio-Rad) scanner
software. Relative molecular masses were determined
with SDS-PAGE Standards broad range markers (Bio-
Rad).
The protein bands at a relative molecular mass of 16–18
kDa were cut out of the SDS-PAGE gel and processed
essentially according to Shevchenko [58]. Bands were
sliced into 1 mm
3
-pieces. Bands at 14, 19 and 35 kDa were
cut out and analyzed as well. Proteins were reduced with
DTT and alkylated with iodoacetamide. Gel pieces were
dried under vacuum, and swollen in 0.1 M NaHCO
3
that
contained sequence-grade porcine trypsin (10 ng/μl,
Promega). After digestion at 37°C overnight, peptides
were extracted from the gel with 50% v/v acetonitrile, 5%
v/v formic acid and dried under vacuum.
Q-TOF LC-MS/MS and Q-TOF LC-MS
E
Tryptic digests were analyzed by one-dimensional LC-MS
in high-throughput configuration using the Ettan™ MDLC
system (GE Healthcare), which was directly connected to
a Q-TOF-2 Mass Spectrometer (Waters Corporation, UK).
Samples (5 μl) were loaded on 5 mm × 300 μm ID Zor-
bax™ 300 SB C18 trap columns (Agilent Technologies),
and peptides were separated on 100 μm i.d. × 15 cm Chro-
molith CapRod monolithic C18 capillary columns
(Merck) at a flow rate of approximately 1 μl/min. A gradi-
ent was applied using two solvents. Solvent A contained
an aqueous 0.1% formic acid solution and solvent B con-
tained 84% acetonitrile in 0.1% formic acid. The gradient
consisted of isocratic conditions at 5% B for 10 min, a lin-
ear gradient to 30% B over 40 min, a linear gradient to
100% B over 10 min, and then a linear gradient back to
5% B over 5 min. MS analyses were performed in positive
mode using ESI with a NanoLockSpray source. As lock
mass, [Glu
1
]fibrinopeptide B (1 pmol/μl) (Sigma) was
delivered from the syringe pump (Harvard Apparatus,
USA) to the reference sprayer of the NanoLockSpray
source at a flow rate of 1 μl/min. The lock mass channel
was sampled every 10 s.
To identify the 14, 16–18, 19 and 35 kDa bands, the Q-
TOF-2 was operating in MS/MS mode for data dependent
acquisition. The mass spectrometer was programmed to
determine charge states of the eluting peptides, and to
switch from MS to MS/MS mode for z ≥ 2 at the appropri-
ate collision energy for Argon gas-mediated CID. Each
resulting MS/MS spectrum contained sequence informa-
tion on a single peptide. Processing and database search-
ing of the MS/MS data set was performed using
ProteinLynx Global SERVER (PLGS) v2.3 (Waters Corpo-
ration) and the NCBI non-redundant protein database,
while taking fixed (carbamidomethylation) and variable
(oxidation of Methionine) modifications into account.
After the identification of multiple Bet v 1 isoforms in the
16–18 kDa band, we analyzed the tryptic digest of this
band with Q-TOF LC-MS
E
. The Q-TOF-2 was pro-
grammed to alternate between low and elevated levels of
collision energy. Collision energy was 5 eV in MS mode
and was increased in two steps from 28 to 40 eV in MS
E
mode. Measuring time in both modes was 0.9 s with an
interscan delay of 0.1 s. Unfragmented precursors pre-
dominate in low energy mode, while fragmented ions of
the precursors are observed in high energy mode. Digests
were analyzed in duplicate. MS
E
data were analyzed
according to the procedure described by Silva et al. [39]
with the Expression module in PLGS. Different peptide
components were detected with an ion detection algo-
rithm, and then clustered by mass and retention time, fol-
lowed by normalization of the data. The described PR-10
protein search database was used to identify peptides,
while taking fixed (carbamidomethylation) and variable
(oxidation of Methionine) modifications into account.
After processing by PLGS, the so-called Exact Mass and
Retention Time (EMRT) table was exported and reclus-
tered using the PACP tool [59] to correct potential mis-
alignments and split peak detection errors. Retention time
was normalized and the reclustered EMRT table was fur-
ther analyzed in Excel.
Authors' contributions
MFS coordinated the study, performed the analysis and
drafted the manuscript. WPCW performed the cloning
and sequencing. HHGC performed the SDS-PAGE and Q-
TOF LC- MSMS experiments, and participated in drafting
the manuscript. AHPA participated in designing the study
and in analyzing the Q-TOF LC- MS/MS data. LJWJG par-
ticipated in the design and coordination of the study.
MJMS participated in the design of the study and the anal-
ysis of the sequence data. All authors have read and
approved the final manuscript.
Acknowledgements
This research was partially funded by the Netherlands Proteomics Centre,
an Innovative Cluster of the Netherlands Genomics Initiative and partially
funded by the Dutch Government (BSIK03009). This research was partially
funded by the Allergy Consortium Wageningen (ACW).
References
1. Breiteneder H, Pettenburger K, Bito A, Valenta R, Kraft D, Rumpold
H, Scheiner O, Breitenbach M: The gene coding for the major
birch pollen allergen BetvI, is highly homologous to a pea dis-
ease resistance response gene. EMBO Journal 1989, 8:1935-1938.
2. Jarolim E, Rumpold H, Endler AT, Ebner H, Breitenbach M, Scheiner
O, Kraft D: IgE and IgG antibodies of patients with allergy to
birch pollen as tools to define the allergen profile of Betula
verrucosa. Allergy 1989, 44:385-395.
3. Niederberger V, Pauli G, Gronlund H, Froschl R, Rumpold H, Kraft
D, Valenta R, Spitzauer S: Recombinant birch pollen allergens
(rBet v 1 and rBet v 2) contain most of the IgE epitopes
present in birch, alder, hornbeam, hazel, and oak pollen: A
quantitative IgE inhibition study with sera from different
populations. J Allergy Clin Immunol 1998, 102(4 Pt 1):579-91.
BMC Plant Biology 2009, 9:24 />Page 14 of 15
(page number not for citation purposes)
4. Bollen MA, Aranzazu G, Cordewener JHG, Wichers HJ, Helsper
JPFG, Savelkoul HFJ, Van Boekel MAJS: Purification and charac-
terization of natural Bet v 1 from birch pollen and related
allergens from carrot and celery. Mol Nutr Food Res 2007,
51(12):1527-36.
5. Fritsch R, Bohle B, Vollmann U, Wiedermann U, Jahn-Schmid B, Kre-
bitz M, Breiteneder H, Kraft D, Ebner C: Bet v 1, the major birch
pollen allergen, and Mal d 1, the major apple allergen, cross-
react at the level of allergen-specific T helper cells. J Allergy
Clin Immunol 1998, 102(4 Pt 1):679-86.
6. Karlsson AL, Alm R, Ekstrand B, Fjelkner-Modig S, Schiött A, Bengts-
son U, Björk L, Hjernø K, Roepstorff P, Emanuelsson CS: Bet v 1
homologues in strawberry identified as IgE-binding proteins
and presumptive allergens. Allergy 2004, 59:1277-1284.
7. Scheurer S, Son DY, Boehm M, Karamloo F, Franke S, Hoffmann A,
Haustein D, Vieths S: Cross-reactivity and epitope analysis of
Pru a 1, the major cherry allergen. Molecular Immunology 1999,
36:155-167.
8. Bohle B, Radakovics A, Jahn-Schmid B, Hoffmann-Sommergruber K,
Fischer GF, Ebner C: Bet v 1, the major birch pollen allergen,
initiates sensitization to Api g 1, the major allergen in celery:
evidence at the T cell level. European Journal of Immunology 2003,
33:3303-3310.
9. Ferreira F, Hawranek T, Gruber P, Wopfner N, Mari A: Allergic
cross-reactivity: from gene to the clinic. Allergy 2004,
59:243-267.
10. Breiteneder H, Ebner C: Molecular and biochemical classifica-
tion of plant-derived food allergens. J Allergy Clin Immunol 2000,
106(1 Pt 1):27-36.
11. De Jong PC: An introduction to betula: Its morphology, evolu-
tion, classification and distribution with a survey of recent
work. The IDS Betula Symposium, International Dendrology Soc: 1993;
Sussex, U.K 1993.
12. Järvinen P, Palmé A, Morales LO, Lännenpää M, Keinänen M, Sopanen
T, Lascoux M: Phylogenetic relationships of Betula species
(Betulaceae) based on nuclear ADH and chloroplast matK
sequences. American Journal of Botany 2004, 91:1834-1845.
13. Schenk MF, Thienpont C-N, Koopman WJM, Gilissen LJWJ, Smulders
MJM: Phylogenetic relationships in Betula (Betulaceae) based
on AFLP markers. :911-924. 4. ISSN 1614-2942
14. Eriksson NE, Holmén A, Möller C, Wihl JÅ: Sensitization accord-
ing to skin prick testings in atopic patients with asthma or
rhinitis at 24 allergy clinica in Northern Europe and Asia.
Allergology International 1998, 47:187-196.
15. Abe Y, Kimura S, Kokubo T, Mizumoto K, Uehara M, Katagiri M:
Epitope analysis of birch pollen allergen in Japanese subjects.
Journal of Clinical Immunology 1997, 17:485-493.
16. Bolhaar STHP, Weg WE Van de, Van Ree R, Gonzalez-Macebo E,
Zuidmeer L, Bruijnzeel-Koomen CAFM, Fernandez-Rivas M, Jansen J,
Hoffmann-Sommergruber K, Knulst AC, et al.: In vivo assessment
with prick-to-prick testing and double-blind, placebo-con-
trolled food challenge of allergenicity of apple cultivars. J
Allergy Clin Immunol 2005, 116(5):1080-6.
17. Marzban G, Puehringer H, Dey R, Brynda S, Ma Y, Martinelli A, Zac-
carini M, Weg E van der, Housley Z, Kolarich D, et al.: Localisation
and distribution of the major allergens in apple fruits. Plant
Science 2005, 169:387-394.
18. Gao Z, Weg EW Van de, Matos CI, Arens P, Bolhaar STHP, Knulst
AC, Li Y, Hoffmann-Sommergruber K, Gilissen LJWJ: Assessment
of allelic diversity in intron-containing Mal d 1 genes and
their association to apple allergenicity. BMC Plant Biol 2008,
8:116.
19. Ahrazem O, Jimeno L, López-Torrejón G, Herrero M, Espada JL,
Sánchez-Monge R, Duffort O, Barber D, Salcedo G: Assessing aller-
gen levels in peach and nectarine cultivars. Ann Allergy Asthma
Immunol 2007, 99(1):42-7.
20. Castro AJ, Alche JD, Cuevas J, Romero PJ, Alche V, Rodriguez-Garcia
MI: Pollen from different olive tree cultivars contains varying
amounts of the major allerge n ole e 1. International Archives of
Allergy and Immunology 2003, 131:164-173.
21. Ekramoddoullah AKM, Yu XS, Sturrock R, Zamani A, Taylor D:
Detection and seasonal expression pattern of a pathogene-
sis-related protein (PR-10) in Douglas-fir (Pseudotsuga men-
ziesii) tissues. Physiologia Plantarum 2000, 110:
240-247.
22. Gao ZS, Weg WE van de, Schaart JG, Schouten HJ, Tran DH, Kodde
LP, Meer IM van der, Geest AHM van der, Kodde J, Breiteneder H, et
al.: Genomic cloning and linkage mapping of the Mal d 1 (PR-
10) gene family in apple (Malus domestica). Theoretical And
Applied Genetics 2005, 111:171-183.
23. Huang JC, Chang FC, Wang CS: Characterization of a lily tapetal
transcript that shares sequence similarity with a class of
intracellular pathogenesis-related (IPR) proteins. Plant Molec-
ular Biology 1997, 34:681-686.
24. Van Loon LC, Van Strien EA: The families of pathogenesis-
related proteins, their activities, and comparative analysis of
PR-1 type proteins. Physiological and Molecular Plant Pathology 1999,
55:85-97.
25. Pühringer H, Moll D, Hoffmann-Sommergruber K, Watillon B, Kat-
inger H, Machado MLD: The promoter of an apple Ypr10 gene,
encoding the major allergen Mal d 1, is stress- and pathogen-
inducible. Plant Science 2000, 152:35-50.
26. Robert N, Ferran J, Breda C, Coutos-Thevenot P, Boulay M, Buffard
D, Esnault R: Molecular characterization of the incompatible
interaction of Vitis vinifera leaves with Pseudomonas syrin-
gae pv. pisi: Expression of genes coding for stilbene synthase
and class 10 PR protein. European Journal of Plant Pathology 2001,
107:249-261.
27. Swoboda I, Scheiner O, Heberle-Bors E, Vicente O: cDNA cloning
and characterization of three genes in the Bet v 1 gene fam-
ily that encode pathogenesis-related proteins. Plant Cell and
Environment 1995, 18:865-874.
28. Poupard P, Strullu DG, Simoneau P: Two members of the Bet v 1
gene family encoding birch pathogenesis-related proteins
display different patterns of root expression and wound-
inducibility. Australian Journal of Plant Physiology 1998, 25:459-464.
29. Moons A, Prinsen E, Bauw G, Van Montagu M: Antagonistic effects
of abscisic acid and jasmonates on salt stress-inducible tran-
scripts in rice roots. Plant Cell 1997, 9:2243-2259.
30. Utriainen M, Kokko H, Auriola S, Sarrazin O, Karenlampi S: PR-10
protein is induced by copper stress in roots and leaves of a
Cu/Zn tolerant clone of birch, Betula pendula. Plant Cell and
Environment 1998, 21:821-828.
31. Walter MH, Liu JW, Wünn J, Hess D: Bean ribonuclease-like
pathogenesis-related protein genes (Ypr10) display complex
patterns of developmental, dark-induced and exogenous-
stimulus-dependent expression. European Journal of Biochemistry
1996, 239:281-293.
32. Schenk MF, Gilissen LJWJ, Esselink GD, Smulders MJM: Seven differ-
ent genes encode a diverse mixture of isoforms of Bet v I, the
major birch pollen allergen. BMC Genomics 2006, 7:168.
33. Friedl-Hajek R, Radauer C, O'Riordain G, Hoffmann-Sommergruber
K, Leberl K, Scheiner O, Breiteneder H: New Bet v 1 isoforms
including a naturally occurring truncated form of the protein
derived from Austrian birch pollen. Molecular Immunology 1999,
36:639-645.
34. Swoboda I, Jilek A, Ferreira F, Engel E, Hoffmann-Sommergruber K,
Scheiner O, Kraft D, Breiteneder H, Pittenauer E, Schmid E, et al.: Iso-
forms of Bet v 1, the major birch pollen allergen, analyzed by
liquid-chromatography, mass-spectrometry, and cDNA
cloning. Journal of Biological Chemistry 1995, 270:2607-2613.
35. Wen J, Vanek-Krebitz M, Hoffmann-Sommergruber K, Scheiner O,
Breiteneder H: The potential of Betv1 homologues, a nuclear
multigene family, as phylogenetic markers in flowering
plants. Mol Phylogenet Evol. 1997 Dec;8(3):317-33 1997, 8(3):317-33.
36. Hoffmann-Sommergruber K, Vanek-Krebitz M, Radauer C, Wen J,
Ferreira F, Scheiner O, Breiteneder H: Genomic characterization
of members of the Bet v 1 family: genes coding for allergens
and pathogenesis-related proteins share intron positions.
Gene 1997, 197:91-100.
37. Ferreira F, Hirtenlehner K, Jilek A, Godnik-Cvar J, Breiteneder H,
Grimm R, Hoffmann-Sommergruber K, Scheiner O, Kraft D, Breiten-
bach M, et al.: Dissection of immunoglobulin E and T lym-
phocyte reactivity of isoforms of the major birch pollen
allergen Bet v 1: Potential use of hypoallergenic isoforms for
immunotherapy. Journal of Experimental Medicine 1996,
183:599-609.
38. Helsper J, Gilissen L, van Ree R, America AHP, Cordewener JHG,
Bosch D: Quadrupole time-of-flight mass spectrometry: A
method to study the actual expression of allergen isoforms
identified by PCR cloning. J Allergy Clin Immunol 2002,
110(1):131-8.
Publish with BioMed Central and every
scientist can read your work free of charge
"BioMed Central will be the most significant development for
disseminating the results of biomedical research in our lifetime."
Sir Paul Nurse, Cancer Research UK
Your research papers will be:
available free of charge to the entire biomedical community
peer reviewed and published immediately upon acceptance
cited in PubMed and archived on PubMed Central
yours — you keep the copyright
Submit your manuscript here:
/>BioMedcentral
BMC Plant Biology 2009, 9:24 />Page 15 of 15
(page number not for citation purposes)
39. Silva JC, Denny R, Dorschel CA, Gorenstein M, Kass IJ, Li GZ, McK-
enna T, Nold MJ, Richardson K, Young P, et al.: Quantitative pro-
teomic analysis by accurate mass retention time pairs.
Analytical Chemistry 2005, 77:2187-2200.
40. Liao DQ: Concerted evolution: Molecular mechanism and
biological implications. American Journal of Human Genetics 1999,
64:24-30.
41. Ohta T: Evolution of gene families. Gene 2000, 259:45-52.
42. Nei M, Rooney AP: Concerted and birth-and-death evolution
of multigene families. Annual Review of Genetics 2005, 39:121-152.
43. Poupard P, Brunel N, Leduc N, Viémont JD, Strullu D-G, Simoneau P:
Expression of a Bet v 1 homologue gene encoding a PR 10
protein in birch roots: induction by auxin and localization of
the transcripts by in situ hybridization. Australian Journal of Plant
Physiology 2001, 28:57-63.
44. Valjakka M, Luomala EM, Kangasjärvi J, Vapaavuori E: Expression of
photosynthesis- and senescence-related genes during leaf
development and senescence in silver birch (Betula pendula)
seedlings. Physiologia Plantarum 1999, 106:302-310.
45. Swoboda I, Dang TCH, Heberle-Bors E, Vicente O: Expression of
Bet v 1, the major birch pollen allergen, during anther devel-
opment – An in situ hybridization study. Protoplasma 1995,
187:103-110.
46. Larsen JN: Isoallergens – significance in allergen exposure and
response. ACI News 1995, 7:141-160.
47. Chassaigne H, Nørgaard JV, Van Hengel AJ: Proteomics-based
approach to detect and identify major allergens in processed
peanuts by capillary LC-Q-TOF (MS/MS). J Agric Food Chem
2007, 55(11):4461-73.
48. Napoli A, Aiello D, Di Donna L, Moschidis P, Sindona G: Vegetable
proteomics: the detection of Ole e 1 isoallergens by peptide
matching of MALDI MS/MS spectra of underivatized and
dansylated glycopeptides. Journal of proteome research
2008,
7(7):2723-2732.
49. Ferreira F, Hirthenlehner K, Briza P, Breiteneder H, Scheiner O, Kraft
D, Breitenbach M, Ebner C: Isoforms of atopic allergens with
reduced allergenicity but conserved T cell antigenicity: Pos-
sible use for specific immunotherapy. Int Arch Allergy Immunol
1997, 113(1-3):125-7.
50. Wagner S, Radauer C, Bublin M, Hoffmann-Sommergruber K, Kopp
T, Greisenegger EK, Vogel L, Vieths S, Scheiner O, Breiteneder H:
Naturally occurring hypoallergenic Bet v 1 isoforms fail to
induce IgE responses in individuals with birch pollen allergy.
J Allergy Clin Immunol 2008, 121(1):246-52.
51. Markovic-Housley Z, Degano M, Lamba D, von Roepenack-Lahaye E,
Clemens S, Susani M, Ferreira F, Scheiner O, Breiteneder H: Crystal
structure of a hypoallergenic isoform of the major birch pol-
len allergen Bet v 1 and its likely biological function as a plant
steroid carrier. Journal of Molecular Biology 2003, 325:123-133.
52. Ferreira F, Ebner C, Kramer B, Casari G, Briza P, Kungl AJ, Grimm R,
Jahn-Schmid B, Breiteneder H, Kraft D, et al.: Modulation of IgE
reactivity of allergens by site-directed mutagenesis: poten-
tial use of hypoallergenic variants for immunotherapy. Faseb
Journal 1998, 12:231-242.
53. Son DY, Scheurer S, Hoffmann A, Haustein D, Vieths S: Pollen-
related food allergy: cloning and immunological analysis of
isoforms and mutants of Mal d 1, the major apple allergen,
and Bet v 1, the major birch pollen allergen. European Journal
of Nutrition 1999, 38:201-215.
54. Neudecker P, Lehmann K, Nerkamp J, Haase T, Wangorsch A,
Fötisch K, Hoffmann S, Rösch P, Vieths S, Scheurer S: Mutational
epitope analysis of Pru av 1 and Api g 1, the major allergens
of cherry (Prunus avium) and celery (Apium graveolens):
correlating IgE reactivity with three-dimensional structure.
Biochemical Journal 2003, 376:97-107.
55. Swofford DL: PAUP*. Phylogenetic Analysis Using Parsimony (*and Other
Methods). Version 4 Sinauer Associates, Sunderland, Massachusetts;
2003.
56. Rozas J, Sanchez-DelBarrio JC, Messeguer X, Rozas R: DnaSP, DNA
polymorphism analyses by the coalescent and other meth-
ods. Bioinformatics 2003, 19:2496-2497.
57. Cadot P, Lejoly M, Vanhoeyveld EW, Stevens EAM: Influence of the
pH of the extraction medium on the composition of birch
(Betula verrucosa) pollen extracts. Allergy 1995, 50(5):
431-437.
58. Shevchenko A, Wilm M, Vorm O, Mann M: Mass spectrometric
sequencing of proteins from silver-stained polyacrylamide
gels. Analytical Chemistry 1996, 68:850-858.
59. De Groot JCW, Fiers MWEJ, Van Ham RCHJ, America AHP: Post
alignment clustering procedure for comparative quantita-
tive proteomics LC-MS Data. Proteomics 2008, 8:32-36.