báo cáo khoa học: " Genetic mapping of wild introgressions into cultivated peanut: a way toward enlarging the genetic basis of a recent allotetraploid" docx
Bạn đang xem bản rút gọn của tài liệu. Xem và tải ngay bản đầy đủ của tài liệu tại đây (1.26 MB, 13 trang )
BioMed Central
Open Access
Page 1 of 13
(page number not for citation purposes)
BMC Plant Biology
Research article
Genetic mapping of wild introgressions into cultivated
peanut: a way toward enlarging the genetic basis of a recent
allotetraploid
Daniel Foncéka
1
, Tossim Hodo-Abalo
2,3
, Ronan Rivallan
1
, Issa Faye
2
,
Mbaye Ndoye Sall
3
, Ousmane Ndoye
2
, Alessandra P Fávero
4
,
David J Bertioli
5,6
, Jean-Christophe Glaszmann
1
, Brigitte Courtois
1
and Jean-
Francois Rami*
1
Address:
1
Centre de coopération internationale en recherche agronomique pour le développement (Cirad), UMR Développement et Amélioration
des plantes, TA A96/3, Avenue Agropolis, Montpellier, France,
2
ISRA: Institut Sénégalais de Recherches Agricoles, Centre National de Recherche
Agronomique, BP 53, Bambey, Sénégal,
3
ISRA-CERAAS: Institut Sénégalais de Recherches Agricoles, Centre d'Etude Régional pour l'Amélioration
de l'Adaptation à la Sécheresse, Route de Khombole, BP 3320, Thiès, Sénégal,
4
Embrapa Recursos Genéticos e Biotecnologia, C.P. 02372, CEP
70.770-900 Brasilia, DF, Brazil,
5
Universidade Católica de Brasília, Campus II, SGAN 916, CEP 70.790-160 Brasilia, DF, Brazil and
6
Universidade
de Brasília, Campus Universitário, CEP 70.910-900 Brasília, DF, Brazil
Email: Daniel Foncéka - ; Tossim Hodo-Abalo - ; Ronan Rivallan - ;
Issa Faye - ; Mbaye Ndoye Sall - ; Ousmane Ndoye - ;
Alessandra P Fávero - ; David J Bertioli - ; Jean-Christophe Glaszmann - jean-
; Brigitte Courtois - ; Jean-Francois Rami* -
* Corresponding author
Abstract
Background: Peanut (Arachis hypogaea L.) is widely used as a food and cash crop around the
world. It is considered to be an allotetraploid (2n = 4x = 40) originated from a single hybridization
event between two wild diploids. The most probable hypothesis gave A. duranensis as the wild
donor of the A genome and A. ipaënsis as the wild donor of the B genome. A low level of molecular
polymorphism is found in cultivated germplasm and up to date few genetic linkage maps have been
published. The utilization of wild germplasm in breeding programs has received little attention due
to the reproductive barriers between wild and cultivated species and to the technical difficulties
encountered in making large number of crosses. We report here the development of a SSR based
genetic map and the analysis of genome-wide segment introgressions into the background of a
cultivated variety through the utilization of a synthetic amphidiploid between A. duranensis and A.
ipaënsis.
Results: Two hundred ninety eight (298) loci were mapped in 21 linkage groups (LGs), spanning a
total map distance of 1843.7 cM with an average distance of 6.1 cM between adjacent markers. The
level of polymorphism observed between the parent of the amphidiploid and the cultivated variety
is consistent with A. duranensis and A. ipaënsis being the most probable donor of the A and B
genomes respectively. The synteny analysis between the A and B genomes revealed an overall good
collinearity of the homeologous LGs. The comparison with the diploid and tetraploid maps shed
new light on the evolutionary forces that contributed to the divergence of the A and B genome
species and raised the question of the classification of the B genome species. Structural
Published: 3 August 2009
BMC Plant Biology 2009, 9:103 doi:10.1186/1471-2229-9-103
Received: 20 February 2009
Accepted: 3 August 2009
This article is available from: />© 2009 Foncéka et al; licensee BioMed Central Ltd.
This is an Open Access article distributed under the terms of the Creative Commons Attribution License ( />),
which permits unrestricted use, distribution, and reproduction in any medium, provided the original work is properly cited.
BMC Plant Biology 2009, 9:103 />Page 2 of 13
(page number not for citation purposes)
modifications such as chromosomal segment inversions and a major translocation event prior to
the tetraploidisation of the cultivated species were revealed. Marker assisted selection of BC
1
F
1
and then BC
2
F
1
lines carrying the desirable donor segment with the best possible return to the
background of the cultivated variety provided a set of lines offering an optimal distribution of the
wild introgressions.
Conclusion: The genetic map developed, allowed the synteny analysis of the A and B genomes,
the comparison with diploid and tetraploid maps and the analysis of the introgression segments
from the wild synthetic into the background of a cultivated variety. The material we have produced
in this study should facilitate the development of advanced backcross and CSSL breeding
populations for the improvement of cultivated peanut.
Background
Peanut (Arachis hypogaea L.) is widely used as a food and
cash crop around the world. It is mainly grown by
resource-poor farmers in Africa and Asia to produce edible
oil, and for human and animal consumption. Peanut is a
member of the Fabaceae, tribe Aeschynomeneae, subtribe
Stylosanthinae, genus Arachis. In this genus, 69 diploid and
tetraploid species have been described [1]. A. hypogaea is
the only species that has been truly domesticated
although several species have been cultivated for their
seed or forage [2]. Cultivated peanut is considered to be
an allotetraploid (2n = 4x = 40) originated from a single
hybridization event between two wild diploids with A and
B genome [3]. Several studies aimed at identifying the
wild diploid ancestors of A. hypogaea. The wild species A.
duranensis and A. ipaënsis appeared to be the best candi-
dates for the A and B genome donors, respectively [4-6].
Polyploidy is a widespread process that played a major
role in higher plants' speciation and adaptation. The
stages of polyploid formation usually include reproduc-
tive isolation from the progenitors [7,8]. As for many
polyploid species, cultivated peanut has experienced a
genetic bottleneck which, superimposed with the effects
of the domestication, has greatly narrowed the genetic
diversity. The low level of DNA polymorphism between
cultivated genotypes has been described by many authors
[9-12]. More recently, a rate of polymorphism of 12.6%
has been reported between two cultivated varieties, used
as parents of a RIL population, surveyed with 1145 SSR
markers [13]. The low level of polymorphism within cul-
tivated peanut has greatly hampered the application of
molecular breeding approaches for the genetic improve-
ment of cultivated peanut. Up to date, few genetic linkage
maps have been published in Arachis. At the diploid level,
three genetic maps involving species with A and B
genomes, one based on RFLP markers [14] and the other
ones on SSR markers [15,16], have been produced. The A
genome SSR based map has been recently extended using
legume anchor markers and aligned with Medicago and
Lotus genomic sequences [17]. At the tetraploid level, two
genetic maps were also reported. Varshney et al. [13]
reported the detection of drought tolerance QTLs based
on a cultivated × cultivated SSR genetic map. Although the
genetic map remained unsaturated, due to the low level of
polymorphism between cultivated peanut varieties, QTLs
have been detected attesting of the interest of molecular
breeding tools in genetic improvement of peanut. Burow
et al. [18] reported the construction of a RFLP map, based
on a BC
1
population deriving from a cross between a wild
synthetic amphidiploid (TxAG6) and a cultivated peanut
variety (Florunner). The synthetic amphidiploid, used to
overcome the reproductive barriers between the wild dip-
loids and the cultivated species, allowed the genome-wide
analysis of the transmission of chromatin between wild
and cultivated species of the genus Arachis. However, the
wild parents used to create the amphidiploid (A. batizocoi,
A. cardenasii and A. diogoii) are unlikely to be the ancestors
of A. hypogaea [12,19-21]. The genetic mapping of popu-
lations derived from the cross between the most probable
wild progenitors of A. hypogaea and a cultivated peanut
variety has, to our knowledge, never been reported.
Genome-wide introgression of a small fraction of the wild
genome species while keeping the genetic background of
the cultivated is a good mean to explore the largely
untapped reservoir of useful alleles of interest that remain
in the wild species. This is especially interesting for species
with narrow genetic basis. This approach has been widely
utilized for the introgression of favourable QTL(s) for var-
ious traits in tomato [22-26], in rice [27-32], in wheat [33]
and in barley [34,35]. In peanut, the reproductive barriers
between wild and cultivated species, the technical difficul-
ties encountered in making large number of crosses as
well as the short period between sowing and flowering
have impeded the efforts to apply a Marker Assisted Back-
cross (MABC) approach for the development of interspe-
cific introgression line populations.
In this study, we report for the first time the development
and the analysis of the genome-wide segment introgres-
sions of the most probable wild progenitors of the culti-
vated peanut species (A. duranensis and A. ipaënsis) into
the background of the cultivated Fleur 11 variety through
BMC Plant Biology 2009, 9:103 />Page 3 of 13
(page number not for citation purposes)
the construction of a SSR genetic map as well as the eval-
uation of the coverage and the length of the wild genome
segments in a BC
1
F
1
and BC
2
F
1
populations. This work
benefits from the recently developed synthetic amphidip-
loid (A. ipaënsis × A. duranensis)
4X
[5] that made possible
the interspecific introgressions.
Methods
Plant material
A panel comprising 2 wild diploid accessions (A. duranen-
sis V14167 diploid AA and A. ipaënsis KG30076 diploid
BB), a tetraploid AABB amphidiploid (A. ipaënsis × A.
duranensis)
4X
, hereafter called AiAd and a cultivated tetra-
ploid AABB variety (Fleur 11), was used in this study. The
amphidiploid was developed by Favero et al. [5] by cross-
ing A. ipaënsis KG30076 (B genome) with A. duranensis
V14167 (A genome). The resulting F
1
was doubled with
colchicine to produce a fertile fixed synthetic amphidip-
loid. Fleur 11, a local peanut variety grown in Senegal, is
a Spanish type short cycle variety, high yielding and toler-
ant to drought. A BC
1
F
1
and a BC
2
F
1
populations deriving
from the cross between Fleur 11 used as female recurrent
parent and the amphidiploid AiAd were produced. The
BC
1
F
1
and BC
2
F
1
populations were developed under
greenhouse conditions in Senegal in 2006 and 2008
respectively. The crossing scheme used to generate the two
populations is shown in Figure 1. The BC
1
F
1
population
comprised 88 individuals. Forty six BC
1
F
1
plants were
selected based on introgression analysis and crossed with
the Fleur 11 recurrent parent to produce the BC
2
F
1
gener-
ation.
DNA Isolation
Young leaves were harvested from 15 day old plants and
immediately stored at 4°C in ice before DNA extraction.
DNA was extracted from 100 mg of fresh leaves following
a slightly modified MATAB protocol [36]. Briefly, leaves
were ground in liquid nitrogen using a mortal and pestle
and dissolved in 750 μL of MATAB buffer at 74°C. The
samples were incubated 20 minutes at 74°C and cooled
during 5 minutes at room temperature. A volume of 750
μL of CIA (24:1) was added in each sample and all sam-
ples were shaken gently until homogenization before cen-
trifugation at 12000 rpm during 20 minutes. The
supernatant was harvested and the DNA was precipitated
with 600 μL of 2-propanol. After centrifugation, pellets
were washed with 300 μL of 70% ethanol, air dried and
dissolved in 500 μL of TE.
Microsatellite Analysis
Four hundred twenty three already-published SSR mark-
ers [12,15,21,37-45] plus 135 unpublished long size SSR
markers from EMBRAPA and the Universidade Católica de
Brasília were used in this study. A total of 558 SSR markers
have been screened for polymorphism on the amphidip-
loid and its two wild diploid parents, and on the culti-
vated Fleur 11 variety. For a given SSR locus, the forward
primer was designed with a 5'-end M13 tail (5'-CAC-
GACGTTGTAAAACGAC-3'). PCR amplifications were
performed in a MJ Research PTC-100™ thermocycler
(Waltham, MA, USA) or in an Eppendorf Mastercycler on
25 ng of DNA in a 10 μl final volume of buffer (10 mM
Tris-HCl (pH 8), 100 mM KCl, 0.05% w/v gelatin, and 2.0
mM MgCl2) containing 0.1 μM of the M13-tailed primer,
0.1 μM of the other primer, 160 μM of dNTP, 1 U of Taq
DNA polymerase (Life Technologies, USA.) and 0.1 μM of
M13 primer-fluorescent dye IR700 or IR800 (MWG, Ger-
many). The touchdown PCR programme used was as fol-
low: initial denaturation at 95°C for 1 min; following by
10 cycles of 94°C for 30 s, Tm (+5°C, -0.5°C/cycle) for 1
min, and 72°C for 1 min. After these cycles, an additional
round of 25 cycles of 94°C for 30 s, Tm for 1 min, and
72°C for 1 mn and a final elongation step at 72°C for 8
min was performed. IR700 or IR800-labeled PCR prod-
ucts were diluted 7-fold and 5-fold respectively, subjected
to electrophoresis in a 6.5% polyacrylamide gel and then
sized by the IR fluorescence scanning system of the
sequencer (LI-COR, USA). Migration images were ana-
lysed using Jelly 0.1 (Rami, unpublished) and exported as
a data table. Segregations were checked for distortion to
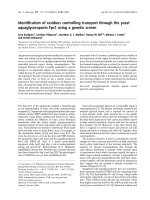
Breeding scheme used in the studyFigure 1
Breeding scheme used in the study. The cultivated Fleur
11 variety was used as female parent to produce the F
1
and
the BC
1
F
1
individuals, and as male parent for producing the
BC
2
F
1
individuals.
Fleur11 x F1
88 BC
1
Genetic map construction
and selection of 46 BC
1
to
be advanced in BC
2
46 BC
1
x Fleur11
Fleur11 x AiAd
123 BC
2
BMC Plant Biology 2009, 9:103 />Page 4 of 13
(page number not for citation purposes)
the expected 1:1 ratio using a Chi
2
test at a significance
level of 0.05.
Genetic map construction
The polymorphic markers were used to genotype 88 indi-
viduals of the BC
1
F
1
population. The linkage analysis was
performed using Mapdisto software version 1.7.2.4 [46]
and CarthaGene software version 1.0 [47]. The origins of
the alleles (A or B genomes) were determined by compar-
ison to the alleles coming from the diploid progenitors of
the amphidiploid. Mapdisto software was used in a first
step, for the linkage group determination and marker
ordering within each linkage group. A minimum LOD of
4 and maximum recombination fraction of 0.3 were fixed
for the linkage group determination using the "find
groups" command. The order of the markers within each
linkage group was estimated using the "order" command.
The markers that had not been placed at LOD 4 were tried
at decreasing LOD, down to a LOD of 2 and a maximum
recombination fraction of 0.3. These markers are indi-
cated in italic on the map (Figure 2). The quality of the
genotyping data at a specific marker was controlled using
the "drop locus" command. The few markers having bad
quality genotyping data were discarded from the linkage
analysis. In a second step, CarthaGene software was used
for the optimization of the best marker order determined
by Mapdisto. This was done applying the simulated
"annealing" and "greedy" algorithms. The best maps
obtained were improved using the "Flips" and the
"Polish" commands. Genetic distances between markers
were computed using Kosambi mapping function.
Introgression analysis
From the map of 298 SSR markers previously developed
on the BC
1
F
1
generation, a framework map comprising
115 SSR markers was derived. Compared to the initial
map, this framework offered a regular coverage of all the
linkage groups. These 115 SSR markers were used to gen-
otype 123 BC
2
F
1
individuals.
Introgression analysis of the BC
1
F
1
and BC
2
F
1
populations
was performed using the CSSL Finder software version
0.8b4 [48]. To select a subset of BC
1
F
1
and BC
2
F
1
lines pro-
viding an optimal coverage of donor genome into the
recurrent background, we imposed a target length of the
introgressed wild segments of 20 cM, an overlapping of
adjacent segments for a given LG and the best possible
return to the background of the cultivated variety.
The percentage of wild genome in the BC
1
F
1
and BC
2
F
1
generations and its relative diminution between the two
generations, the mean size of wild introgression segments
per LG and per generation, as well as the distribution of
the wild segment lengths were estimated using the geno-
typing data available for each generation. The analysis was
conducted on LGs longer than 75 cM. The lengths of the
introgressed segments were calculated as the sum of con-
secutive intervals having a heterozygous genotype plus
half the size of each flanking interval having a recurrent
homozygous genotype.
Results
SSR polymorphism and origin of the markers
Among the 558 SSR markers screened, 333 (59.6%) were
polymorphic between Fleur 11 and AiAd. At a given SSR
locus, the sub-genomic origin of the alleles was deter-
mined by comparison with the alleles of the diploid par-
ents of the amphidiploid A. ipaënsis and A. duranensis that
were included on each gel. This allowed distinguishing
three categories of markers among the 333 polymorphic
markers: 174 SSRs that were polymorphic for the A
genome (52.0%), 77 SSRs that were polymorphic for the
B genome (23.0%) and 82 SSRs that were polymorphic
for the two genomes (24.5%). The largest proportion of
polymorphic markers originated from the A genome
donor A. duranensis (76.6%), the B genome donor A.
ipaënsis generating 47.6% of polymorphic markers.
Genetic map construction
Among the 333 polymorphic SSRs, we randomly selected
118 markers polymorphic for the A genome, all the mark-
ers polymorphic the B genome and those polymorphic for
the two genomes. A total of 277 SSRs were used to geno-
type the population of 88 BC
1
F
1
individuals. The 232 SSR
markers that showed a clear electrophoretic profile ampli-
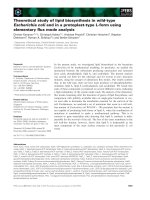
fied 322 loci. Finally, 298 loci were mapped in 21 linkage
groups (LGs), spanning a total map distance of 1843.7 cM
with an average distance of 6.1 cM between adjacent
markers (Figure 2). The difference of polymorphism
between the A and B genomes had an effect on the
number of markers mapped on each genome, and the
number and size of the linkage groups. For the A genome,
181 loci were mapped in 10 LGs with a number of mark-
ers per LGs varying between 12 and 30 (average of 18.1),
and the length of the LGs ranging from 73.7 cM to 145.2
cM (average of 100.5 cM). For the B genome, 117 loci
were mapped on 11 LGs with a number of markers per
LGs varying between 4 and 17 (average of 10.7) and the
length of the LGs ranging from 15.1 cM to 111.6 cM (aver-
age of 76.2 cM).
The comparison of the A and B genomes was undertaken
using 53 SSR markers that mapped on both A and B LGs.
The A and B LGs were considered to be homeologous
when they shared at least 2 common markers. This
allowed distinguishing 8 pairs of homeologous LGs (a01/
b01, a02/b02, a03/b03, a04/b04, a05/b05, a06/b06, a09/
b09 and a10/b10) and one quadruplet involving the LGs
a07, b07, a08 and b08. LG a07 shared three markers with
the upper part of LG b07 corresponding to at least the half
BMC Plant Biology 2009, 9:103 />Page 5 of 13
(page number not for citation purposes)
Genetic map and synteny between the A and the B genomesFigure 2
Genetic map and synteny between the A and the B genomes. The LGs deriving from the A genome are named from
a01 to a10 and those deriving from the B genome from b01 to b11. Map distances are given in Kosambi centimorgans. Com-
mon markers between pair of homeologous LGs are underlined and connected with dashed lines. Markers placed at LOD < 4
are represented in italics, and those that amplified more than one locus on the same genome are identified by the number 1, 2
and 3. Loci showing significant segregation distortion (P < 0.05) are identified by stars following locus name. The colour and
number of stars specify the direction and the intensity of the segregation distortion respectively. Blue: markers skewed toward
the alleles of the cultivated parent. Red: markers skewed toward the alleles of the wild parent.
!!
∀
∀
∀
∀
#
∀
∀
∀
∀
#
∀
∀
!!!
∀!!
!!
!!!
!
!
!
!
∃#
#
∃#
∀
∀
∀
∀
%&
#
#
∀
#
∀
#
#
#
!!!!!
!!
!!
!
#!
!
#
∀
!
#
∀
#
∀
∀
∀
#
!!!
∀
∋
∀
&
#
!
!
!!
#!!!
!
!
!
#
∀
#
!
!
!
∀
#
∀
!
!
!
!!
!!
BMC Plant Biology 2009, 9:103 />Page 6 of 13
(page number not for citation purposes)
of this LG. The lower part of LG b07 shared three markers
with the upper part of LG a08. Furthermore, the lower part
of LG a08 shared three markers with LG b08 (Figure 2).
The small LG b11 shared 1 marker with LG a03. An overall
good collinearity was observed between homeologous
LGs. However, three inversions of chromosomal segments
were observed on the homeologous LGs a01/b01, a03/
b03, and a09/b09. Small inversions were also observed on
the homeologous LGs a08/b08. These inversions might
result from artefacts as they concerned closely linked
markers with more than one possible order having similar
LOD values. No mosaic composition of linkage groups,
where A genome markers would map together with B
genome markers, was observed.
A total of 32 SSR markers (10.7%) showed significant seg-
regation distortion at P < 0.05. Apart from 4 markers
mapped on LGs b01 (IPAHM037), b04 (TC12A01), b06
(AC2C02), and LG a08 (TC3B05) all the distorted mark-
ers were concentrated in specific zones of 6 different LGs
(a02, b02, a03, b03, b07 and b10). Differences between
the A and B genomes were also observed. For the A
genome, only 8 markers (4.4%) showed segregation dis-
tortions compared to 24 (20.3%) for the B genome. For
the A genome, in the zones of distortion of LGs a02 and
a03, all the distorted markers were skewed toward the
alleles of the cultivated parent. For the B genome, the
zones of distorted markers of LGs b02 and b07 were
skewed toward the allele of the wild parent while those of
b03 and b10 were skewed toward the allele of the culti-
vated parent.
Fifteen primer pairs (AC2C02, Ah-594, PM042,
Seq14D11, Seq18A03, Seq18G09, Seq19H03, Seq3C02,
Seq4H11, Seq9E08, TC11B04, TC9E08, TC19E01,
TC23F04 and TC40C03) amplified consistently more
than one locus on the same genome. We were able to map
the duplicated loci for the markers Ah-594, PM042,
Seq18A03, Seq18G09, Seq19H03, TC11B04 and TC9E08.
Apart from the loci amplified by TC9E08 that mapped on
the same LG (a04), the loci amplified by AC2C02, Ah-
594, PM042, Seq14D11, Seq18A03, Seq18G09,
Seq19H03, Seq3C02, Seq4H11, Seq9E08, TC11B04,
TC19E01, TC23F04 and TC40C03 mapped on different
LGs suggesting possible segmental duplications. These
markers were identified by the number 1, 2 and 3 on the
map (Figure 2).
Comparison with peanut published genetic maps
Conserved structural features between tetraploid maps
The present tetraploid map was compared to the RFLP
based tetraploid BC
1
F
1
map published by Burow et al.
[18], further called "Burow's map" involving a cross
between A. hypogaea variety Florunner and the synthetic
amphidiploid TxAG6 ([(A. batizocoi × (A. cardenasii × A.
diogoii)]
4X
). A. batizocoi was considered to be the B genome
donor and A. cardenasii and A diogoi were the donors of
the A genome. In that cross, 23 LGs spanning a total
genetic distance of 2210 cM (Kosambi mapping function)
were obtained. This map size was slightly larger than our
map. A similar number of loci had been mapped on the A
genome (156 for Burow's map versus 181 for our map)
but the number of loci mapped on the B genome of the
Burow's map was about 2 fold larger than on the present
map (206 versus 117 respectively). The mean length of
the A genome LGs was similar between the 2 maps (93.7
cM for the Burow's map vs 100.5 cM for our map) while
the mean length of the B genome LGs of the Burow's map
was 1.2 larger than that of the present map (94.1 cM for
the Burow's map versus 76.2 cM for our map). The differ-
ence in map size between the two studies seems related to
the difference of the number of mapped markers on the B
genome. Interestingly, conservation of synteny between
one B genome LG and two A genome LGs was observed in
the two maps. On our map, LG b07 shared common
markers with LG a07 and a08 while on Burow's map, LG
19 shared common markers with LG 9.1 and 9.2. Moreo-
ver, Burow et al. [18] has reported structural differences,
mainly chromosome segment inversion, between four
pairs of homeologous LGs (LG1/LG11, LG7/LG17, LG4/
LG14 and LG5/LG15). Inversions of chromosomal seg-
ments have been observed for at least 3 LGs in our map
(a01/b01, a03/b03 and a09/b09).
Comparison with diploid map
The results from the present tetraploid map were com-
pared to the SSR based diploid F
2
map [15], involving a
cross between two wild diploids with A genome, A. duran-
ensis and A. stenosperma. In that population, 11 LGs cover-
ing a total map length of 1230.8 cM (Kosambi mapping
function) have been described. The total map length was
slightly longer than what we obtained in our map when
considering the total size of the LGs of the A genome
(1005.2 cM). The proportion of distorted markers found
in the study of Moretzsohn et al. [15] was higher than
what we recorded for our A genome map (50% versus
4%). Given that a similar number of individuals were
used for the map construction in the two studies, the
length difference between the 2 maps might be related to
the higher proportion of distorted markers on the Moretz-
sohn's map.
The synteny between the 2 maps was assessed with 57
common SSR markers. For all the 10 LGs of the A genome
of our map, we could identify corresponding LGs in the
diploid map with an overall good collinearity. The salient
features of the comparison of the two maps are shown in
Figure 3. The number of common SSR markers per
homologous LGs varied between 2 and 11. However the
synteny was not conserved for four LGs of our map when
compared to the diploid map. LG a02 and a10 of our map
shared 3 (PM230, PM032 and TC4F12) and 2 (AC3C02
BMC Plant Biology 2009, 9:103 />Page 7 of 13
(page number not for citation purposes)
and TC1G04) markers with LG 2 of the diploid map
respectively. LGs 8 and 11 of the diploid map shared 2
(TC1E05, TC9F10) and 4 (RN22A12, TC3B04, TC7A02
and TC3B05) markers with LG a08 of our map respec-
tively. Moreover, LG a06 of our map that was homolo-
gous to LG 6 of the diploid map shared also 2 common
markers (gi-936 and gi-623) with LG 10 of the diploid
map. For LGs a06 and a08 of our map, there was no evi-
dence of spurious linkage between two different LGs as all
the markers in these LGs were mapped at LOD ≥ 4.
Introgression analysis
In the BC
1
F
1
generation, the percentage of heterozygous
genome varied between 26.5% and 77.0% (average of
49.8%) while in the BC
2
F
1
generation it varied between
6.1% and 44.4% (average of 22.2%). This percentage is
slightly inferior to the expected 25%, which is consistent
with the selection that occurred at each generation for the
best possible return to the background of the cultivated
variety. From BC
1
F
1
to BC
2
F
1
, we noted more than 50%
reduction of the wild allele contribution to the genotypic
constitution of the BC
2
F
1
individuals. The distribution of
the lengths of the wild segments in the BC
1
F
1
and the
BC
2
F
1
generations was calculated for 14 LGs having a
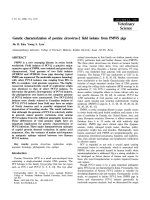
length comprised between 75 and 145.2 cM (Figure 4).
The average lengths of the wild introgressed segments into
the background of the cultivated were 51.8 cM in BC
1
F
1
and 34.9 cM in BC
2
F
1
. From BC
1
F
1
to BC
2
F
1
generations,
the segment lengths decreased of 33%. As shown in Figure
4, more than 15% of the BC
1
F
1
lines and 20% of the BC
2
F
1
lines had segment lengths comprised between 20 and 30
cM.
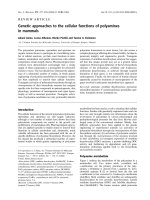
Salient features of the comparison between the A genome LGs of our tetraploid BC1 map and the diploid AA map published by Moretzsohn et al. (2005)Figure 3
Salient features of the comparison between the A genome LGs of our tetraploid BC1 map and the diploid AA
map published by Moretzsohn et al. (2005). The LGs from this study are named a01, a02, a10, a06, and a08. The LGs of
Moretzohn's map (01A, 02A, 06A, 10A, 08A and 11A) are represented by a green bar. Common markers between corre-
sponding LGs in the two maps are indicated in blue, underlined and connected with dashed lines. In the two maps the distances
are given in Kosambi centimorgans.
!
"
#
"
"
"
!
!
!
!
!
$
!
!
!
!
"
!
!
"
"
"
!
"
"
!
!
%
!
!
"
"
!
BMC Plant Biology 2009, 9:103 />Page 8 of 13
(page number not for citation purposes)
The CSSL-Finder software was used to select a subset of
BC
1
F
1
lines and, then, of BC
2
F
1
lines, which ensured, in
each generation, an optimal coverage of the wild genome
with overlapping target segment lengths of 20 cM between
neighbouring lines and the best possible return to the cul-
tivated background. In the BC
1
F
1
population, a subset of
22 lines was selected. The segment lengths ranged
between 2.3 cM and 89.4 cM (mean of 34.8 cM). All the
adjacent segments were in overlapping position and the
genome percentage of the recurrent cultivated variety
ranged between 38% and 68% (mean 52%). In the BC
2
F
1
population, a subset of 59 lines was selected. The segment
lengths ranged between 2.3 cM and 46.9 cM (mean of
24.5 cM) and the percentage of the recurrent background
between 62% and 94% (mean of 79%). A graphical repre-
sentation of the BC
2
F
1
selected lines is shown in Figure 5.
The level of coverage of the wild introgressed segments in
the background of the cultivated variety was optimal both
in the BC
1
F
1
and BC
2
F
1
populations.
Discussion
In this study, the construction of a tetraploid molecular
genetic map using a BC
1
F
1
population and the develop-
ment of a BC
2
F
1
population allowed the analysis of the
introgression of wild alleles in the background of a culti-
vated peanut variety. Several points have been highlighted
including (1) the low level of polymorphism of the SSR
markers especially between the B wild genome A. ipaënsis
and the B genome of the cultivated, (2) the collinearity
between the A and B genomes, the synteny between tetra-
ploid and diploid maps, and the similarity between tetra-
ploid maps, (3) the good level of introgression of the wild
genome segments in the background of the cultivated
variety.
SSR polymorphism data is consistent with A. duranensis
and A. ipaënsis being the most probable progenitors of the
cultivated species
Cultivated peanut Arachis hypogaea is considered to be an
allotetraploid (2n = 4x = 40) originated from a single
hybridization event between two wild diploids with A and
B genomes [3], followed by spontaneous duplication of
the chromosomes. The identification of the wild progeni-
tors of the cultivated peanut has been the object of numer-
ous investigations using various approaches including
cross-compatibility [5], molecular markers
[4,12,20,21,49,50], biogeography [51], gene sequence
comparison [52], physical mapping of rRNA genes [53]
and Genome In Situ Hybridization (GISH) [6]. The most
probable hypothesis gave A. duranensis as the wild donor
of the A genome and A. ipaënsis as the wild donor of the B
genome. In our study, a close relationship has been
Distribution of donor segment lengths as calculated for both the BC
1
F
1
and the BC
2
F
2
generations derived from the cross between Fleur 11 cultivated variety and the synthetic amphidiploid AiAdFigure 4
Distribution of donor segment lengths as calculated for both the BC
1
F
1
and the BC
2
F
2
generations derived
from the cross between Fleur 11 cultivated variety and the synthetic amphidiploid AiAd.
BMC Plant Biology 2009, 9:103 />Page 9 of 13
(page number not for citation purposes)
observed between the putative wild progenitor's A. duran-
ensis and A. ipaënsis and the cultivated A. hypogaea var.
Fleur 11 based on 558 SSR markers. A. duranensis and A.
ipaënsis shared 54.1% and 72.6% of common SSR alleles
with the A genome and the B genome of A hypogaea
respectively. Moreover, 59.8% polymorphism was
observed between the synthetic amphidiploid AiAd and
the cultivated Fleur 11 variety. This is lower than the 83%
of polymorphism that has been observed between the
synthetic polyploid TxAG6 ([(A. batizocoi × (A. cardenasii
× A. diogoii)]
4X
) and the cultivated Florunner variety based
on RFLP markers [18]. This result indicates that A. duran-
ensis and A. ipaiensis are more closely related to the A and
the B genomes of the cultivated species than are A. carde-
nasii and A. diogoi for the A and A. batizocoi for the B
genomes respectively. Moreover, the BC
1
tetraploid map
obtained by crossing the synthetic amphidiploid AiAd
and Fleur 11 indicated a disomic inheritance of all loci.
For all the LGs obtained, the markers that were polymor-
phic for the A genome mapped on A LGs and those poly-
morphic for the B genome mapped on B LGs. The
chromosome pairing seems to happen between "homolo-
gous genome" attesting the high affinity between A.
duranensis and the A genome of the cultivated species, and
Graphical genotype of the selected BC
2
F
1
linesFigure 5
Graphical genotype of the selected BC
2
F
1
lines. Each row represented a candidate line and each column a Linkage
Group. The green colour indicates the heterozygous (wild/cultivated) segments and the orange colour the homozygous
regions for cultivated alleles. The gray colour indicates missing data.
25
16
27
26
95
37
8
3
19
40
24
45
81
104
39
17
43
36
10
74
1
102
100
38
13
14
99
7
41
5
87
28
9
77
31
54
96
34
97
68
23
66
90
93
84
12
4
70
33
57
69
86
6
61
49
22
89
48
56
91
55
114
112
46
50
a01
b01
a02
b02
a03
b03
a04
b04
a05
b05
a06
b06
a07
b07
a08
b08
a09
b09
a10
b10
b11
BMC Plant Biology 2009, 9:103 />Page 10 of 13
(page number not for citation purposes)
between A. ipaënsis and the B genome of the cultivated
species. The same results have also been reported by Seijo
et al. [6]. Our data fit well with the earlier reports indicat-
ing A. duranensis and A. ipaënsis as the most probable dip-
loid progenitors of the cultivated peanut.
Genome rearrangements
In this study, the synteny analysis between the A and B
genomes revealed inversion of chromosomal segments
for at least three LGs, and a particular feature of synteny
involving the LGs a07, b07, a08 and b08 (Figure 2). Con-
servation of synteny between the upper region of LGs a07
and b07, and between LG b08 and the lower region of LG
a08 has been pointed out. Furthermore, the upper region
of LG a08 shared also three markers with the lower region
of LG a07 while LG b08 lacked a large chromosomal seg-
ment that could correspond to the region of conserved
synteny between LGs b07 and a08. These observations are
consistent with a major translocation event that has
occurred between LGs b07 and b08. Similar feature of
synteny conservation between two LGs of the B genome
and two LGs of the A genome have also been reported at
the diploid level when comparing the A. duranensis × A.
stenosperma diploid AA map [15] and the A. ipaënsis × A.
magna diploid BB map [16]. Interestingly, the quadruplet
of syntenic LGs in the diploid maps was also found to be
syntenic with those in our map (data not shown). These
observations suggest that the rearrangement between LGs
b07 and b08 is an ancient translocation event that hap-
pened prior to the tetraploidisation of the cultivated pea-
nut.
Chromosome rearrangements, including the inversion of
chromosomal segments within pairs of homeologous
linkage groups and the conservation of synteny between a
triplet of LGs (one LG of the B genome sharing common
markers with two LGs of the A genome) have also been
reported by Burow et al. [18]. We were not able to identify
which LGs of our map are in synteny with those of the
Burow's map due to the difference of the marker types
used in the two studies.
The similarity of the rearrangement events observed in the
diploid and the tetraploid maps, which involve different
species for A and B genomes, suggests that these evolu-
tionary mechanisms have contributed to the divergence of
the A and B genomes of the section Arachis. It also raises
the question of the classification of the B genome species.
The relationships between species with B genome remain
controversial. Using RFLP makers, Gimenes et al. [44]
reported a clustering of A. batizocoi and A. magna which
were less related to A. ipaënsis, while with SSR markers,
Moretzsohn et al. [21] reported a clustering of the species
with B genome including A. batizocoi, A. magna and A.
ipaënsis. Seijo et al. [6] reported, based on GISH, the dis-
tinction of A. batizocoi from the other B genome species
and concluded that species with B genome do not seem to
constitute a natural group.
The results obtained from the comparison of the diploid
and tetraploid maps suggest that, based on the similarities
of the rearrangement event, the species with B genome A.
ipaënsis, A. magna and A. batizocoi could have derived from
a common B genome ancestor and could be more closely
related than what was previously reported based on
molecular makers and on GISH. The construction of a
consensus molecular genetic map involving the available
diploid AA and BB maps and the tetraploid AABB maps as
well as the study of crossability between species with B
genome should shed new light on this issue.
Modifications of parental diploid genome following poly-
ploidization, have been reported (for review see, [54,55]).
The modifications include structural rearrangements,
transposable element activation, difference in gene
expression and epigenetic changes. These changes were
observed in old polyploid [56-59] as well as in newly syn-
thesized amphidiploids [60-62]. Rapid and dynamic
changes in genome structure, including non additive
inheritance of genomic fragments and genome-specific
sequence deletion have been described in some taxa
including Brassica [61] and wheat synthetic allotetra-
ploids [63], but not in others including cotton [64] and
sugarcane [65]. In peanut, Burow et al. [18] reported a
possible genomic restructuring in the synthetic amphidip-
loid TxAG6 characterized by 5% of mapped alleles having
unknown parental origins. In our study, we utilized a syn-
thetic amphidiploid which had undergone several cycles
of self-pollination before crossing with the cultivated
allotetraploid. However, to the level of resolution
afforded by our experiment, no change in genome struc-
ture has been pointed out. Further studies are needed to
confirm the effectiveness and the level of genomic restruc-
turing in peanut synthetic allotetraploid.
Wild segment introgressions and perspectives for the
development of interspecific breeding populations
Few studies have been reported in the literature regarding
the genetic mapping of introgressions from wild to the
cultivated peanut. Apart from the study of Burow et al.
[18], introgression mapping of wild segments in the back-
ground of a cultivated variety has been reported in 46
introgression lines originated from the hybridization
between A. cardenasii × A. hypogaea [66]. Considering all
the lines together, introgressed segments could be found
on 10 of the 11 LGs of the A. stenosperma × A. cardenasii
diploid AA map [14], and represented 30% of the diploid
peanut genome. The mapping of a wild segment from A.
BMC Plant Biology 2009, 9:103 />Page 11 of 13
(page number not for citation purposes)
cardenasii conferring resistance to root-knot nematode
[67] and the registration of two varieties of peanut
'COAN' [68] and 'NemaTAM' [69], having identifiable
alleles conferring resistance to root-knot nematode trans-
ferred from wild species, have also been reported.
In our study, we used a synthetic wild amphidiploid as a
mean for the introgression of alien alleles in the genetic
background of a cultivated variety and, consequently,
enlarging the genetic basis of the cultivated peanut.
Genetic mapping of the wild introgressed segments gave a
clear picture of the amount and the level of coverage of the
wild donor genome in the background of the cultivated,
and of the segment lengths and their relative decrease
from BC
1
F
1
to BC
2
F
1
generation. The mean length of the
wild segments was 51.8 cM in BC
1
F
1
and 34.8 cM in
BC
2
F
1
, and the decrease of segment size from BC
1
F
1
to
BC
2
F
1
was about -33%. These values were similar to what
was obtained in Lycopersicon wild × cultivated backcross
populations [23]. Marker assisted selection of BC
1
F
1
and
then BC
2
F
1
lines carrying the desirable donor segment
with the best possible return to the background of the cul-
tivated variety allowed the selection of a limited set of
lines that offer an optimal coverage of the wild genome
with an overlapping regions between neighbouring lines
and an average segment lengths of 34.8 cM in BC
1
F
1
and
24.5 cM in BC
2
F
1
, as well as a 79% return to the back-
ground of the cultivated variety in BC
2
F
1
. The rapid
decrease of wild segment lengths observed between the
BC
1
F
1
and BC
2
F
1
generations as well as the good level of
recovery of the genetic background of the cultivated vari-
ety in BC
2
F
1
generation is of great interest for the genetic
mapping of QTLs and the development of Introgression
Line (IL) libraries. ILs carrying small wild segments in a
constant cultivated genetic background have the advan-
tages of reducing epistatic and linkage drag effects and of
improving the resolution of QTL mapping [23,70]. Fur-
thermore, ILs are reliable and stable genetic resources that
can be multiplied and evaluated in various environments.
Many valuable sources of resistance to biotic stresses
including resistance to Cercospora leafspot [71], to root-
Knot nematode [67,72], to Peanut Bud Necrosis virus
(PBNV) [73], to late leaf spot disease [74] and sources of
tolerance to abiotic stresses including tolerance to thermal
stress [75] and to drought (Soraya Bertioli, Vincent Vadez
personal communication) were identified in peanut wild
relatives. These sources can be used for genetic improve-
ment in peanut.
The BC
1
F
1
and BC
2
F
1
populations that we developed are
excellent starting points for the development of new
breeding populations such as Advanced Backcross (AB)
and Chromosome Segment Substitution Lines (CSSL)
populations for analysis of the wild alleles contribution to
the improvement of cultivated peanut varieties.
Conclusion
In this study, a nearly saturated genetic map has been
developed from a cross between the synthetic amphidip-
loid AiAd and the cultivated Fleur 11 variety. This allowed
the synteny analysis of the A and B genomes, the compar-
ison with diploid and tetraploid maps and the analysis of
the introgression segments from the most probable wild
progenitors of the cultivated peanut into the background
of the cultivated Fleur 11 variety. The results of this study
confirmed the close relationship between the wild dip-
loids A. duranensis, A. ipaënsis and the cultivated peanut
and highlighted structural rearrangements, such as chro-
mosomal segment inversions and a major translocation
event, between the A and B genome species. Finally, we
showed that the low level of polymorphism reported
between cultivated peanut can be overcome by using the
wild species. The material we have produced in this study
should facilitate the development of AB and CSSL breed-
ing populations for the identification and utilization of
valuable genes from the largely untapped reservoir of use-
ful alleles that remained in the wild peanut species.
Authors' contributions
DF designed and coordinated the study, was involved in
genotyping data production, carried out data analyses and
map construction and drafted the manuscript. HAT, IF
and ON carried out crosses and population development.
RR and MNS were involved in DNA extraction and geno-
typing data production. APF produced the synthetic
amphidiploid AiAd. DJB and JCG were involved in the
design of the study. BC contributed to editing of the man-
uscript and helped in data analysis. JFR conceived,
designed and coordinated the study, was involved in map
construction, and editing of the manuscript.
Acknowledgements
The authors gratefully acknowledge Angelique D'Hont, Jean-Marc Lacape
and Nabila Yahiaoui for the critical review of the manuscript. This study was
funded by the Cirad and the Generation Challenge Programme.
References
1. Krapovickas A, Gregory WC: Taxonomía del género Arachis
(Leguminosae). Bonplandia 1994, 8:1-186.
2. Holbrook CC, Stalker HT: Peanut breeding and genetic
resources. Plant Breeding Reviews 2003, 22:297-355.
3. Kochert G, Stalker HT, Gimenes MA, Galgaro ML, Lopes CR, Moore
K: RFLP and cytogenetic evidence on the origin and evolu-
tion of allotetraploid domesticated peanut, Arachis hypogaea
(Leguminosae). Am J Bot 1996, 83(10):1282-1291.
4. Milla SR, Isleib TG, Stalker HT: Taxonomic relationships among
Arachis sect. Arachis species as revealed by AFLP markers.
Genome 2005, 48(1):1-11.
5. Favero AP, Simpson CE, Valls JF, Vello NA: Study of the evolution
of cultivated peanut through crossability studies among Ara-
BMC Plant Biology 2009, 9:103 />Page 12 of 13
(page number not for citation purposes)
chis ipaensis, A. duranensis, and A. hypogaea. Crop Sci 2006,
46(4):1546-1552.
6. Seijo G, Lavia GI, Fernandez A, Krapovickas A, Ducasse DA, Bertioli
DJ, Moscone EA: Genomic relationships between the culti-
vated peanut (Arachis hypogaea, Leguminosae) and its close
relatives revealed by double GISH. Am J Bot 2007,
94(12):1963-1971.
7. Ramsey J, Schemske DW: Pathways, mechanisms, and rates of
polyploid formation in flowering plants. Annual Review of Ecology
and Systematics 1998, 29(1):467-501.
8. Soltis PS, Soltis DE: The role of genetic and genomic attributes
in the success of polyploids. Proc Natl Acad Sci USA 2000,
97(13):7051-7057.
9. Kochert G, Halward T, Branch WD, Simpson CE: RFLP variability
in peanut (Arachis hypogaea L.) cultivars and wild species.
Theor Appl Genet 1991, 81(5):565-570.
10. Halward T, Stalker T, LaRue E, Kochert G: Use of single-primer
DNA amplifications in genetic studies of peanut (Arachis
hypogaea L.). Plant Mol Biol 1992, 18(2):315-325.
11. He G, Prakash CS: Identification of polymorphic DNA markers
in cultivated peanut (Arachis hypogaea L.). Euphytica 1997,
97:143-149.
12. Hopkins MS, Casa AM, Wang T, Mitchell SE, Dean RE, Kochert GD,
Kresovich S: Discovery and characterization of polymorphic
simple sequence repeats (SSRs) in peanut. Crop Science 1999,
39:1243-1247.
13. Varshney R, Bertioli D, Moretzsohn M, Vadez V, Krishnamurthy L,
Aruna R, Nigam S, Moss B, Seetha K, Ravi K, et al.: The first SSR-
based genetic linkage map for cultivated groundnut (Arachis
hypogaea L.). Theor Appl Genet 2008, 118(4):729-739.
14. Halward T, Stalker HT, Kochert G: Development of an RFLP
linkage map in diploid peanut species. Theor Appl Genet 1993,
87(3):379-384.
15. Moretzsohn M, Leoi L, Proite K, Guimarães P, Leal-Bertioli S,
Gimenes M, Martins W, Valls J, Grattapaglia D, Bertioli D: A micro-
satellite-based, gene-rich linkage map for the AA genome of
Arachis (Fabaceae). Theor Appl Genet 2005, 111:1060-1071.
16. Moretzsohn MC, Barbosa AV, Alves-Freitas DM, Teixeira C, Leal-
Bertioli SC, Guimaraes PM, Pereira RW, Lopes CR, Cavallari MM,
Valls JF, et al.: A linkage map for the B-genome of Arachis
(Fabaceae) and its synteny to the A-genome. BMC Plant Biol
2009, 9:40.
17. Bertioli D, Moretzsohn M, Madsen L, Sandal N, Leal-Bertioli S, Gui-
maraes P, Hougaard B, Fredslund J, Schauser L, Nielsen A, et al.: An
analysis of synteny of Arachis with Lotus and Medicago sheds
new light on the structure, stability and evolution of legume
genomes. BMC Genomics 2009, 10(1):45-45.
18. Burow MD, Simpson CE, Starr JL, Paterson AH: Transmission
genetics of chromatin from a synthetic amphidiploid to cul-
tivated peanut (Arachis hypogaea L.). broadening the gene
pool of a monophyletic polyploid species. Genetics 2001,
159(2):823-837.
19. Raina SN, Mukai Y: Genomic in situ hybridization in Arachis
(Fabaceae) identifies the diploid wild progenitors of culti-
vated (A. hypogaea) and related wild (A. monticola) peanut
species. Plant Systematics and Evolution 1999, 214(1):251-262.
20. Gimenes MA, Lopes CR, Galgaro ML, Valls JF, Kochert G: RFLP
analysis of genetic variation in species of section Arachis,
genus Arachis (Leguminosae). Euphytica 2002, 123:421-429.
21. Moretzsohn M, Hopkins M, Mitchell S, Kresovich S, Valls J, Ferreira M:
Genetic diversity of peanut (Arachis hypogaea L.) and its wild
relatives based on the analysis of hypervariable regions of
the genome. BMC Plant Biol 2004, 4:11-11.
22. Eshed Y, Zamir D: An introgression line population of Lycoper-
sicon pennellii in the cultivated tomato enables the identifica-
tion and fine mapping of yield-associated QTL. Genetics 1995,
141(3):1147-1162.
23. Tanksley SD, Grandillo S, Fulton TM, Zamir D, Eshed Y, Petiard V,
Lopez J, Beck-Bunn T: Advanced backcross QTL analysis in a
cross between an elite processing line of tomato and its wild
relative L. pimpinellifolium. Theor Appl Genet 1996,
92(2):213-224.
24. Fulton TM, Beck-Bunn T, Emmatty D, Eshed Y, Lopez J, Petiard V,
Uhlig J, Zamir D, Tanksley SD: QTL analysis of an advanced back-
cross of Lycopersicon peruvianum to the cultivated tomato
and comparisons with QTLs found in other wild species.
Theor Appl Genet 1997, 95(5):881-894.
25. Fridman E, Carrari F, Liu Y-S, Fernie AR, Zamir D: Zooming in on
a quantitative trait for tomato yield using interspecific intro-
gressions. Science 2004, 305(5691):1786-1789.
26. Lippman ZB, Semel Y, Zamir D: An integrated view of quantita-
tive trait variation using tomato interspecific introgression
lines. Current Opinion in Genetics & Development 2007,
17(6):545-552.
27. Wan XY, Su JM, Wang CC, Shen CM, Li JM, Wang HL, Jiang L, Liu SJ,
Chen LM, Yasui H, Yoshimura A: QTL detection for eating qual-
ity of cooked rice in a population of chromosome segment
substitution lines. Theor Appl Genet 2004, 110(1):71-79.
28. Wang YM, Dong ZY, Zhang ZJ, Lin XY, Shen Y, Zhou D, Liu B:
Extensive de novo genomic variation in rice induced by
introgression from wild rice (Zizania latifolia Griseb.). Genet-
ics 2005, 170(4):1945-1956.
29. Li JZ, Huang HQ, Heinrichs F, Ganal MW, Röder RS: Analysis of
QTLs for yield, yield components, and malting quality in a
BC 3-DH population of spring barley. Theor Appl Genet 2005,
110(2):356-363.
30. Xu JL, Lafitte HR, Gao YM, Fu BY, Torres R, Li ZK:
QTLs for
drought escape and tolerance identified in a set of random
introgression lines of rice. Theor Appl Genet 2005,
111(8):1642-1650.
31. Zhang X, Zhou S, Fu Y, Su Z, Wang X, Sun C: Identification of a
drought tolerant introgression line derived from dongxiang
common wild rice (O. rufipogon Griff.). Plant Mol Biol 2006,
62(1):247-259.
32. Zhao XQ, Xu JL, Zhao M, Lafitte R, Zhu LH, Fu BY, Gao YM, Li ZK:
QTLs affecting morph-physiological traits related to
drought tolerance detected in overlapping introgression
lines of rice (Oryza sativa L.). Plant Science 2008, 174(6):618-625.
33. Liu S, Zhou R, Dong Y, Li P, Jia J: Development, utilization of
introgression lines using a synthetic wheat as donor. Theor
Appl Genet 2006, 112(7):1360-1373.
34. von Korff M, Wang H, Léon J, Pillen K: AB-QTL analysis in spring
barley: III. Identification of exotic alleles for the improve-
ment of malting quality in spring barley (H. vulgare ssp. spon-
taneum). Molecular Breeding 2007, 21(1):81-93.
35. Schmalenbach I, Léon J, Pillen K: Identification and verification of
QTLs for agronomic traits using wild barley introgression
lines. Theor Appl Genet 2009, 118(3):483-497.
36. Risterucci AM, Grivet L, N'Goran JA, Pieretti I, Flament MH, Lanaud
C: A high-density linkage map of Theobroma cacao L. Theor
Appl Genet 2000, 101(5):948-955.
37. Palmieri DA, Hoshino AA, Bravo JP, Lopes CR, Gimenes MA: Isola-
tion and characterization of microsatellite loci from the for-
age species Arachis pintoi (Genus Arachis). Molecular Ecology
Notes 2002, 2:551-553.
38. He G, Meng R, Newman M, Gao G, Pittman RN, Prakash C: Micros-
atellites as DNA markers in cultivated peanut (Arachis
hypogaea L.). BMC Plant Biol 2003, 3:3-3.
39. Ferguson ME, Burow MD, Schulze SR, Bramel PJ, Paterson AH, Kres-
ovich S, Mitchell S: Microsatellite identification and characteri-
zation in peanut (A. hypogaea L.). Theor Appl Genet 2004,
108:1064-1070.
40. Palmieri DA, Bechara MD, Curi RA, Gimenes MA, Lopes CR: Novel
polymorphic microsatellite markers in section Caulorrhizae
(Arachis, Fabaceae). Molecular Ecology Notes 2005, 5:77-79.
41. Bravo JP, Hoshino AA, Angelici CMLCD, Lopes CR, Gimenes MA:
Transferability and use of microsatellite markers for the
genetic analysis of the germplasm of some Arachis section
species of the genus Arachis. Genetics and Molecular Biology 2006,
29:516-524.
42. Hoshino AA, Bravo JP, Angelici CMLCD, Barbosa AaVG, Lopes CR,
Gimenes MA: Heterologous microsatellite primer pairs
informative for the whole genus Arachis. Genetics and Molecular
Biology 2006, 29:665-675.
43. Proite K, Leal-Bertioli SCM, Bertioli DJ, Moretzsohn MC, Silva FRd,
Martins NF, Guimarães PM: ESTs from a wild Arachis species for
gene discovery and marker development. BMC Plant Biol 2007,
7:7-7.
44. Gimenes M, Hoshino A, Barbosa A, Palmieri D, Lopes C: Character-
ization and transferability of microsatellite markers of the
Publish with BioMed Central and every
scientist can read your work free of charge
"BioMed Central will be the most significant development for
disseminating the results of biomedical research in our lifetime."
Sir Paul Nurse, Cancer Research UK
Your research papers will be:
available free of charge to the entire biomedical community
peer reviewed and published immediately upon acceptance
cited in PubMed and archived on PubMed Central
yours — you keep the copyright
Submit your manuscript here:
/>BioMedcentral
BMC Plant Biology 2009, 9:103 />Page 13 of 13
(page number not for citation purposes)
cultivated peanut (Arachis hypogaea). BMC Plant Biol 2007,
7(9):.
45. Cuc L, Mace E, Crouch J, Quang V, Long T, Varshney R: Isolation
and characterization of novel microsatellite markers and
their application for diversity assessment in cultivated
groundnut (Arachis hypogaea). BMC Plant Biol 2008, 8(1):55-55.
46. Lorieux M: MapDisto, A Free User-Friendly Program For
Computing Genetic Maps. Plant and Animal Genome XV confer-
ence. San Diego, CA 2007:P958.
47. De Givry S, Bouchez M, Chabrier P, Milan D, Schiex T:
CARTHAGENE: multipopulation integrated genetic and
radiated hybrid mapping. Bioinformatics 2005, 21(8):1703-1704.
48. MapDisto Genetics Software: CSSL Finder [http://map
disto.free.fr/CSSLFinder/]
49. Singh AK, Smartt J: The genome donors of the groundnut/pea-
nut (Arachis hypogaea L.) revisited. Genetic Resources and Crop
Evolution 1998, 45(2):113-116.
50. Raina SN, Rani V, Kojima T, Ogihara Y, Singh KP, Devarumath RM:
RAPD and ISSR fingerprints as useful genetic markers for
analysis of genetic diversity, varietal identification, and phyl-
ogenetic relationships in peanut (Arachis hypogaea) cultivars
and wild species. Genome 2001, 44:763-772.
51. Ferguson ME, Jarvis A, Stalker HT, Williams DE, Guarino L, Valls JFM,
Pittman RN, Simpson CE, Bramel PJ: Biogeography of wild Arachis
(Leguminosae):distribution and environmental characterisa-
tion. Biodiversity and Conservation 2005, 14(7):1777-1798.
52. Jung S, Tate PL, Horn R, Kochert G, Moore K, Abbott AG: The phy-
logenetic relationship of possible progenitors of the culti-
vated peanut. J Hered 2003, 94(4):334-340.
53. Seijo JG, Lavia GI, Fernandez A, Krapovickas A, Ducasse D, Moscone
EA: Physical mapping of the 5S and 18S-25S rRNA genes by
FISH as evidence that Arachis duranensis and A. ipaensis are
the wild diploid progenitors of A. hypogaea (Leguminosae).
Am J Bot 2004, 91:1294-1303.
54. Soltis DE, Soltis PS: Polyploidy: recurrent formation and
genome evolution. Trends in Ecology & Evolution 1999,
14(9):348-352.
55. Doyle JJ, Flagel LE, Paterson AH, Rapp RA, Soltis DE, Soltis PS, Wen-
del JF: Evolutionary genetics of genome merger and doubling
in plants. Annual Review of Genetics 2008, 42(1):443-461.
56. Wendel JF: Genome evolution in polyploids. Plant Mol Biol 2000,
42(1):225-249.
57. Rieseberg LH: Chromosomal rearrangements and speciation.
Trends in Ecology & Evolution 2001, 16(7):351-358.
58. Liu B, Wendel JF: Epigenetic phenomena and the evolution of
plant allopolyploids.
Molecular Phylogenetics and Evolution 2003,
29(3):365-379.
59. Clarkson JJ, Lim KY, Kovarik A, Chase MW, Knapp S, Leitch AR:
Long-term genome diploidization in allopolyploid Nicotiana
section Repandae (Solanaceae). New Phytologist 2005,
168(1):241-252.
60. Adams KL, Wendel JF: Polyploidy and genome evolution in
plants. Current Opinion in Plant Biology 2005, 8(2):135-141.
61. Chen ZJ, Ni Z: Mechanisms of genomic rearrangements and
gene expression changes in plant polyploids. BioEssays 2006,
28(3):240-252.
62. Nicolas SD, Mignon GL, Eber F, Coriton O, Monod H, Clouet V,
Huteau V, Lostanlen A, Delourme R, Chalhoub B, et al.: Homeolo-
gous recombination plays a major role in chromosome rear-
rangements that occur during meiosis of Brassica napus
haploids. Genetics 2007, 175(2):487-503.
63. Liu B, Vega JM, Feldman M: Rapid genomic changes in newly syn-
thesized amphiploids of Triticum and Aegilops. II. Changes in
low-copy coding DNA sequences. Genome 1998, 41(4):535-542.
64. Liu B, Brubaker CL, Mergeai G, Cronn RC, Wendel JF: Polyploid
formation in cotton is not accompanied by rapid genomic
changes. Genome 2001, 44(3):321-330.
65. Jannoo N, Grivet L, Chantret N, Garsmeur O, Glaszmann JC, Arruda
P, D'Hont Al: Orthologous comparison in a gene-rich region
among grasses reveals stability in the sugarcane polyploid
genome. The Plant Journal 2007, 50(4):574-585.
66. Garcia GM, Stalker HT, Kochert G: Introgression analysis of an
interspecific hybrid population in peanuts (Arachis hypogaea
L.) using RFLP and RAPD markers. Genome 1995,
38(1):166-176.
67. Garcia GM, Stalker HT, Shroeder E, Kochert G: Identification of
RAPD, SCAR, and RFLP markers tightly linked to nematode
resistance genes introgressed from Arachis cardenasii into
Arachis hypogaea. 1996:836-845.
68. Simpson CE, Starr JL: Registration of 'COAN' Peanut. Crop Sci-
ence 2001, 41:918-918.
69. Simpson CE, Starr JL, Church GT, Burow MD, Paterson AH: Regis-
tration of 'NemaTAM' Peanut. Crop Science 2003, 43:1561-1561.
70. Zamir D: Improving plant breeding with exotic genetic librar-
ies. Nat Rev Genet 2001, 2(12):983-989.
71. Stalker : Utilizing Arachis cardenasii as a source of Cercospora
leafspot resistance for peanut improvement. Euphytica 1984,
33(2):529-538.
72. Sharma SB, Ansari MA, Varaprasad KS, Singh AK, Reddy LJ: Resist-
ance to Meloidogyne javanica in wild Arachis species. Genetic
Resources and Crop Evolution 1999, 46(6):557-568.
73. Reddy AS, Reddy LJ, Mallikarjuna N, Abdurahman MD, Reddy YV,
Bramel PJ, Reddy DV: Identification of resistance to Peanut bud
necrosis virus (PBNV) in wild Arachis germplasm. Annals of
Applied Biology 2000, 137:135-139.
74. Pande S, Rao JN: Resistance of wild Arachis species to late leaf
spot and rust in greenhouse trials. Plant Disease 2001,
85:851-855.
75. Nautiyal PC, Rajgopal K, Zala PV, Pujari DS, Basu M, Dhadhal BA,
Nandre BM: Evaluation of wild Arachis species for abiotic
stress tolerance: I. Thermal stress and leaf water relations.
Euphytica 2008, 159(1–2):43-57.