báo cáo khoa học: " Evaluation of protein pattern changes in roots and leaves of Zea mays plants in response to nitrate availability by two-dimensional gel electrophoresis analysis" pdf
Bạn đang xem bản rút gọn của tài liệu. Xem và tải ngay bản đầy đủ của tài liệu tại đây (1.48 MB, 17 trang )
BMC Plant Biology
BioMed Central
Open Access
Research article
Evaluation of protein pattern changes in roots and leaves of
Zea mays plants in response to nitrate availability by
two-dimensional gel electrophoresis analysis
Bhakti Prinsi1, Alfredo S Negri1, Paolo Pesaresi2, Maurizio Cocucci1 and
Luca Espen*1
Address: 1Dipartimento di Produzione Vegetale, University of Milan, via Celoria 2, I-20133 Milano, Italy and 2Dipartimento di Produzione
Vegetale, University of Milan c/o Fondazione Parco Tecnologico Padano, via Einstein – Località Cascina Codazza, I-26900 Lodi, Italy
Email: Bhakti Prinsi - ; Alfredo S Negri - ; Paolo Pesaresi - ;
Maurizio Cocucci - ; Luca Espen* -
* Corresponding author
Published: 23 August 2009
BMC Plant Biology 2009, 9:113
doi:10.1186/1471-2229-9-113
Received: 2 April 2009
Accepted: 23 August 2009
This article is available from: />© 2009 Prinsi et al; licensee BioMed Central Ltd.
This is an Open Access article distributed under the terms of the Creative Commons Attribution License ( />which permits unrestricted use, distribution, and reproduction in any medium, provided the original work is properly cited.
Abstract
Background: Nitrogen nutrition is one of the major factors that limit growth and production of crop plants. It
affects many processes, such as development, architecture, flowering, senescence and photosynthesis. Although
the improvement in technologies for protein study and the widening of gene sequences have made possible the
study of the plant proteomes, only limited information on proteome changes occurring in response to nitrogen
amount are available up to now. In this work, two-dimensional gel electrophoresis (2-DE) has been used to
investigate the protein changes induced by NO3- concentration in both roots and leaves of maize (Zea mays L.)
plants. Moreover, in order to better evaluate the proteomic results, some biochemical and physiological
parameters were measured.
Results: Through 2-DE analysis, 20 and 18 spots that significantly changed their amount at least two folds in
response to nitrate addition to the growth medium of starved maize plants were found in roots and leaves,
respectively. Most of these spots were identified by Liquid Chromatography Electrospray Ionization Tandem Mass
Spectrometry (LC-ESI-MS/MS). In roots, many of these changes were referred to enzymes involved in nitrate
assimilation and in metabolic pathways implicated in the balance of the energy and redox status of the cell, among
which the pentose phosphate pathway. In leaves, most of the characterized proteins were related to regulation
of photosynthesis. Moreover, the up-accumulation of lipoxygenase 10 indicated that the leaf response to a high
availability of nitrate may also involve a modification in lipid metabolism.
Finally, this proteomic approach suggested that the nutritional status of the plant may affect two different posttranslational modifications of phosphoenolpyruvate carboxylase (PEPCase) consisting in monoubiquitination and
phosphorylation in roots and leaves, respectively.
Conclusion: This work provides a first characterization of the proteome changes that occur in response to
nitrate availability in leaves and roots of maize plants. According to previous studies, the work confirms the
relationship between nitrogen and carbon metabolisms and it rises some intriguing questions, concerning the
possible role of NO and lipoxygenase 10 in roots and leaves, respectively. Although further studies will be
necessary, this proteomic analysis underlines the central role of post-translational events in modulating pivotal
enzymes, such as PEPCase.
Page 1 of 17
(page number not for citation purposes)
BMC Plant Biology 2009, 9:113
Background
Under field conditions, nitrogen nutrition is one of the
major factors that influence plant growth [1,2]. The availability of this nutrient affects many processes of the plant,
among which development, architecture, flowering,
senescence, photosynthesis and photosynthates allocation [1-7].
The low bio-availability of nitrogen in the pedosphere
with respect to the request of the crops has spawned a dramatic increase in fertilization that has detrimental consequences on environment such as water eutrophication
and increase in NH3 and N2O in the atmosphere [6,8].
Moreover, this side-effect is severe in the case of cereals,
which account for 70% of food production worldwide.
Indeed, in these crops the grain yield is strictly correlated
with N supply but the use efficiency is not higher than
50% [9].
Because of the economical relevance, the feasibility to
combine extensive physiological, agronomic and genetic
studies as well as the high metabolic efficiency of C4
plants, maize (Zea mays L.) was proposed as the model
species to study N nutrition in cereals [10].
Among nitrogen inorganic molecules, nitrate is the predominant form in agricultural soils, where it can reach
concentrations three or more orders of magnitude higher
than in natural soils [11,12].
In root cells, the uptake of this mineral nutrient involves
inducible and constitutive transport systems [13]. Both
systems mediate the transport of the anion by H+ symport
mechanisms [14-19] sustained by H+-ATPase [20-22].
The first step of nitrate assimilation, that occurs in both
roots and shoots, involves its reduction to ammonia by
nitrate reductase (NR) and nitrite reductase (NiR)
enzymes, followed by transfer of ammonia to α-chetoglutaric acid by the action of glutamine synthetase (GS) and
glutamate synthase (GOGAT) [23-25]. The pathway is
induced in the presence of nitrate and shows many connections with other cellular traits, among which carbohydrate and amino acid metabolism, redox status and pH
homeostasis [6,19,26,27]. Hence, nitrate and carbon
metabolisms appear strictly linked and co- regulated, both
locally and at long distance for the reciprocal root/leaf
control, in response to the nutritional status of the plant
and environmental stimuli [3,6,26-28].
In the last years, some transcriptomic analyses have been
conducted to shed light on the molecular basis of these
regulatory mechanisms. Wang and co-workers studied the
transcriptomic changes occurring after exposure to low
/>
and high nitrate concentrations in whole plants of Arabidopsis thaliana, by means of microarray and RNA gel blot
analysis [29]. Besides the genes already known to be regulated by the presence of nitrate, the authors found new
candidate genes encoding for regulatory proteins such as
a MYB transcription factor, a calcium antiporter, putative
protein kinases and several metabolic enzymes. Another
study conducted by Scheible and co-workers [7] reports a
comparative transcriptomic analysis of Arabidopsis thaliana seedlings grown in sterile liquid culture under nitrogen-limiting and nitrogen-replete conditions by using
Affymetrix ATH1 arrays and (RT)-PCR. The authors
observed that the response to nitrogen availability
involved a deep reprogramming of primary and secondary
metabolisms. These data well describe the complexity of
nitrogen pathway as well as the direct and/or indirect consequences that nitrogen availability exerts on the whole
metabolism of the plant.
Starting from these results it should be now desirable to
deepen the knowledge about the changes at translational
and post-translational levels in response to nitrogen availability. In the last decade, the improvement in technologies for protein study and the widening of gene sequences
made possible the study of the plant proteomes [30-34].
In this context, the availability of a large EST assembly and
the efforts in sequencing maize genome [35] contributed
to improve the use of maize, as highlighted by a large
number of studies conducted on this species, among
which the proteomic characterizations of leaf [36], of
chloroplasts in bundle sheath and mesophyll cells [37]
and of pericycle cells of primary roots [38].
At the present time, to the best of our knowledge no studies on nitrogen nutrition in maize were conducted by this
approach. The only two proteomic works regarding this
issue in cereals are based on the use of 2-DE to compare
the leaves [39] and the roots [40] of two wheat varieties
exposed to different levels of nitrogen. These works
pointed out some significant differences, correlated to N
availability during the plant growth, in the protein profiles of both organs.
In order to obtain further information, in this work we
investigated protein accumulation changes induced by
nitrate in both roots and leaves of Zea mays plants. The
attention was focused on the changes in the pattern of
protein soluble fractions caused by the addition of 10 mM
nitrate to the hydroponic solution, after a period in which
the plants were grown in the absence of nitrogen. Firstly,
the changes of some biochemical parameters were measured to describe the physiological response occurring after
nitrate addition and were used to define the sampling
time for proteomic analysis. These experiments led to
Page 2 of 17
(page number not for citation purposes)
BMC Plant Biology 2009, 9:113
compare the proteomes of plants previously grown for 17
days in absence of nitrogen and incubated for further 30
h without the nutrient or in the presence of 10 mM
nitrate. Through 2-DE and LC-ESI-MS/MS analyses a first
characterization of the proteome changes occurring in
maize plants in response to an increase in nitrate availability was obtained. The results show how many of these
changes were related to enzymes of the nitrate assimilation or metabolic pathways strictly linked to it (e.g. pentose phosphate pathway and photosynthesis), but also
reveal new proteins that may play a role in the nitrate
responses.
Results and discussion
Experimental design and biochemical parameters
The aim of this work was to apply a proteomic approach
to study the changes in protein patterns of root and leaf
organs of maize plants in the first phase of exposure to
high availability of nitrate, comparable to agricultural
conditions, after a growth period under nitrogen starvation. This is a typical condition in which the addition of
nitrate induces an increase in uptake and assimilation of
this nutrient [5,28].
The need for a simultaneous analysis of the root and the
leaf organs of starved plants, with completely developed
but not stressed leaf apparatus, led to the definition of the
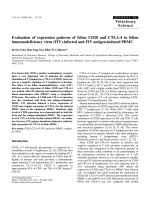
experimental design showed in Figure 1. Briefly, seedlings
were transferred into a hydroponic system after 3 days of
germination and grown for further 14 days in a solution
deprived of nitrogen. After that, at the beginning of the
light period (T0), some plants were maintained in the
same nutritional condition (control, C) whereas others
were transferred in a nutrient solution containing 10 mM
NO3- (N). In order to define the sampling time for pro-
Figure 1
Experimental design
Experimental design. Zea mays seeds were germinated in
the dark. After 3 days, the seedlings were transferred in a
hydroponic system and grown for 14 days in the absence of
nitrogen (T0), afterwards the plants were incubated for further 54 h in the same condition (Control, C) or in the presence of 10 mM KNO3 (N). For details see the methods
section.
/>
teomic analysis, the changes of biochemical parameters in
response to NO3- were firstly evaluated. Roots and leaves
were collected at T0 time and after 6, 30 and 54 h of nitrate
exposure.
At these sampling times, the plants achieved the developmental stage corresponding to the complete expansion of
the third leaf (pictures of harvested plants are showed in
Additional file 1). The qualitative comparison between
the C and N plants revealed some morphological differences. In particular, while the plants appeared very similar
at the T0 sampling time, after 30 h the expansion of the
fourth leaf was slightly more evident in N plants with
respect to the C ones. This trend was more pronounced at
54 h and, only in C plants, was accompanied by the comparison of faint yellow areas in the leaf blades. In the
tested conditions, no significant differences were
observed in root system.
In order to characterize the physiological status of the
plants, the changes in nitrate content and NR activity (Figure 2) as well as the levels of proteins, amino acids, reducing sugars, sucrose and chlorophyll were evaluated (Figure
3).
In roots and leaves of starved plants, both nitrate and NR
activity were undetectable. After the addition of the nutrient to hydroponic solution the levels of nitrate progressively increased in plant tissues, reaching a level of 32.6
and 10.3 μmol of NO3- g-1 FW after 54 h in roots and
leaves respectively (Figure 2A). A parallel dramatic
increase of NR activity was measured until the 30th h of
NO3- exposure, while at the longest time considered (54
h) a decreased activity was observed (Figure 2B). This
trend was more evident in the roots in which a more rapid
and large availability of nitrate took place. The total protein levels did not change significantly in all the conditions tested (Figure 3A and 3B), while a sharp increase in
free amino acids was detected in both organs after nitrate
addition (Figure 3C and 3D). Moreover, the levels of
amino acids were higher in the leaves than in the roots.
Although many factors are involved in the overall amino
acid levels, these results may suggest a contribution of
translocation of nitrogen compounds between the two
organs. Nitrate exposure also induced a decrease in reducing sugars in both organs (Figure 3E and Figure 3F), while
only in the roots of the plants exposed for 54 h to 10 mM
NO3- a drop of sucrose took place (Figure 3G).
Taken together, these results well describe the induction
trend of NO3- assimilation pathway, as suggested by the
increase of NR activity and amino acids accompanied by
the consequent decrease of reducing sugars, the main
source of carbon skeletons [41]. In roots, where photosynthesis cannot satisfy this request and/or the demand of
Page 3 of 17
(page number not for citation purposes)
BMC Plant Biology 2009, 9:113
/>
suggested that this feedback mechanism was activated in
roots of the plants exposed for 54 h to 10 mM NO3-.
Finally, only at the 54th h, a significant decrease in chlorophyll content (Figure 3I) was measured in the leaves of
starved plants, thus suggesting that the first symptoms of
stress were appearing.
2-DE analysis and protein identification
The biochemical and physiological data showed that the
plants incubated for the last 30 h in the presence of 10
mM NO3- were in a condition in which nitrogen metabolism is completely activated in both root and leaf organs
and that, at the same time, no stress symptoms were
detectable in the control plants. Starting from these
results, the proteomic study was conducted by analyzing
the soluble protein fractions extracted from roots and
leaves of plants incubated for the last 30 h in the absence
or in the presence of 10 mM NO3-.
The ratio between dry and fresh weight as well as the total
protein content appeared similar both in the roots and in
the leaves of C and N samples (Table 1). The adopted protocol permitted to obtain an extraction yield of soluble
proteins of about 14% and 20% for roots and leaves,
respectively. Moreover, no significant differences were
observed between C and N plants.
Figure 2
Nitrate content and nitrate reductase activity
Nitrate content and nitrate reductase activity. Time
course of the changes in nitrate content (A) and nitrate
reductase activity (B) in roots (close circles and closed
squares) and leaves (open triangle and open rhombuses) of
Zea mays plants, previously grown for 17 days under nitrogen
starvation (T0) and incubated for further 6, 30 and 54 h in the
absence (closed squares and open rhombuses) or in the
presence (closed circles and open triangles) of 10 mM NO3-.
In roots and leaves of starved plants, both nitrate and NR
activity were undetectable. Values are the mean ± SE of
three independent biological samples analyzed in triplicate (n
= 9).
carbon skeleton is high, sucrose pool was also affected.
The changes in carbohydrate availability and the increase
of amino acid levels also explain the decrease in NR activity observed in roots at the 54th h. In fact, these data are in
agreement with the inhibitory effect on NR evocated by an
increase of some amino acids, mainly asparagine and
glutamine [5,42]. Moreover, it is know that NR activity
increases after sucrose addition whilst the low sugar content, condition that we observed in the roots of N plants,
affects the nitrate reduction system [5,42,43]. The results
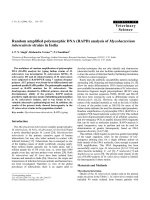
The 2-DE representative gels of the soluble fractions of
root and leaf samples are shown in Figure 4. The electrophoretic analyses detected about 1100 and 1300 spots in
roots and leaves gels, respectively. To ascertain the quantitative changes in the proteomic maps, the relative spot
volumes (%Vol) were evaluated by software-assisted analysis. The Student's t-test (p < 0.05), coupled with a threshold of two-fold change in the amount, revealed that 20
spots in roots and 18 spots in leaves were affected by
nitrogen availability.
The analysis of these spots by LC-ESI-MS/MS allowed to
identify 15 and 14 proteins in root and leaf patterns,
respectively. These proteins and the changes in their accumulation are shown in Tables 2 and 3, while further information of mass spectrometry (MS) analysis are reported
in the Additional files 2 and 3.
Functional role and quantitative change of the proteins
identified in roots
Many of the spots identified in roots were enzymes
involved in nitrogen and carbon metabolisms (Table 2).
According to the induction of the NO3- assimilation pathway, in the roots of the plants incubated for the last 30 h
in the presence of the nutrient, we observed an increase in
the accumulation of nitrite reductase (spot 268, NiR) and
of glutamine synthetase plastidial isoform (spot 483,
GS2).
Page 4 of 17
(page number not for citation purposes)
BMC Plant Biology 2009, 9:113
/>
Figure 3
Total proteins, amino acids, reducing sugars, sucrose and chlorophyll content
Total proteins, amino acids, reducing sugars, sucrose and chlorophyll content. Time course of the changes in the
content of total proteins, amino acids, reducing sugars and sucrose in roots (A, C, E and G) and leaves (B, D, F, and H) and
chlorophyll content in leaves (I) of Zea mays plants, previously grown in the absence of nitrogen for 17 days (T0) and incubated
for further 6, 30 and 54 h in the absence (C) or presence of 10 mM NO3- (N). Values are the mean ± SE of three independent
biological samples analyzed in triplicate (n = 9). Samples indicated with the same letters do not differ significantly according to
Tukey's test (p < 0.01).
Page 5 of 17
(page number not for citation purposes)
BMC Plant Biology 2009, 9:113
/>
Table 1: Evaluation of the procedure for the extraction of soluble proteins from roots and leaves of plants grown in the two conditions
compared in the proteomic analysis.
Organ
Condition
FW/DW
Total proteins (mg g-1FW)
Extraction yield of soluble proteins (%)
Root
C plants
N plants
8.63 ± 0.05
8.43 ± 0.34
5.32 ± 0.34
6.04 ± 0.41
13.39 ± 0.72
14.63 ± 0.69
Leaf
C plants
N plants
8.45 ± 0.09
8.64 ± 0.15
9.39 ± 0.45
9.35 ± 0.43
19.17 ± 0.99
20.96 ± 0.43
In the table, the fresh/dry weight (FW/DW), the content of total protein (mg g -1FW) and the % yield of the extraction of soluble proteins (% of
extracted soluble proteins respect to the total content) for the roots and the leaves of the plants compared by proteomic analysis are reported.
The fresh weight of the roots was 0.56 ± 0.03 and 0.60 ± 0.04 g in C and N plants, respectively. The fresh weight of the leaves was 0.79 ± 0.03 and
0.86 ± 0.04 g in C and N plants, respectively.
C plants: plants kept in the absence of nitrogen; N plants: plants grown for the last 30 h in the presence of 10 mM NO3-. Values are the mean ± SE
of three independent biological samples analyzed in triplicate (n = 9).
Moreover, in response to the demand of carbon skeletons
and NADPH, which is used in non-green tissues for ferredoxin reduction [44], an increase in the levels of phosphoglycerate mutase (spot 216, PGAM-1), glucose-6phosphate dehydrogenase (spot 1162, G6PD) and 6phospho-gluconate dehydrogenase (spot 392, 6PGD)
took place. These results well agree with previous array
data that describe the responses to nitrate exposure in Arabidopsis and tomato [7,29,45].
An increase in accumulation of the cytosolic isoform of
glutamine synthetase (spot 538, GS1-1) was also detected
in roots of N plants. On the basis of identified peptides by
MS analysis it was possible to discriminate among the 5
GS1 isoforms known in Zea mays (SwissProt reviewed
database) and to restrict the possible identification to 2 of
them (GS1-1 [Swiss-Prot:P38559] and GS1-5 [SwissProt:P38563] [46]). The fact that Li and co-workers [46],
through a Northern blot hybridization analysis, found
that the transcript of GS1-1 gene was the only one
expressed in roots, conducted to the specific identification
of GS1-1 protein. Moreover, Sakakibara and co-workers
[47] showed that GS1-1 transcript was the only induced
by NO3-. The proteomic approach used in the present
work allows to confirm these results at the translational
level, demonstrating that in maize roots a cytosolic
ammonia assimilation pathway can be activated also in
response to nitrate.
Figure 4
2-DE maps
2-DE maps. Representative 2-DE maps of soluble protein fractions extracted from roots (A) and leaves (B) of Zea mays
plants. Proteins (400 μg) were analyzed by IEF at pH 3–10, followed by 12.5% SDS-PAGE and visualized by cCBB-staining.
Name abbreviations, corresponding to those in Tables 2 and 3, indicate the spots, identified by LC-ESI-MS/MS, showing significant changes of at least two-fold in their relative volumes (t-test, p < 0.05) after the exposure to 10 mM nitrate for 30 h. Proteins that increased or decreased after this treatment are reported in blue or in red, respectively.
Page 6 of 17
(page number not for citation purposes)
BMC Plant Biology 2009, 9:113
/>
Table 2: List of the spots identified in the roots and their change in abundance after the exposure to 10 mM nitrate for 30 h.
Spot ID Accession number
Protein description
Abbr.a
Glycolysis, gluconeogenesis, C-compound and carbohydrate metabolism
Phosphoenolpyruvate carboxylase
PEPCase-UB
53
BAA28170
Ubiquitin
P69319
2,3-bisphosphoglycerate-independent
PGAM-I
216
P30792
phosphoglycerate mutase
Pyruvate decarboxylase
PDC
231
AAL99745
6-phosphogluconate dehydrogenased
6PGD
392
EAZ18378
Glucose-6-phosphate 1G6PD
1162
NP_196815
dehydrogenase
Nitrogen metabolism, amino acid metabolism and protein/peptide degradation
Ferredoxin-nitrite reductase
NiR
268
ACG29734
Glutamine synthetase, chloroplastic
GS2
483
P25462
Glutamine synthetase root isozyme 1
GS1-1
538
P38559
Aspartic protease
AP
707
BAA06876
Secondary metabolism
Phenylalanine ammonia-lyase
PAL-a
171
AAL40137
Phenylalanine ammonia-lyase
PAL-b
172
AAL40137
Phenylalanine ammonia-lyase
PAL-c
1160
AAL40137
Cell rescue, defense and virulence
Putative monodehydroascorbate
MDHAR
390
NP_001061002
reductase d
hemoglobin 2
Hb2
960
AAZ98790
Unknown
14-3-3-like protein GF14-12
GF14-12
774
Q01526
Mrb/pIb
Mrc/pIc
Change in level
[Relative volume (%)]
Control
10 mM NO3
115.4/5.7 109.4/5.7 0.223 ± 0.022 0.084 ± 0.032
8.5/6.6
63.0/5.1
60.6/5.3 0.124 ± 0.086 0.245 ± 0.011
62.4/5.5
50.1/6.1
60.3/6.7
65.0/5.7
50.1/5.5
67.2/8.5
0.080 ± 0.043 0.167 ± 0.024
0.080 ± 0.031 0.275 ± 0.033
0.002 ± 0.001 0.010 ± 0.014
59.7/6.7
42.2/5.2
38.7/5.1
31.6/4.6
66.2/6.5
41.0/5.4e
39.2/5.6
54.1/5.1
0.035 ± 0.054
0.066 ± 0.015
0.210 ± 0.010
0.051 ± 0.043
68.6/5.9
68.6/5.8
68.0/5.8
74.9/6.5
74.9/6.5
74.9/6.5
0.476 ± 0.034 0.184 ± 0.012
0.904 ± 0.136 0.277 ± 0.026
0.713 ± 0.103 0.275 ± 0.034
50.1/6.2
52.8/6.8
0.127 ± 0.016 0.275 ± 0.033
24.8/4.9
20.6/5.0
0.018 ± 0.061 0.099 ± 0.068
29.6/4.6
29.6/4.7
0.345 ± 0.034 0.146 ± 0.028
0.124 ± 0.084
0.137 ± 0.059
0.480 ± 0.039
0.015 ± 0.065
Statistical information about LC-ESI-MS/MS analysis are reported in Additional files 2 and 3. Changes in the relative spot volumes are the mean ± SE
of six 2-DE gels derived from three independent biological samples analyzed in duplicate (n = 6). Proteins were classified according to MIPS funcat
categories.
a: Protein abbreviation
b: Experimental molecular weight (kDa) or isoelectric point
c: Theoretical molecular weight (kDa) or isoelectric point
d: Information obtained by alignment of the sequence through BLAST analysis against NCBI nr database
e: Values referred to the mature form of the protein
Other spots that were found to increase their relative volumes in response to nitrate were a non-symbiotic hemoglobin and a monodehydroascorbate reductase (spot
960, Hb2 and spot 390, MDHAR). In a previous work on
Arabidopsis, it was found that NO3- induced AtHB1 and
AtHB2, two genes that encode for non-symbiotic hemoglobins [7,29]. Scheible and co-workers [7] suggested
that these proteins could change their abundance in relation to the redox status, whereas Wang and co-workers
[29] speculated on the possibility that the induction of
hemoglobin could aim at reducing oxygen concentration
during NR synthesis, since molybdenium can be sensitive to oxygen. Besides, hemoglobin and MDHAR are
known to be involved in the scavenging of NO that can
be produced by cytosolic and/or plasmamembrane
nitrate reductase when nitrite is used as substrate
[48,49]. NO is a signaling molecule which is involved in
many biochemical and physiological processes [50]. It
has been reported that in plant roots, NO plays a role in
growth, development and in some responses to environmental conditions, such as hypoxia [51]. Recently, a pos-
sible involvement of NO in the mediation of nitratedependent root growth in maize has been suggested
[52]. According to this work, that describes a reduction
of endogenous NO at high external NO3- concentration,
the observed concomitant up-accumulation of Hb2 and
MDHAR in our experimental condition supports the
hypothesis that they might contribute in controlling NO
levels in root tissues after exposure to NO3- [48,49,52].
The last protein found to be present in higher amount in
N plants was a pyruvate decarboxylase (spot 231, PDC).
This enzyme catalyzes the decarboxylation of pyruvic acid
into acetaldehyde, the first step of the alcoholic fermentation. In particular, we identified the PDC isoenzyme 3
that has been previously found to be induced in hypoxia
condition [53]. Although further studies are required to
understand why PDC is induced by NO3-, we can observe
that fermentation pathways are induced in response to
redox status changes and that this condition could be also
linked to the activation of the Hb/NO cycle (see above)
[49,54].
Page 7 of 17
(page number not for citation purposes)
BMC Plant Biology 2009, 9:113
/>
Table 3: List of the spots identified in the leaves and their change in abundance after the exposure to 10 mM nitrate for 30 h.
Spot ID Accession number
Abbr.a
Protein description
Nitrogen and amino acid metabolism
TaWIN2
1094
BAB11740
Methionine synthase protein
254
AAL73979
C-compound and carbohydrate metabolism
Putative cytosolic 6-phosphogluconate
650
AAC27703
dehydrogenase
Photosynthesis
Phosphoenolpyruvate carboxylase 1
134
P04711
Phosphoenolpyruvate carboxylase 1
138
P04711
ATP synthase subunit alpha, chloroplastic
500
P05022
Putative triosephosphate isomerase,
1065
NP_001063777
chloroplast precursor d
Oxygen-evolving enhancer protein 2,
1244
Q00434
chloroplast precursor
23 kDa polypeptide of photosystem II
1612
BAA08564
Protein folding and stabilization
RuBisCO subunit binding-protein beta
462
NP_001056601
subunit d
Putative rubisco subunit binding-protein
467
AAP44754
alpha subunit precursor
Metabolism of vitamins, cofactors, and prosthetic groups
Thiazole biosynthetic enzyme 1-1,
999
Q41738
chloroplast precursor
Secondary metabolism
Phenylalanine ammonia-lyase
313
AAL40137
Lipid metabolism
Lipoxygenase
219
ABC59693
Mrb/pIb
Mrc/pIc
Change in level
[Relative volume (%)]
Control
10 mM NO3
TaWIN2
MetS
29.9/4.7
83.4/5.9
28.7/4.8
83.8/5.9
0.182 ± 0.009 0.090 ± 0.014
0.148 ± 0.020 0.073 ± 0.008
6PGD
47.4/6.0
52.9/6.2
0.088 ± 0.005 0.043 ± 0.007
PEPCase-a 104.4/5.8 109.3/5.8 0.990 ± 0.083
PEPCase-b 104.4/5.7 109.3/5.8 2.220 ± 0.278
ATPsyn α 55.9/6.1
55.7/5.9 0.042 ± 0.007
TIM
31.0/4.9
32.4/7.0 0.028 ± 0.009
2.770 ± 0.295
1.090 ± 0.205
0.015 ± 0.003
0.088 ± 0.014
OEE2
26.6/6.5
27.3/8.8
0.201 ± 0.013 0.090 ± 0.011
23pPSII
26.3/6.5
27.0/9.5
0.147 ± 0.008 0.055 ± 0.006
CPN-60 β
58.5/5.1
64.1/5.6
0.079 ± 0.014 0.164 ± 0.015
CPN-60 α
58.2/4.8
61.4/5.4
0.046 ± 0.004 0.096 ± 0.004
TH1-1
33.0/5.1
32.8/4.9e
0.010 ± 0.001 0.048 ± 0.003
PAL
70.2/6.0
74.9/6.5
0.076 ± 0.008 0.023 ± 0.002
LOX
94.6/5.8
102.1/6.1 0.023 ± 0.011 0.149 ± 0.011
Statistical information about LC-ESI-MS/MS analysis are reported in Additional files 2 and 3. Changes in the relative spot volumes are the mean ± SE
of six 2-DE gels derived from three independent biological samples analyzed in duplicate (n = 6). Proteins were classified according to MIPS funcat
categories.
a: Protein abbreviation
b: Experimental molecular weight (kDa) or isoelectric point
c: Theoretical molecular weight (kDa) or isoelectric point
d: Information obtained by alignment of the sequence through BLAST analysis against NCBI nr database
e: Values referred to the mature form of the protein
Among the spots identified in roots, six showed a downaccumulation in N plants (Table 2). Three of them were
identified as phenylalanine ammonia-lyase (spots 171,
172 and 1160, PAL-a, PAL-b and PAL-c). The MS analysis
indicated for all three spots the same protein [GenBank:AAL40137] while the electrophoretic data showed
some differences in Mr and pI, suggesting that post-translational modification events may have occurred. It has
been shown as low nitrogen availability induces transcripts encoding enzymes of phenylpropanoid and flavonoid metabolism, such as PAL, chalcone synthase and 4coumarate:coenzyme A ligase, whilst after nitrogen repletion these activities are down-regulated [7,55]. Our proteomic data appear to be in agreement with these studies.
Previously, it was found that under low nitrogen availability four proteases (e.g. serine, aspartate/metalloproteases
and two cysteine proteases) increased their activity to
degrade non-essential proteins in order to remobilize this
nutrient [56]. In this work, we found an aspartic protease
belonging to the A1 family (spot 707, AP) that was downregulated after NO3- exposure. Moreover, the experimental Mr appeared lower with respect to that expected for this
protein, thus suggesting that this spot is referable to the
active form of the enzyme [57]. These data support a new
possible role for A1 protease family [57,58].
Phosphoenolpyruvate carboxylase activity is known to
increase during nitrate assimilation, having a role in cell
pH homeostasis and an anaplerotic function [14,19,5961]. In addition, the monoubiquitination of this enzyme
was recently well described in germinating castor oil seeds
by Uhrig and co-workers [62]. It was found that this event
is non-destructive and that this reversible post-translational modification of the enzyme reduces its affinity for
PEP and its sensitivity to allosteric activators and inhibi-
Page 8 of 17
(page number not for citation purposes)
BMC Plant Biology 2009, 9:113
/>
tors. The MS analysis of spot 53 (for sequence details see
Additional file 4) identified 8 peptides, 7 of which
matched with a PEPCase [DDBJ:BAA28170] (theoretical
Mr/pI equal to 109.4/5.7), while the last peptide belonged
to an ubiquitin (UB) [Swiss-Prot:P69319] (theoretical Mr/
pI equal to 8.5/6.6). The experimental Mr and pI of spot
53, that were 115.4 and 5.7 respectively, were in agreement with the monoubiquitination of the PEPCase (PEPCase-UB, theoretical Mr/pI equal to 117.9/5.8
respectively). Moreover, the domain responsible to bind
ubiquitin previously identified in PEPCase of other vascular plants is present in this maize PEPCase [62]. These
results suggest that in maize roots the modulation of PEPCase activity in response to nitrogen availability could
occur also through reversible monoubiquitination.
reducing power could be satisfied by the increase in photosynthetic activity [69].
The last spot identified in roots that was down-regulated
by NO3- was the 14-3-3-like protein GF14-12 (spot 774,
GF14-12). Previously, it was found that this protein is
localized in the nucleus where it binds the DNA at the Gbox regions in association with transcription factors and
that it is involved in the regulation of gene expression
[63,64]. More recently, it was described an interaction of
14-3-3 proteins with some transcription factors such as
VP1, EmBP1, TBP and TFIIB [65]. Further studies are
required to clarify the effective role of GF14-12, for which
the functional information are still lacking.
Thiamine (i.e. vitamin B1) is required in many pathways,
such as the Calvin cycle, the branched-chain amino acid
pathway and pigment biosynthesis [71]. Along with
higher request of this vitamin in leaves of N plants, where
the activation of these pathways could take place, we identified, among the spots up-regulated by N, the thiazole
biosynthetic enzyme (spot 999, TH1-1) that is known to
be involved in thiamine biosynthesis [71].
Functional role and quantitative change of the proteins
identified in leaves
Many of the spots identified in leaves by LC-ESI-MS/MS
analysis were proteins linked to the NO3- assimilation as
well as to the photosynthetic activity (Table 3).
The activity of NR can be modulated also at post-translational level through a phosphorylation event followed by
binding of inhibitory 14-3-3 protein [66,67]. One of the
spots analyzed in the leaves was identified as TaWIN2
(Table 3, spot 1094, TaWIN2), that was previously
described to be involved in the NR inactivation [67]. We
found that the level of this protein decreased in leaves of
N plants, where NR activity was induced (Table 3).
According to the well known relationships existing
between nitrogen and carbon metabolism, the changes in
accumulation of some spots after NO3- addition are consistent with an increase of photosynthesis rate. Two spots
that raise after NO3- addition were identified as CPN-60α
and CPN-60β (spot 467 and 462, CPN-60α and CPN-60β,
respectively), that are chaperonin proteins involved in
folding of ribulose-1,5-bisphosphate carboxylase [68].
Moreover, a chloroplastic triosephosphate isomerase was
up-regulated by NO3- (spot 1065, TIM), while a cytosolic
6-phosphogluconate dehydrogenase (spot 650, 6PGD)
was down-regulated, as expected when the request of
Spot 500 was identified as the α subunit of the chloroplastic ATP synthase (ATPsyn α), but unexpectedly it was
more abundant in leaves of C plants. Although only a
speculative interpretation of this result can be made, we
could hypothesize that in leaves of the N plants ATP synthase should be activated and this process requires the
reconstitution of the enzymatic complex in the thylakoid
membranes [70]. Hence, to clarify this point, it should be
necessary to investigate if the decrease of ATPsyn α
observed in the soluble fraction of N plants is effectively
accompanied by an increase of this protein in the membrane fraction.
Two spots were identified as PEPCase (spot 134 and 138,
PEPCase-a and PEPCase-b respectively). In C4 plants such
as maize, this enzyme plays a central role in photosynthesis, because it catalyses the primary fixation of atmospheric CO2 [72]. The catalytic activity and sensitivity of
this enzyme are mediated by a reversible phosphorylation
[73]. The experimental pIs of the spots 134 and 138 were
5.8 and 5.7, respectively. Moreover, these two PEPCase
forms showed opposite changes in abundance in the
leaves of plants grown in the last 30 h in the presence of
NO3- with respect to the controls. The results obtained in
our work suggest that the two spots of PEPCase are referable to the phosphorylated (spot 138) and to the unphosphorylated (spot 134) form with a predicted pI of 5.7 and
5.8, respectively, that are known to correspond to the
more and less active states of this enzyme [74]. Interestingly, despite the fact that data suggest an increase in the
photosynthetic activity, the phosphorylated form was
more abundant in the proteomic map of C plants. These
results support the immunological observation by Ueno
and co-workers [73] that the diurnal regulation of phosphorylation state of PEPCase appears delayed in nitrogenlimited conditions, suggesting that the circadian control
of PEPcase is affected by nitrogen starvation.
Two of the spots down-regulated in leaves of N plants
were a phenylalanine ammonia-lyase (spot 313, PAL) and
a methionine synthase (spot 254, MetS). The decrease of
PAL, observed also in root tissue (see above), is a further
evidence that phenylpropanoid and flavonoid metabo-
Page 9 of 17
(page number not for citation purposes)
BMC Plant Biology 2009, 9:113
lisms are affected by nitrogen availability [7,55]. On the
other hand, the change in accumulation of MetS is contrasting with a recent proteomic study performed on
wheat by Bahrman and co-workers [39]. These authors
found that the induction of this enzyme was positively
related to nitrogen availability. This discrepancy could be
associated to different genetic traits of the two species, as
well as it could be linked to different experimental
approaches adopted in the two studies. Nevertheless, it
should be observed that in both these works a single spot
referable to MetS was detected, while further information
on total level and/or on activity of this enzyme is necessary to clarify this point.
The spot 219, which considerably increased in N plants,
was a lipoxygenase (LOX). In particular, the analysis of
the MS spectra identified the LOX codified by ZmLOX10
gene, which was found to be a plastidic type 2 linoleate 13LOX [75]. The expression analysis of this gene revealed
that its transcript was abundant in leaves and was regulated by a circadian rhythm with a trend strictly linked to
the photosynthetic activity. Moreover, it has been proposed that ZmLOX10 is involved in the hydroperoxide
lyase-mediated production of C6-aldehydes and alcohols
and not in the biosynthesis of JA [75]. Although some evidences suggest a role of ZmLOX10 in the responses to
(a)biotic stresses, its involvement in the diurnal lipid
metabolism was also proposed [75,76].
At the same time, we identified two proteins as an oxygenevolving enhancer protein 2 (spot 1244, OEE2) and a 23
kDa polypeptide of photosystem II (spot 1612, 23pPSII),
which were down-accumulated in leaves of N plants
(Table 3). Both have been classified as members of PsbP
family that is one of the three extrinsic protein families
composing the oxygen-evolving complex (OEC) of photosystem II in higher plants [77-79]. In addition, it was
recently demonstrated that PsbP proteins are essential for
the normal function of PSII and play a crucial role in stabilizing the Mn cluster in vivo [80]. Moreover, the stability
of this class of protein seems related to the lipid composition of chloroplastic membranes that is also affected by
nitrogen availability [81,82].
In order to elucidate the physiological meaning of these
variations and to verify if they could be related to a stress
status or to an alteration in photosynthetic performance,
changes of both maximum quantum yield of photosystem II (FV/FM; dark adapted plants) and effective quantum
yield of photosystem II (ΦII; light adapted plants), dry
weight and MDA levels of shoot were measured (Figure
5). Although the FV/FM parameter, measured on overnight dark adapted plants at time points 0, 24 and 48
hours, resulted in very similar values between C and N
plants (about 0.80; see also Figure 5A), the ΦII values
/>
showed a very slight decrease in C plants during the second period of illumination (C plants ΦII, 0.71 versus N
plants, 0.73) and the difference became more marked
between 48 and 54 hours of nitrogen starvation. Similar
data could be obtained by monitoring biomass production at the different time points (Figure 5B), indicating
that photosynthetic performances are highly impaired in
C plants after 48–54 hours of treatment. Nevertheless, no
changes in MDA were detected in all the conditions tested
(Figure 5C).
Taken together these results indicate that at the 30th h, the
time point chosen for proteomic analysis, plants start feeling the different nitrogen content in the growth media
without developing major stress symptoms and the associated pleiotropic effects.
These data sustain the hypothesis that ZmLOX10 could be
involved in lipid metabolism of the chloroplast that is
strictly depending on photosynthetic activity [75,76]. Further analyses are needed to unravel this possible intriguing role of ZmLOX10.
Considering the PsbP proteins, the change in accumulation of OEE2 and 23pPSII could indicate that OEC stability is affected by the N availability. Through time-course
experiments, it will be possible to better correlate the relationship among N nutritional status, lipid metabolism,
PsbP protein levels and PSII functionality.
Conclusion
Many of the proteins found to change in accumulation in
response to NO3- were directly involved in the assimilation of this mineral nutrient. Moreover, the results underline the strict relationship between nitrogen and carbon
metabolisms. The experimental design chosen for this
proteomic study allows to emphasize some intriguing
metabolic activities in both organs. Besides a dramatic
increase of NO3- assimilation pathway, the exposure to a
high NO3- concentration after a starvation period seems to
induce a modification in NO metabolism in roots, that
could depend on the need of responding to the new nutritional status. In leaves, many proteins were found to be
(in)directly involved in the photosynthesis reactivation
and in the maintenance of the chloroplastic functionality.
In addition, this proteomic analysis confirms the modulation by phosphorylation of the PEPCase in the leaves, suggesting that nitrogen availability could affect the circadian
rhythms, as well as it shows that the form of this enzyme
operating in roots could be modulated by monoubiquitination. Although further efforts are required to elucidate
these results, the present study underlines the central role
of post-translational events to modulate pivotal enzymes
in plant metabolic response to NO3-.
Page 10 of 17
(page number not for citation purposes)
BMC Plant Biology 2009, 9:113
/>
FV/FM, Φ5, dry weight and MDA in leaves
Figure II
FV/FM, ΦII, dry weight and MDA in leaves. Time course of the changes in FV/FM and ΦII (A), dry weight in leaves (B) and
MDA levels (C) of Zea mays plants, previously grown for 17 days under nitrogen starvation (T0) and incubated for further 6, 30
and 54 h in the absence or presence of 10 mM NO3-. Symbol in Figure A: open squares, Control; closed squares, 10 mM NO3; horizontal bar: white bars, light periods; black bars, dark periods (for details see Figure 1). Values are the mean ± SE of three
independent biological samples analyzed in triplicate (n = 9). Samples indicated with the same letters do not differ significantly
according to Tukey's test (p < 0.01).
Page 11 of 17
(page number not for citation purposes)
BMC Plant Biology 2009, 9:113
Methods
Plant material and growth conditions
Maize (Zea mays L.) seeds of T250 inbred line, kindly provided by Prof. Zeno Varanini of Udine University – Italy,
were germinated in the dark at 26°C on blotting paper
saturated with deionized water. After 72 h, seedlings were
transferred to a hydroponic system placed in a growth
chamber with a day/night regime of 16/8 h and a PPFD of
200 μmol m-2 s-1 at plant level, with a temperature of 22°C
in the dark and 26°C in the light and with a relative
humidity of 70%. Seedlings were grown using of the following solutions: (i) 4 mM CaSO4 for the first 48 h; (ii)
0.4 mM CaSO4, 0.2 mM K2SO4, 0.175 mM KH2PO4, 0.1
mM MgSO4, 5 μM KCl, 20 μM Fe-EDTA, 2.5 μM H3BO3,
0.2 μM MnSO4, 0.05 μM CuSO4, 0.2 μM ZnSO4, 0.05 μM
Na2MoO4 (growing solution) for the following 12 days.
After this 17 days-long period of N starvation (T0), plants
were transferred in a fresh growing solution added (N) or
not (C) with 10 mM KNO3. The pH of all the growth solutions was adjusted to 6.1 and the solutions were changed
every three days. All hydroponic solutions were continuously aerated by an electric pump.
At T0 stage and after a period of 6, 30 and 54 h plants were
harvested, washed with distilled water and then blotted
with paper towels. Finally, roots and leaves were separated
and the samples were frozen in liquid N2 and stored at 80°C. The roots used for determining nitrate content were
rinsed twice in ice-cold 0.4 mM CaSO4 solution for 15
min for removing the anion present in the apoplast before
sampling.
Levels of nitrate
Nitrate was extracted from the tissues by homogenizing
the samples previously boiled in 4 volumes of distilled
water for 15 min. The homogenate was centrifuged at
12,000 g for 20 min to obtain a clarified supernatant.
Nitrate content was measured by adding 0.8 ml of 5% (w/
v) salicylic acid in concentrated sulfuric acid solution to
0.2 ml of the supernatant. The mixture was stirred vigorously and allowed to react over 20 min, afterwards 19 ml
of 2 N NaOH were slowly added and the resulting colour
was read at 410 nm [83].
Nitrate reductase activity
NR was extracted by using 4 volumes of ice-cold 50 mM
pH 7.8 MOPS-KOH buffer containing 5 mM EDTA, 5 mM
NaF, 2 mM MSH, 1 mM PMSF, 10 μM FAD, 1 μM leupeptin and 10 μM chymostatin. The homogenates were centrifuged at 13,000 g for 15 min at 4°C. NR activity was
measured as described by Ferrario-Méry et al. [84] using a
reaction mixture consisting of 50 mM pH 7.5 MOPS-KOH
buffer, 1 mM NaF, 10 mM KNO3, 0.17 mM NADH, 10
mM MgCl2 and 5 mM EDTA. The reaction was blocked
/>
after 10 or 20 min by adding an equal volume of sulphanilamide (1%, w/v in 3 M HCl) followed by n-naphtylethylethylenediamine dihydrochloride (0.02%, w/v). 30 min
later, the concentration of NO2- was determined spectrophotometrically at 540 nm. The protein concentration
was determined by 2-D Quant Kit (GE Healthcare).
Determination of reducing sugars, sucrose, amino acids,
total proteins and chlorophyll
Reducing sugars, sucrose and amino acids were extracted
by homogenizing frozen tissues in 4 volumes of ice-cold
0.5 M perchloric acid (PCA). The homogenate was centrifuged for 10 min at 13,000 g at 4°C and the resulting pellet was washed with the same volume of PCA and then
centrifuged again in the same conditions. KOH was added
to the collected supernatant (to pH 7.6) to remove excess
PCA. Reducing sugars were measured according to the
colorimetric method by Nelson [85]. Total soluble sugars
were determined by the same method boiling an aliquot
of PCA extract for 1 h before neutralization. Sucrose was
estimated from the difference between total soluble and
reducing sugars. Total amino acids were measured by the
ninhydrin method [86].
Total proteins were extracted as previously described by
Martínez and co-workers [87] by homogenizing the samples, previously powdered in liquid nitrogen, in 4 volumes of a 125 mM pH 8.8 Tris-HCl buffer containing 1%
(w/v) SDS, 10% (w/v) glycerol, 50 mM Na2S2O5. The
homogenate was centrifuged at 13,000 g for 20 min to
obtain a clarified supernatant. The protein content was
measured by using 2-D Quant Kit (GE Healthcare).
Chlorophyll was extracted by homogenizing the leaves,
previously powdered in liquid nitrogen, in 4 volumes of
80% pre-cooled acetone (v/v). The homogenate was centrifuged at 13,000 g for 20 min at 4°C to obtain a clarified
supernatant. Chlorophyll concentration was measured
according to Lichtenthaler [88].
Determination of malondialdehyde and chlorophyll
fluorescence of the leaves
Malondialdehyde (MDA) was assayed by the method of
Heath & Packer [89]. Frozen samples were homogenized
with 4 volumes of ice-cold 0.1% (w/v) trichloroacetic acid
(TCA) and centrifuged at 13,000 g for 20 min at 4°C. An
equal volume of 20% (w/v) TCA plus 0.5% (w/v) thiobarbituric acid was added to the supernatants, which were
subsequently heated at 95°C for 30 min. The extracts were
then clarified by centrifugation at 13,000 g for 10 min,
and the difference between the absorbance at 532 and 600
nm was measured. The MDA equivalent was calculated
from the resulting difference using the extinction coefficient of 155 mM-1 cm-1.
Page 12 of 17
(page number not for citation purposes)
BMC Plant Biology 2009, 9:113
In order to determine the photosynthetic performance,
the chlorophyll fluorescence was measured by using a
portable continuous-excitation type fluorometer (HandyPEA, Hansatech Instrument). The maximum quantum
efficiency of photosystem II (FV/FM) was calculated on
over-night dark adapted plants, according to the equation
(FM-F0)/FM, where F0 and FM are the fluorescence levels
when plastoquinone electron acceptor pool (Qa) is fully
oxidized and transiently fully reduced, respectively [90].
The photosynthetic performance of light adapted plants
was evaluated by monitoring the effective quantum yield
of photosystem II (ΦII) defined as (FM'-F0')/FM' [91],
where FM'and F0' represent the maximal and minimal fluorescence emission of photosystem II under light conditions.
Statistical analyses of biochemical and physiological
measurements
For all the biochemical and physiological measurements,
the experimental design consisted in three independent
biological samples each analyzed in triplicate (n = 9).
One-way analysis of variance (ANOVA) followed by the
post hoc Tukey test (p < 0.01) was used to verify the significance of the variations measured among all the tested
parameters. This statistical analysis was performed using
the software STATISTICA 7.
Extraction of protein samples for 2-DE analysis
Three independent biological replicates were extracted for
each condition. Frozen samples, each composed by leaves
or roots of 6 plants, were finely powdered in liquid nitrogen using a pestle and mortar, added with PVPP [0.5%
and 1% (w/w) for roots and leaves samples, respectively],
homogenized in 4 volumes of extraction buffer [0.5 M
Tris-HCl pH 8, 0.7 M sucrose, 10 mM EDTA, 1 mM PMSF,
1 μM leupeptin, 0.1 mg mL-1 Pefabloc (Fluka), 0.2% (v/v)
MSH] and centrifuged at 13,000 g at 4°C for 20 min. The
resultant supernatant was centrifuged at 100,000 g at 4°C
for 38 min to obtain the soluble fraction. Proteins were
then purified using the method previously described by
Hurkman and Tanaka [92] by adding an equal volume of
ice-cold Tris buffered phenol (pH 8) to the supernatant.
Samples were shaken for 30 min at 4°C, incubated for 2 h
at 4°C and finally centrifuged at 5,000 g for 20 min at 4°C
to separate the phases. Proteins, grouped in the upper
phenol phase, were precipitated by the addition of five
volumes of -20°C pre-cooled 0.1 M ammonium acetate in
methanol and the incubation at -20°C overnight. Precipitated proteins were recovered by centrifuging at 13,000 g
at 4°C for 30 min and then washed again with cold methanolic ammonium acetate and three times with cold 80%
(v/v) acetone. The final pellet was dried under vacuum
and dissolved in IEF buffer [7 M urea, 2 M thiourea, 3%
(w/v) CHAPS, 1% (v/v) octylphenoxy polyethoxy ethanol
/>
(NP-40), 50 mg mL-1 DTT and 2% (v/v) IPG Buffer pH 3–
10 (GE Healthcare)] by vortexing and incubating for 1 h
at room temperature. Samples were centrifuged at 10,000
g for 10 min and the supernatants stored at -80°C until
further use. Protein concentration was determined by 2-D
Quant Kit (GE Healthcare).
2-DE analysis
Protein samples (400 μg) were loaded on pH 3–10, 24 cm
IPG strips passively rehydrated overnight in 7 M urea, 2 M
thiourea, 3% (w/v) CHAPS, 1% (v/v) NP-40, 10 mg mL-1
DTT and 0.5% (v/v) IPG Buffer pH 3–10. IEF was performed at 20°C with current limit of 50 μA/strip for about
90 kVh in an Ettan IPGphor (GE Healthcare). After IEF,
strips were equilibrated by gentle stirring for 15 min in an
equilibration buffer [100 mM Tris-HCl pH 6.8, 7 M urea,
2 M thiourea, 30% (w/v) glycerol, 2% (w/v) SDS] added
with 0.5% (w/v) DTT for disulfide bridges reduction and
for an additional 15 min in the same equilibration buffer
to which 0.002% (w/v) bromophenol blue and 4.5% w/v
iodoacetamide for cysteine alkylation were added. Second-dimensional SDS-PAGE [93] was run in 12.5% acrylamide gels using the ETTAN DALT six apparatus (GE
Healthcare). Running was first conducted at 5 W/gel for
30 min followed by 15 W/gel until the bromophenol blue
line ran off. Two replicates were produced for each biological replicate, thus obtaining six gels per condition (n = 6).
Proteins were stained using the colloidal Coomassie Brilliant Blue G-250 (cCBB) procedure, as previously
described by Neuhoff and co-workers [94]. The gels were
scanned in an Epson Expression 1680 Pro Scanner and
analyzed with ImageMaster 2-D Platinum Software (GE
Healthcare). Automatic matching was complemented by
manual matching. The molecular weights of the spots
were deduced on the basis of the migration of SigmaMarkers™ wide range (MW 6.500 – 205.000), while pIs were
determined according to the strip manufacturer's instructions (GE Healthcare) reporting on the reference gel of the
software-assisted analysis the values of pI predicted for
any given length of the strip. Both Mr and pI of the spots
of interest were then determined by using software-automated algorithm.
Relative spot volumes (%Vol) of the six replicate gels per
condition were compared and were analyzed according to
the Student's t-test to verify whether the changes were statistically significant (p < 0.05). This analysis was performed by using SigmaStat software. Only spots showing
at least a two-fold change in their relative volumes were
considered for successive analyses.
Protein in-gel digestion and LC-ESI-MS/MS analysis
Spots excised from gels stained with cCBB were digested as
described by Magni and co-workers [95] with some refine-
Page 13 of 17
(page number not for citation purposes)
BMC Plant Biology 2009, 9:113
ments. In detail, after the destaining procedure, spots were
dried under vacuum on a centrifugal evaporator and incubated in 10 mM DTT, 100 mM NH4HCO3 for 45 min at
56°C. The solution was replaced with 55 mM iodoacetamide, 100 mM NH4HCO3 and the spots were incubated
for 30 min in the dark at room temperature. After that,
spots were briefly washed with 100 mM NH4HCO3 and
again incubated for 15 min in 50% (v/v) acetonitrile
(ACN), for 3 min in 100% ACN, for 3 min in 100 mM
NH4HCO3, for 15 min in 50 mM NH4HCO3 in 50% (v/v)
ACN and finally dried under vacuum. The following
phases consisting in the protein digestion with trypsin
[Sequencing grade modified Trypsin V5111, Promega,
Madison] and in the recovery of peptides were carried out
as described in the article above cited.
/>
tein characterization by LC-ESI-MS/MS and analyzed the
MS data, participated in writing the methods section of
the manuscript. ASN analyzed the gels and performed statistical analyses. PP measured fluorescence parameters.
MC contributed to the interpretation of the results and
took part in the critical revision of the manuscript. LE conceived the study, coordinated the experiments, participated to the determination of biochemical and
physiological parameters, wrote and edited the manuscript. All authors read and approved the final manuscript.
Additional material
Additional file 1
Pictures of the plants. File shows the pictures of the experimental plant
material at the different sampling times.
Click here for file
[ />
The LC-ESI-MS/MS experiments were conducted using a
Surveyor (MS pump Plus) HPLC system directly connected to the ESI source of a Finnigan LCQ DECA XP MAX
ion trap mass spectrometer (ThermoFisher Scientific Inc.,
Waltham, USA). Chromatography separations were
obtained on a BioBasic C18 column (180 μm I.D × 150
mm length, 5 μm particle size), using a linear gradient
from 5% to 80% solvent B [solvent A: 0.1% (v/v) formic
acid; solvent B: ACN containing 0.1% (v/v) formic acid]
with a flow of 2.5 μl/min. ESI was performed in positive
ionization mode with spray voltage and capillary temperature set at 3 kV and at 220°C, respectively. Data were collected in the full-scan and data dependent MS/MS mode
with collision energy of 35% and a dynamic exclusion
window of 3 min.
Spectra were searched by TurboSEQUEST® incorporated in
BioworksBrowser 3.2 software (ThermoFisher Scientific
Inc., Waltham, USA) against the Zea mays protein subset,
Zea mays EST subset and against the protein NCBI-nr database, all downloaded from the National Center for Biotechnology Information [96]. The searches were carried
out assuming parent ion and fragment ion mass tolerance
of ± 2 Da and ± 1 Da, respectively, two possible missed
cleavages per peptide, fixed carboxyamidomethylation of
cysteine and variable methionine oxidation. Positive hits
were filtered on the basis of peptides scores [Xcorr ≥ 1.5
(+1 charge state), ≥ 2.0 (+2 charge state), ≥ 2.5 (≥ 3 charge
state), ΔCn ≥ 0.1, peptide probability < 1 × 10⁻³ and Sf ≥
0.70] [97]. If needed, identified peptides were used in protein similarity search performed by alignment analyses
against the NCBI-nr database using the FASTS algorithm
[98]. Physical properties of the characterized proteins
were predicted by in silico tools at ExPASy [99].
Authors' contributions
BP contributed to the conception of the experimental
design, carried out the determination of biochemical and
physiological parameters, protein extraction, 2-DE, pro-
Additional file 2
Caption of Additional file 3. Caption and legend of Additional file 3.
Click here for file
[ />
Additional file 3
Data on protein identification by LC-ESI-MS/MS and bioinformatic
analysis. Table shows the sequence of the peptides identified by MS/MS
and the statistical information related to peptides, proteins and alignment
analyses
Click here for file
[ />
Additional file 4
Details of the protein sequences assigned to spot 53. File shows in detail
the sequences of the PEPCase and UB proteins that were identified analyzing the spot 53 by LC-ESI-MS/MS, as well as the sequence alignment
analysis to verify the presence of the domain involved in monoubiquitination of the enzyme.
Click here for file
[ />
Acknowledgements
This work was supported by grants from the Italian Ministry of Education,
University and Research (MIUR-PRIN 2007). The authors wish to thank Dr.
Chiara Fedeli for her valuable contribution during the writing of this manuscript.
References
1.
2.
Marschner H: Mineral Nutrition of Higher Plants London: Academic
Press Limited; 1995.
Barker AV, Bryson GM: Nitrogen. In Handbook of Plant nutrition
Edited by: Barker AV, Pilbeam DJ. Boca Raton: CRC Press;
2007:21-50.
Page 14 of 17
(page number not for citation purposes)
BMC Plant Biology 2009, 9:113
3.
4.
5.
6.
7.
8.
9.
10.
11.
12.
13.
14.
15.
16.
17.
18.
19.
20.
21.
22.
23.
24.
Stitt M: Nitrate regulation of metabolism and growth. Curr
Opin Plant Biol 1999, 2:178-186.
Brouquisse R, Masclaux C, Feller U, Raymond P: Protein hydrolysis
and nitrogen remobilisation in plant life and senescence. In
Plant Nitrogen Edited by: Lea PJ, Morot-Gaudry JF. Hidelberg: SpringerVerlag Berlin Hidelberg; 2001:275-293.
Stitt M, Müller C, Matt P, Gibon Y, Carillo P, Morcuende R, Sheible
WR, Krapp A: Steps towards an integrated view of nitrogen
metabolism. J Exp Bot 2002, 53:959-970.
Miller AJ, Cramer MD: Root nitrogen acquisition and assimilation. Plant Soil 2004, 274:1-36.
Scheible WR, Morcuende R, Czechowski T, Fritz C, Osuna D, Palacios-Rojas N, Schindelasch D, Thimm O, Udvardi MK, Stitt M:
Genome-wide programming of primary and secondary
metabolism, protein synthesis, cellular growth processes,
and the regulatory infrastructure of Arabidopsis in response
to nitrogen. Plant Physiol 2004, 136:2483-2499.
Jackson LE, Burger M, Cavagnaro TR: Roots, nitrogen transformation and ecosystem services. Annu Rev Plant Biol 2008,
59:341-63.
Lawlor DW, Lemaire G, Gastal F: Nitrogen, plant growth and
crop yield. In Plant Nitrogen Edited by: Lea PJ, Morot-Gaudry JF.
Hidelberg: Springer-Verlag Berlin Hidelberg; 2001:343-367.
Hirel B, Bertin P, Quillere I, Bourdoncle W, Attagnant C, Dellay C,
Gouy A, Cadiou S, Retailliau C, Falque M, Gallais A: Towards a better understanding of the genetic and physiological basis for
nitrogen use efficiency in maize.
Plant Physiol 2001,
125:1258-1270.
Hagedorn F, Bucher JB, Schleppi P: Contrasting dynamics of dissolved inorganic and organic nitrogen in soil and surface
waters of forested catchments with Gleysols. Geoderma 2001,
100:173-192.
Owen AG, Jones DL: Competition for amino acids between
wheat roots and rhizosphere microorganisms and the role of
amino acids in plant N acquisition. Soil Biol Biochem 2001,
33:651-657.
Orsel M, Filleur S, Fraisier V, Daniel-Vedele F: Nitrate transport in
Plants: which gene and which control? J Exp Bot 2002,
53:825-833.
Ullrich CI, Novacky AJ: Extra and intracellular pH and membrane potential changes by K+, Cl-, H2PO4 and NO3 uptake
and fusicoccin in root hairs of Limnobium stoloniferum . Plant
Physiol 1990, 94:1561-1567.
McClure PR, Kochian LV, Spanwick RM, Shaff JE: Evidence for
cotransport of nitrate and protons in maize roots. I. Effects
of nitrate on the membrane potential. Plant Physiol 1990,
93:281-289.
Meharg AA, Blatt MR: NO3- transport across the plasma membrane of Arabidopsis thaliana root hairs: kinetic control by pH
and membrane voltage. J Membrane Biol 1995, 145:49-66.
Crawford NM, Glass ADM: Molecular and physiological aspects
of nitrate uptake in plants. Trends Plant Sci 1998, 3:389-395.
Huang NC, Liu KH, Lo HJ, Tsay YF: Cloning and functional characterization of an Arabidopsis nitrate transporter gene that
encodes a constitutive component of low-affinity uptake.
Plant Cell 1999, 11:1381-1392.
Espen L, Nocito FF, Cocucci M: Effect of NO3- transport and
reduction on intracellular pH: an in vivo NMR study in maize
roots. J Exp Bot 2004, 55:2053-2061.
Palmgren MG: Plant plasma membrane H+-ATPases: powerhouses for nutrient uptake. Annu Rev Plant Physiol Plant Mol Biol
2001, 52:817-845.
Santi S, Locci G, Monte R, Pinton R, Varanini Z: Induction of nitrate
uptake in maize roots: expression of putative high affinity
nitrate transporter and plasma membrane H+-ATPase isoforms. J Exp Bot 2003, 54:1851-1864.
Sondergaard TE, Schulz A, Palmgren MG: Energization of transport processes in plants. roles of the plasma membrane H1ATPase. Plant Physiol 2004, 136:2475-2482.
Oaks A, Hirel B: Nitrogen metabolism in roots. Annu Rev Plant
Physiol 1985, 36:345-365.
Meyer C, Stitt M: Nitrate reduction and signalling. In Plant Nitrogen Edited by: Lea PJ, Morot-Gaudry JF. Hidelberg: Springer-Verlag
Berlin Hidelberg; 2001:37-59.
/>
25.
26.
27.
28.
29.
30.
31.
32.
33.
34.
35.
36.
37.
38.
39.
40.
41.
42.
43.
44.
45.
46.
Hirel B, Lea PJ: Ammonia assimilation. In Plant Nitrogen Edited by:
Lea PJ, Morot-Gaudry JF. Hidelberg: Springer-Verlag Berlin Hidelberg;
2001:79-99.
Crawford NM: Nitrate: nutrient and signal for plant growth.
Plant Cell 1995, 7:859-868.
Paul MJ, Foyer CH: Sink regulation of photosynthesis. J Exp Bot
2001, 52:1383-1400.
Forde BG: Local and long-range signalling pathways regulating plant responses to nitrate. Annu Rev Plant Biol 2002,
53:203-224.
Wang R, Guegler K, LaBrie ST, Crawford NM: Genomic analysis of
a nutrient response in Arabidopsis reveals diverse expression patterns and novel metabolic and potential regulatory
genes induced by nitrate. Plant Cell 2000, 12:1491-1509.
Rossignol M: Analysis of the plant proteome. Curr Opin Biotech
2001, 12:131-134.
Roberts JKM: Proteomics and future generation of plant
molecular biologists. Plant Mol Biol 2002, 48:143-154.
Yarmush ML, Jayaraman A: Advances in proteomic technologies.
Annu Rev Biomed Eng 2002, 4:349-373.
Patterson SD, Aebersold RH: Proteomics: the first decade and
beyond. Nat Genet Suppl 2003, 33(Suppl):311-323.
Jorrín-Novo JV, Maldonato AM, EchevarríaZomo S, Valledor L,
Castllejo MA, Curto M, Valero J, Sghaier B, Donoso G, Redonado I:
Plant Proteomics update (2007–2008): Second-generation
proteomic techniques, an appropriate experimental design,
and data analysis to fulfil MIAPE standards, increase plant
proteome coverage and expand biological knowledge. J Proteomics 2009, 72:285-314.
Lawrence CJ, Dong Q, Mary L, Polacco ML, Seigfried TE, Brendel V:
MaizeGDB, the community database for maize genetics and
genomics. Nucleic Acids Res 2004, 32:D393-D397.
Porubleva L, Velden KV, Kothari S, David J, Oliver DJ, Parag R, Chitnis
PR: The proteome of maize leaves: Use of gene sequences
and expressed sequence tag data for identification of proteins with peptide mass Fingerprints. Electrophoresis 2001,
22:1724-1738.
Majeran W, Cai Y, Sun Q, van Wijk KJ: Functional differentiation
of bundle sheath and mesophyll maize chloroplasts determined by comparative proteomics.
Plant Cell 2005,
17:3111-3140.
Dembinsky D, Woll K, Saleem M, Liu Y, Fu Y, Borsuk LA, Lamkemeyer T, Fladerer C, Madlung J, Barbazuk B, Nordheim A, Nettleton
D, Schnable PS, Hochholdinger F: Transcriptomic and proteomic
analyses of pericycle cells of the maize primary root. Plant
Physiol 2007, 145:575-588.
Bahrman N, Le Gouls J, Negroni L, Amilhat L, Leroy P, Laìné AL, Jaminon O: Differential protein expression assessed by twodimensional gel electrophoresis for two wheat varieties
grown at four nitrogen levels. Proteomics 2004, 4:709-719.
Bahrman N, Gouy A, Devienne-Barret F, Hirel B, Vedele F, Le Gouis
J: Differential change in root protein pattern of two wheat
varieties under high and low nitrogen nutrition levels. Plant
Sci 2005, 168:81-87.
Foyer CH, Ferrario-Méry S, Noctor G: Interactions between carbon and nitrogen metabolism. In Plant Nitrogen Edited by: Lea PJ,
Morot-Gaudry JF. Hidelberg: Springer-Verlag Berlin Hidelberg;
2001:237-254.
Sivasankar S, Rothstein S, Oaks A: Regulation of the accumulation and reduction of nitrate by nitrogen and carbon metabolites in maize seedlings. Plant Physiol 1997, 114:583-589.
Klein D, Morcuende R, Stitt M, Krapp A: Regulation of nitrate
reductase expression in leaves by nitrate and nitrogen
metabolism is completely overridden when sugars fall below
a critical level. Plant Cell Environ 2000, 23:863-871.
Huppe HC, Turpin DH: Appearance of novel glucose-6-phosphate dehydrogenase isoforms in Chlamydomonas reinhardtii during growth on nitrate.
Plant Physiol 1996,
110:1431-1433.
Wang YH, Garvin DF, Kochian LV: Nitrate-induce genes in
tomato roots. Array analysis reveals novel genes that may
play a role in nitrogen nutrition. Plant Physiol 2001, 127:345-359.
Li M, Villemur R, Hussey PJ, Silflow CD, Gantt JS, Snustad DP: Differential expression of six glutamine synthetase genes in Zea
mays . Plant Mol Biol 1993, 23:401-407.
Page 15 of 17
(page number not for citation purposes)
BMC Plant Biology 2009, 9:113
47.
48.
49.
50.
51.
52.
53.
54.
55.
56.
57.
58.
59.
60.
61.
62.
63.
64.
65.
66.
67.
68.
69.
Sakakibara H, Kawabata S, Hase T, Sugiyama T: Differential effects
of nitrate and light on the expression of glutamine synthetases and ferredoxin-dependent glutamate synthase in
maize. Plant Cell Physiol 1992, 33:1193-1198.
Rockel P, Strube F, Rockel A, Wildt J, Kaiser WM: Regulation of
nitric oxide (NO) production by plant nitrate reductase in
vivo and in vitro. J Exp Bot 2002, 53:103-110.
Igamberdiev AU, Bycova NV, Hill RD: Nitric oxide scavenging by
barley hemoglobin is facilitated by a monodehydroascorbate
reductase-mediated ascorbate reduction of methemoglobin. Planta 2006, 223:1033-1040.
Lamattina L, Garcìa-Mata C, Pagnussat G: Nitric oxide: the versatility of an extensive signal molecule. Annu Rev Plant Biol 2003,
54:109-136.
Stöhr C, Stremlau S: Formation and possible roles of nitric
oxide in plant roots. J Exp Bot 2006, 57:463-470.
Zhao DY, Tian QY, Li LH, Zhang WH: Nitric oxide is involved in
nitrate-induced inhibition of root elongation in Zea mays .
Ann Bot 2007, 100:497-503.
Peschke VM, Sachs MM: Characterization and expression of
transcripts induced by oxygen deprivation in maize (Zea
mays L.). Plant Physiol 1994, 104:387-394.
Igamberdiev AU, Hill RD: Nitrate NO and haemoglobin in plant
adaptation to hypoxia: an alternative to classic fermentation
pathways. J Exp Bot 2004, 408:2473-2482.
Fritz C, Palacios-Rojas N, Fell R, Stitt M: Regulation of secondary
metabolism by the carbon-nitrogen status in tobacco:
nitrate inhibits large sectors of phenylpropanoid metabolism. Plant J 2006, 46:533-548.
Kingston-Smith AH, Bollard AL, Minchin FR: Stress-induced
changes in protease composition are determined by nitrogen supply in non-nodulating white clover. J Exp Bot 2005,
56:745-753.
Simões I, Faro C: Structure and function of plant aspartic proteinases. Eur J Biochem 2004, 271:2067-2075.
Askura T, Watanabe H, Abe K, Arai S: Rice aspartic proteinases,
oryzasin, expressed during seed ripening and germination,
has a gene organization distinct from those of animal and
microbial aspartic proteinases. Eur J Biochem 1995, 232:77-83.
Raven JA: Biochemical disposal of excess H+ in growing plants?
New Phytol 1986, 104:175-206.
Sakano K: Revision of biochemical pH-stat: involvement of
alternative pathway metabolisms. Plant Cell Physiol 1998,
39:467-473.
Britto DT, Kronzucker HJ: Nitrogen acquisition, PEP carboxylase, and cellular pH homeostasis: new views on old paradigms. Plant Cell Environ 2005, 28:1396-1409.
Uhrig RG, She YM, Leach CA, Plaxton WC: Regulatory monoubiquitination of phosphoenolpyruvate carboxylase in germinating castor oil seeds. JBC 2008, 283:29650-29657.
de Vetten NC, Ferl RJ: Two genes encoding GF14 (14-3-3) proteins in Zea mays. Structure, expression, and potential regulation by G-box-binding complex.
Plant Physiol 1994,
106:1593-1604.
Bihn EA, Paul AL, Wang SW, Erdos GW, Ferl RJ: Localization of 143-3 proteins in the nuclei of Arabidopsis and maize. Plant J
1997, 12:1439-1445.
Roberts MR: Regulatory 14-3-3 protein-protein interactions in
plant cells. Curr Opin Plant Biol 2000, 3:400-405.
Bachmann M, Huber JL, Athwal GS, Wu K, Ferl RJ, Huber SC: 14-33 proteins associate with the regulatory phosphorylation site
of spinach leaf nitrate reductase in an isoform-specific manner and reduce dephosphorylation of Ser-543 by endogenous
protein phosphatases. FEBS Lett 1996, 398:26-30.
Ikeda Y, Koizumi N, Kusano T, Sano H: Specific binding of a 14-33 protein to autophosphorylated WPK4, an SNF1-related
wheat protein kinase, and to WPK-4-phosphorylated nitrate
reductase. JBC 2000, 275:31695-31700.
Dickson R, Weiss C, Howard RJ, Alldrick SP, Ellis RJ, Lorimer G,
Azem A, Viitenen PV: Reconstitution of higher plant chloroplast
chaperonin 60 tetradecamers active in protein folding. JBC
2000, 275:11829-11835.
Averill RH, Bailey-Serres J, Kruger NJ: Co-operation between
cytosolic and plastidic oxidative pentose phosphate pathways revealed by 6-phosphogluconate dehydrogenase-deficient genotypes of maize. Plant J 1998, 14:449-457.
/>
70.
71.
72.
73.
74.
75.
76.
77.
78.
79.
80.
81.
82.
83.
84.
85.
86.
87.
88.
89.
90.
91.
Malkin R, Niyogi K: Photosynthesis. In Biochemistry and Molecular
Biology of Plants Edited by: Buchanan B, Gruissem W, Jones R. American Society of Plant Physiologists Rockville; 2000:568-628.
Rapala-Kozik M, Kowalaska E, Ostrowska K: Modulation of thiamine metabolism in Zea mays seedlings under conditions of
abiotic stress. J Exp Bot 2008, 59:4133-4143.
Edwards GE, Franceschi VR, Voznesenskaya EV: Single-cell C4 phothosynthesis versus the dual-cell (Kranz) paradigm. Annu Rev
Plant Biol 2004, 55:173-196.
Ueno Y, Imanari E, Emura J, Yoshizawa-Kumagaye K, Nakajiama K,
Inami K, Shiba T, Sakakibara H, Sugiyama T, Izui K: Immunological
analysis of the phosphorylation state of maize C4-form phosphoenolpyruvate carboxylase with specific antibodies raised
against a synthetic phosphorylated peptide. Plant J 2000,
21:17-26.
Izui K, Matsumura H, Furumoto T, Kai Y: Phosphoenolpyruvate
carboxylase: a new era of structural biology. Annu Rev Plant Biol
2004, 55:69-84.
Nemchenko A, Kunze S, Feussner I, Kolomietes M: Duplicate
maize 13-lipoxygenase genes are differentially regulated by
circadian rhythm, cold stress, wounding, pathogen infection,
and hormonal treatments. J Exp Bot 2006, 57:3767-3779.
Feussner I, Bachmann A, Höhne M, Kindl H: All three acyl moieties of trilinolein are efficiently oxygenated by recombinant
His-tagged lipid body lipoxygenase in vitro . FEBS Lett 1998,
431:433-436.
James HE, Robinson C: Nucleotide sequence of cDNA encoding
the precursor of the 23 kDa protein of the photosynthetic
oxygen-evolving complex from wheat. Plant Mol Biol 1991,
17:179-182.
Yoshiba Y, Yamaguchi-Shinozaki K, Shinozaki K, Harada Y: Characterization of a cDNA clone encoding 23 kDa polypeptide of
the oxygen-evolving complex of photosystem II in rice. Plant
Cell Physiol 1995, 36:1677-1682.
Sourosa M, Aro EM: Expression, assembly and auxiliary functions of photosystem II oxygen-evolving proteins in higher
plants. Photosynth Res 2007, 93:89-100.
Ifuku K, Yamamoto Y, Ono T, Ishihara S, Sato F: PsbP protein, but
not PsbQ protein, is essential for the regulation and stabilization of photosystem II in higher plants. Plant Physiol 2005,
139:1175-1184.
Gaude N, Bréhélin C, Tischendorf G, Kessler F, Dörmann P: Nitrogen deficiency in Arabidopsis affects galactolipid composition and gene expression and results in accumulation of fatty
acid phytyl esters. Plant J 2007, 49:729-739.
Sakurai I, Mizusawa N, Wada H, Sato N: Digalactosyldiacylglycerol is required for stabilization of the oxygen-evolving complex in photosystem II. Plant Physiol 2007, 145:1361-1370.
Cataldo DA, Haroon M, Schrader LE, Youngs VL: Rapid colorimetric determination of nitrate in plant tissue by nitration of salicylic acid. Commun Soil Sci Plant Anal 1975, 6:71-80.
Ferrario-Méry S, Valadier MH, Foyer CH: Overexpression of
nitrate reductase in tobacco delays drought-induced
decreases in nitrate reductase activity and mRNA. Plant Physiol 1998, 117:293-302.
Nelson NA: A photometric adaptation of the Somogy method
for the determination of glucose. JBC 1944, 153:375-384.
Moore S, Stein WH: A modified ninhydrin reagent for the photometric determination of amino acids and related compounds. JBC 1954, 211:907-913.
Martínez-Garcia JF, Monte E, Quall PH: A simple, rapid and quantitative method for preparing Arabidopsis protein extracts
for immunoblot analysis. Plant J 1999, 20:251-257.
Lichtenthaler HK: Chlorophylls and carotenoids: Pigments of
photosynthetic biomembranes.
Met Enzymol 1987,
148:350-382.
Heat RL, Packer K: Photoperoxidation in isolated chloroplasts.
I. Kinetics and stoichiometry of fatty acid peroxidation. Arch
Biochem Biophys 1968, 125:189-198.
Krause GH, Weis E: Chlorophyll fluorescence and photosynthesis: the basics. Annu Rev Plant Physiol Plant Mol Biol 1991,
42:313-349.
Genty B, Briantais JM, Baker NR: The relationship between the
quantum yield of photosynthetic electron transport and
quenching of chlorophyll fluorescence. BBA 1989, 990:87-92.
Page 16 of 17
(page number not for citation purposes)
BMC Plant Biology 2009, 9:113
92.
93.
94.
95.
96.
97.
98.
99.
/>
Hurkman WJ, Tanaka CK: Solubilization of plant membrane
proteins for analysis by two-dimensional gel electrophoresis.
Plant Physiol 1986, 81:802-806.
Laemmli UK: Cleavage of structural proteins during the
assembly of the head of bacteriophage. T4. Nature 1970,
227:680-685.
Neuhoff V, Arold N, Taube D, Ehrhardt W: Improved staining of
proteins in polyacrylamide gels including isoelectric focusing
gels with clear background at nanogram sensitivity using
Coomassie Brilliant Blue G-250 and R-250. Electrophoresis
1988, 9:255-262.
Magni C, Scarafoni A, Herndl A, Sessa F, Prinsi B, Espen L, Duranti M:
Combined electrophoretic approaches for the study of white
lupin mature seed storage proteome. Phytochemistry 2007,
68:997-1007.
National Center for Biotechnology Information
[http://
www.ncbi.nlm.nih.gov/]
Eng JK, McCormack AL, Yates JR III: An approach to correlate
tandem mass spectral data of peptides with amino acid
sequences in a protein database. J Am Soc Mass Spectrom 1994,
5:976-989.
Mackey AJ, Haystead TAJ, Pearson WR: Getting more from less:
algorithms for rapid protein identification with multiple
short peptide sequences. Mol Cell Proteomics 2002, 1:139-147.
ExPASy Proteomics Server [ />
Publish with Bio Med Central and every
scientist can read your work free of charge
"BioMed Central will be the most significant development for
disseminating the results of biomedical researc h in our lifetime."
Sir Paul Nurse, Cancer Research UK
Your research papers will be:
available free of charge to the entire biomedical community
peer reviewed and published immediately upon acceptance
cited in PubMed and archived on PubMed Central
yours — you keep the copyright
BioMedcentral
Submit your manuscript here:
/>
Page 17 of 17
(page number not for citation purposes)