báo cáo khoa học: " Characterization of microsatellites and gene contents from genome shotgun sequences of mungbean (Vigna radiata (L.) Wilczek)" pptx
Bạn đang xem bản rút gọn của tài liệu. Xem và tải ngay bản đầy đủ của tài liệu tại đây (1.5 MB, 12 trang )
BioMed Central
Page 1 of 12
(page number not for citation purposes)
BMC Plant Biology
Open Access
Research article
Characterization of microsatellites and gene contents from
genome shotgun sequences of mungbean (Vigna radiata (L.)
Wilczek)
Sithichoke Tangphatsornruang
1
, Prakit Somta
2
,
Pichahpuk Uthaipaisanwong
1
, Juntima Chanprasert
1
, Duangjai Sangsrakru
1
,
Worapa Seehalak
2
, Warunee Sommanas
2
, Somvong Tragoonrung*
1
and
Peerasak Srinives
2
Address:
1
National Center for Genetic Engineering and Biotechnology, 113 Phaholyothin Rd., Klong 1, Klong Luang, Pathumthani 12120,
Thailand and
2
Department of Agronomy, Faculty of Agriculture at Kamphaeng Saen, Kasetsart University, Kamphaeng Saen Campus, Nakhon
Pathom 73140, Thailand
Email: Sithichoke Tangphatsornruang - ; Prakit Somta - ;
Pichahpuk Uthaipaisanwong - ; Juntima Chanprasert - ;
Duangjai Sangsrakru - ; Worapa Seehalak - ; Warunee Sommanas - ;
Somvong Tragoonrung* - ; Peerasak Srinives -
* Corresponding author
Abstract
Background: Mungbean is an important economical crop in Asia. However, genomic research has lagged
behind other crop species due to the lack of polymorphic DNA markers found in this crop. The objective
of this work is to develop and characterize microsatellite or simple sequence repeat (SSR) markers from
genome shotgun sequencing of mungbean.
Result: We have generated and characterized a total of 470,024 genome shotgun sequences covering
100.5 Mb of the mungbean (Vigna radiata (L.) Wilczek) genome using 454 sequencing technology. We
identified 1,493 SSR motifs that could be used as potential molecular markers. Among 192 tested primer
pairs in 17 mungbean accessions, 60 loci revealed polymorphism with polymorphic information content
(PIC) values ranging from 0.0555 to 0.6907 with an average of 0.2594. Majority of microsatellite markers
were transferable in Vigna species, whereas transferability rates were only 22.90% and 24.43% in Phaseolus
vulgaris and Glycine max, respectively. We also used 16 SSR loci to evaluate phylogenetic relationship of 35
genotypes of the Asian Vigna group. The genome survey sequences were further analyzed to search for
gene content. The evidence suggested 1,542 gene fragments have been sequence tagged, that fell within
intersected existing gene models and shared sequence homology with other proteins in the database.
Furthermore, potential microRNAs that could regulate developmental stages and environmental
responses were discovered from this dataset.
Conclusion: In this report, we provided evidence of generating remarkable levels of diverse
microsatellite markers and gene content from high throughput genome shotgun sequencing of the
mungbean genomic DNA. The markers could be used in germplasm analysis, accessing genetic diversity
and linkage mapping of mungbean.
Published: 24 November 2009
BMC Plant Biology 2009, 9:137 doi:10.1186/1471-2229-9-137
Received: 21 May 2009
Accepted: 24 November 2009
This article is available from: />© 2009 Tangphatsornruang et al; licensee BioMed Central Ltd.
This is an Open Access article distributed under the terms of the Creative Commons Attribution License ( />),
which permits unrestricted use, distribution, and reproduction in any medium, provided the original work is properly cited.
BMC Plant Biology 2009, 9:137 />Page 2 of 12
(page number not for citation purposes)
Background
Mungbean (Vigna radiata (L.) Wilczek) is an important
food leguminous crop in Asia, with an annual production
of around 3.5 - 4.0 million tons [1]. The crop is grown
principally for its protein-rich dry seeds (24% protein)
which is a major protein source for people in Asian coun-
tries as part of a nutritionally balance diet [2]. It is popu-
larly grown as a component in various cropping systems
because of its ability to fix nitrogen in association with
soil bacteria, early maturity (ca. 60 days) and relatively
drought tolerance. Mungbean belongs to the genus Vigna,
in which several species such as azuki bean (Vigna angula-
ris (Wild.) Ohwi & Ohashi), bambara groundnut (Vigna
subterranea (L.) Verdc.), blackgram (Vigna mungo (L.) Hep-
per), cowpea (Vigna unguiculata (L.) Walp.), moth bean
(V. aconitifolia (Jacq.) Maréchal) and rice bean (Vigna
umbellata (Thunb.) Ohwi & Ohashi), are domesticated
and utilized in a similar way to mungbean.
Mungbean is a self-pollinated diploid plant with 2n = 2x
= 22 chromosomes and a genome size of 515 Mb/1C [3].
Genomic study in this crop is far behind other legume
crops. Mungbean was among the primary crops that
genetic linkage maps have been developed. However, the
current linkage maps, based on RFLP and RAPD markers
of mungbean, do not resolve 11 linkage groups [4]. Mic-
rosatellites or simple sequence repeats (SSRs) are markers
of choice for crop improvement of many species because
they are reliable and easy to score [5]. SSRs are clusters of
short tandem repeated nucleotide bases distributed
throughout the genome. SSR markers are co-dominant,
multi-allelic and requiring small amount of DNA for scor-
ing. The traditional method of SSR marker development
involves construction of SSR-enriched library, cloning,
and sequencing, which is costly and labor intensive. Nev-
ertheless, significant efforts have been invested in devel-
opment of SSR markers in recent years, but so far only 35
polymorphic SSR markers published for mungbean [6-
10]. In a study by Somta et. al. (2008), more than 200
primer pairs amplifying SSRs were tested for polymor-
phism among 17 mungbean accessions, only 12 (5.7%)
primer pairs were polymorphic. The authors suggested
that the use of SSR markers has been limited due to the
lack of polymorphism in this species [7].
Over the past few years, the introduction of a massively-
parallel pyrosequencing technology developed by 454
Life Sciences Technology has opened new possibilities for
high-throughput genome analysis [11]. This new technol-
ogy has been applied to the sequencing of microbial
genomes, genotyping, genome resequencing, transcrip-
tome profiling and methylation studies. Although,
sequences generated by this technique are relatively short,
there are evidences suggesting that this technique can be
used to sequence plant genomes that are complex and
large [12-14]. Wicker et al. (2006) suggested that 454
sequencing technology could reveal almost complete
assembly of the entire gene sequences in 4 barley BAC
clones at only 9-folds coverage and concluded that the
method is a rapid and cost effective way of sequencing the
gene-containing portions of the genome. Low coverage
shotgun sequencing using 454 sequencing technology has
also been used to study functional genomics in soybean
[12], repetitive DNA in the pea genome [14] and tran-
scriptome from a normalized cDNA library of Medicago
truncatula [15]. Here, we report genome shotgun sequenc-
ing of the mungbean genomic DNA using 454 Life Sci-
ences sequencing technology for isolation of SSR markers
and characterization of gene content.
Results and Discussion
Shotgun sequencing of Vigna radiata genome
Sequencing of Vigna radiata genomic DNA was carried out
using 454 Life Sciences technology on the Genome
Sequencer (GS) FLX System. A total of 470,024 quality fil-
tered sequence reads was generated with the average read
length of 216 bases covering 100.5 Mb. All reads were
deposited in NCBI Short Read Archive (ID = SRA003681)
/>. Assembly of the
obtained nucleotide sequence reads was performed using
the Newbler, de novo sequence assembly software [11].
Redundant reads were reduced to 46,646 contigs with the
average contig length of 297 bases covering 13.85 Mb. The
contig sequence data were reported in the DDBJ/EMBL/
GenBank nucleotide sequence databases with the acces-
sion number BABL01000001-BABL01046645. The contig
length ranges from 89 bases to 44,462 bases. The average
GC content of mungbean genomic DNA generated in this
study is 34.69% which is consistent with the reports on
GC contents in other plant genomes such as Arapbidopsis
(36% [16]), grape (34.6% [17]), poplar (33.7% [18]),
tomato (36.2% [19]) and potato (35.6% [19]). It is
slightly higher than the mean of GC content for intergenic
regions in the Arabidopsis genome (32.9%, Genome Indi-
ces 8/04: http://http//gi.kuicr.kyoto-u.ac.jp
) [20]; but it is
much lower than the average GC content of Arabidopsis
coding sequences (44.5%) [21].
Characterization of polymorphic microsatellite markers in
Vigna radiata
We isolated 1,493 microsatellite regions using the Troll
software. There were 889 dinucleotide repeats (DNPs),
282 trinucleotide repeats (TNPs), 123 tetranucleotide
repeats (TTNPs), 124 pentanucleotide repeats (PNPs) and
75 SSRs with hexanucleotide repeats or more. The distri-
bution of the number of motif repeat ranged from 4 - 30
repeats (Table 1). The most common motif type of DNPs
was TA/AT (89.3% of DNPs) followed by TC/AG (7.1% of
BMC Plant Biology 2009, 9:137 />Page 3 of 12
(page number not for citation purposes)
DNPs) and AC/TG (3.6% of DNPs). The GC/CG motif
was not found in the data set. TNPs were found at 282 SSR
loci (18.9%), which was three times lower than that of
DNPs. The TAA repeat was the most common motif type
found at 184 loci (65.24% of TNPs). The least frequent
TNP motif was GC-rich (GCG/CGC) found at only 2 loci.
The genomic SSRs with GC-rich motif repeats are rare in
most plants as previously reported in rice, corn, soybean
[22], wheat [23], Arabidopsis thaliana, apricot, peach [24],
coffee [25] and rubber tree [26]. In contrast, the GC-rich
motifs have been reported as frequent motifs in studies on
development of SSR from expressed sequence tags and
genomes with methylation filtration [27-30]. Thus, GC-
rich SSR are most likely to be derived from the coding
region of the genome. The frequency of identified SSR in
mungbean was one SSR in every 67 kb (1,493 SSRs in
100.5 Mb) which is significantly lower than the SSR fre-
quency in soybean (1/7.4 kb) [31]. Among plant species,
the SSR frequencies range from 1/1.5 kb in coffee to 1/20
kb in cotton [25,31]. The observed low SSR frequency in
this study is probably because a large proportion of reads
from the low coverage sequencing (0.2x) of the mung-
bean genome were biased toward highly repetitive parts of
the genome.
From 1,493 identified SSRs, 192 SSRs were identified
from contigs and 1,301 SSRs were from singletons.
Among 192 contigs containing SSR motifs, majority of
contigs were assembled from 2 reads (87 contigs) fol-
lowed by 3 reads (48 contigs) and 4 reads (16 contigs)
(Table 2). By applying the Lander-Waterman model [32]
to this dataset, there should be no contig assembled from
more than 9 reads provided that all sequences were gener-
ated by chance from non repetitive DNA (Table 2). There-
fore, 16 out of 192 contigs that were assembled from
more than 9 reads are likely to represent repetitive
sequences of the genome. It should be noted that loci
present in multiple copies are not desirable for construc-
tion of genetic maps. Interestingly, there was a highly
repetitive contig containing SSR (contig 44495) which
was assembled from 3,174 raw reads. Sequence homology
search revealed that contig 44495 is a fragment of the
chloroplast genome. The number of chloroplast genome
of higher plants can reach hundreds of copies per cell. Due
to the deep sequencing nature of 454 technology, it is
expected to obtain a large number of reads from
sequences with multiple copies such as organellar
genomes, transposons and ribosomal DNA [12]. The
degree of sequencing over-representation in a repetitive
Table 1: Distribution of identified SSRs using the Troll software according to SSR motif type and repeat number.
Number of motif repeat Di Tri Tetra Penta Hexa Hepta Octa
n = 4 N/A N/A N/A 97 45 14 2
n = 5 N/A N/A 89 20 4 2 0
n = 6 N/A N/A 23 4 3 1 0
n = 7 N/A 142 9 2 0 0 0
n = 8 N/A 75 1 0 0 0 0
n = 9 N/A 36 0 0 0 1 1
n = 10 137 17 1 1 1 0 1
n = 11 115 4 0 0 0 0 0
n = 12 80 3 0 0 0 0 0
n = 13 50 1 0 0 0 0 0
n = 14 59 0 0 0 0 0 0
n = 15 50 2 0 0 0 0 0
n = 16 46 1 0 0 0 0 0
n = 17 45 0 0 0 0 0 0
n = 18 49 1 0 0 0 0 0
n = 19 43 0 0 0 0 0 0
n = 20 48 0 0 0 0 0 0
n = 21 32 0 0 0 0 0 0
n = 22 25 0 0 0 0 0 0
n = 23 30 0 0 0 0 0 0
n = 24 34 0 0 0 0 0 0
n = 25 10 0 0 0 0 0 0
n = 26 19 0 0 0 0 0 0
n = 27 10 0 0 0 0 0 0
n = 28 30 0 0 0 0 0
n = 29 30 0 0 0 0 0
n = 30 10 0 0 0 0 0
total 889 282 123 124 53 18 4
BMC Plant Biology 2009, 9:137 />Page 4 of 12
(page number not for citation purposes)
genome can be estimated from the difference between the
observed read coverage and the predictions from the
Lander-Waterman model (Table 2) as suggested by [12]. It
should be noted that the number of observed contigs with
assembled reads = 2 was much lower than the prediction
by the model. This was probably due to the effect of low
sequencing coverage; thus it was not included in the cal-
culation of the number of repetitive reads. In total, there
were 241,410 reads (51%) present in multiple copies. We
estimated that 51% of shotgun reads from 0.2× genome
coverage represented repetitive DNA. This estimate is
slightly more than the result from the DNA re-association
kinetic study which estimated 46% of the total leaf DNA
as repetitive sequences [33].
To evaluate these SSR loci in further detail, we designed
192 primer pairs to amplify all SSR loci identified from
the contig data set. Among the 192 primer pairs evaluated
in 17 mungbean accessions, 179 (93.23%) primer pairs
were amplifiable and 127 (66.14%) primer pairs pro-
duced scorable bands. Of these, 58 primer pairs targeting
60 loci revealed polymorphism because 2 primer pairs,
VR257 and VR400, were able to target 2 independent loci
for each primer pair. Characteristics of all 60 loci are sum-
marized in Additional File 1. These primer pairs were able
to detect a range of 2 to 6 alleles with a mean of 2.6833
alleles per locus. Polymorphic information content (PIC)
values ranged from 0.0555 to 0.6907 with an average of
0.2594 which is similar to the previous studies [7,34]. In
this study, there were 33 pair-wise combinations that sig-
nificantly deviated from linkage disequilibrium (LD).
Genetic variation at a given locus in a population is meas-
ured by the observed heterozygosity (H
O
). The H
O
values
varied from 0 to 0.6471 with the average H
O
of 0.0289;
while the expected heterozygosity (H
E
) values ranged
from 0.0571 to 0.7356 with the average H
E
of 0.2908.
Tests for Hardy-Weinberg equilibrium (HWE) of the pol-
ymorphic loci revealed that all loci, except VR400, were
significantly deviated from HWE (P < 0.05). This is in
agreement with the previous studies in mungbean which
have shown that most if not all of the loci deviated from
HWE [6,7,34]. The low level of heterozygosity and signif-
icant deviation from HWE are probably because mung-
bean is a highly self-pollinated species with an estimated
outcrossing rate of only 1.1% [35].
We also tested the SSR locus in the highly repetitive contig
44495, which was a fragment on the chloroplast genome.
The VR0453 locus, located in the non-coding region near
the atpB gene in the chloroplast genome, had 2 alleles and
showed relatively low PIC value of 0.1046 (see Additional
File 1). Chloroplast microsatellites have been used in eco-
logical and evolutionary studies, especially at the intraspe-
cific level, because they are nonrecombinant,
uniparentally inherited and effectively haploid [36].
However, the major barrier for utilization of chloroplast
microsatellites is the low mutation rates associated with
the chloroplast genome [37] leading to low polymor-
phism level of markers in the chloroplast genome.
Sequence homology search of other loci against the Gen-
bank non-redundant protein database and the TIGR plant
repeat databases [38] revealed that there were 5 loci
(VR029, VR073, VR216, VR256 and VR323) matched
Table 2: The table lists number of contigs containing SSRs, observed number of contigs from 454 data set, predicted number of contigs
according to the Lander-Waterman model for sampling a completely non-repetitive genome and the repetitive sequences calculated
using the differences between the observed number of contigs and the predictions.
Number of reads in
contigs
Predicted number of
contigs by model
Observed number of
contigs
repetitive reads
(observed-predicted)
Observed number of
contigs containing SSR
2 59398 19622 n/a 87
3 10350 13576 9678 48
4 1803 6020 16868 16
5 314 2491 10885 6
6 55 1270 7290 10
7 10 765 5285 2
8 2 518 4128 3
9 1 363 3258 4
10 0 262 2620 1
11 0 216 2376 2
12 0 169 2028 1
13 0 149 1937 1
14 0 116 1624 1
15 0 115 1725 3
≥ 16 0 994 171708 7
total 241410 192
BMC Plant Biology 2009, 9:137 />Page 5 of 12
(page number not for citation purposes)
unknown proteins, 1 locus (VR390) matched beta-glu-
cosidase and 1 locus (VR102) matched pectinesterase (see
Additional File 1). Note that there was no sequence
matched against known repeat sequences in the TIGR
plant repeat databases.
Cross-species transferability of Vigna radiata
microsatellite markers
With the exception of azuki bean (V. angularis), SSR mark-
ers are very limited for other Vigna species. Therefore,
novel markers with high cross-species transferability rates
are desirable. Cross-species amplification of the 127 mic-
rosatellite markers was assessed in 24 taxa of legumes in
the tribe Phaseoleae including genus Vigna (African and
Asian Vigna), Phaseolus and Glycine. One hundred and
twenty five primer pairs successfully amplified DNA from
more than one legume. Five primer pairs were able to
amplify DNA of all legume taxa tested; while VR339
amplified only 1 legume species, V. aconitifolia. In most
cases, mungbean microsatellite primers were able to
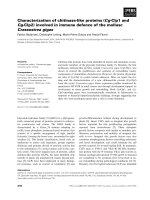
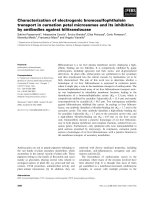
amplify DNA of other Vigna species (Figure 1). The trans-
ferability rates of mungbean primers were between
45.80% (V. subterranean) and 91.60% (V. angularis).
However, the amplification rate was reduced in Phaseolus
vulgaris and Glycine max to 22.90% and 24.43%, respec-
tively (Figure 1). Transferability rate of mungbean
genomic microsatellite markers to other Vigna species
appeared to be more or less similar to previous studies.
Somta et al. (2009) reported that amplification of genic
microsatellite markers in 19 taxa of Vigna species was
between 80% (V. aconitifolia) to 95.3% (V. reflex-pilosa)
[39]. Whereas, Chaitieng et al. (2006) reported that
amplification of azuki bean (V. angularis) microsatellite
markers in V. mungo, V. radiata, V. aconitifolia and V.
umbellata was between 68.8 to 90.2% [40]. The high
amplification rates of both mungbean and azuki bean
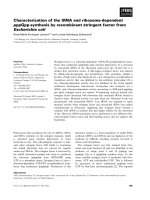
Cross-species amplification of 127 mungbean microsatellite markers in various species from genus Vigna, Phaseolus and GlycineFigure 1
Cross-species amplification of 127 mungbean microsatellite markers in various species from genus Vigna, Pha-
seolus and Glycine. Abbreviations are as followed: Vac = V. aconitifolia, Van = V. angularis var. angularis, Van (wild) = V. angularis
var. nipponensis, Var = V. aridicola, Vex = V. exilis, Vgr = V. grandiflora, Vhi = V. hirtella, Vmi =
V. minima, Vmu = V. mungo var.
mungo, Vum(wild) = V. mungo var. sylvestris, Vna = V. nakashimae, Vne = V. nepalensis, Vra = V. radiata var. radiate, Vra(wild) = V.
radiata var. sublobata, Vst = V. stipulacea, Vsu = V. subramaniana, Vte = V. tenuicaulis, Vtr = V. trilobata, Vum = V. umbellate, Vsn =
V. subterranean, Vun-Ung = V. unguiculata cv-gr. Unguiculata, Vun-Ses = V. unguiculata cv-gr. Sesquipedalis, Pha = P. vulgaris and Gly
= G. max.
77.10
91.60
66.41
77.10
67.94
72.52
74.81
71.76
77.10
83.97
68.70
74.81
76.34
80.15
75.57
66.41
73.28
59.54
45.80
56.49
52.67
22.90
24.43
0
10
20
30
40
50
60
70
80
90
100
V
a
c
V
a
n
V
a
n
(
w
i
l
d)
V
a
r
V
e
x
V
g
r
V
h
i
V
m
i
V
m
u
V
m
u
(
w
i
l
d)
V
n
a
V
n
e
V
s
t
V
s
u
V
t
e
V
t
r
V
u
m
V
um
(
w
i
l
d)
V
s
n
V
un
-
U
ng
V
u
n
-
S
e
s
P
h
a
G
l
y
% amplificatio
n
BMC Plant Biology 2009, 9:137 />Page 6 of 12
(page number not for citation purposes)
microsatellite markers in Vigna species indicate high
genome homology among species in this genus and are
useful for genetics and genomics studies, especially
genome mapping and comparative genomics.
Phylogenetic relationship
To determine the genetic diversity structure and relation-
ships between 35 genotypes of 20 taxa of Asian Vigna, pol-
ymorphism scores at 16 microsatellite loci without
missing data were used (see Additional File 2). UPGMA
cluster analysis was conducted using software NTSYSpc
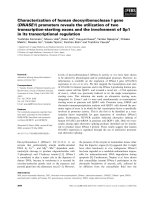
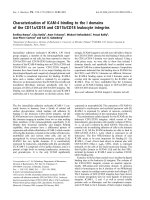
2.2 [41]. Results from the cluster analysis revealed that all
the genotypes of Asian Vigna could be clearly differenti-
ated and classified into two groups; mungbean group and
azuki bean group (Figure 2). The results were in agree-
ment with previous studies using non-coding sequences
of trnT-F [42,43]. In contrast, studies using AFLP [44],
rDNA-ITS and atpB-rbcL sequences [45] recognized three
groups within the Asian Vigna. In addition, it is worth not-
ing that V. nepalensis, which has similar morphology [46]
and close genetic relationship with V. angularis [43,45],
was found to be highly distinct in our study. V. grandiflora
previously shown to have high morphological and genetic
similarity to V. radiata [46,47] was found to have closer
genetic relationship with V. trilobata and V. stipulacea than
V. radiate in this study. Also, V. subramaniana that was
reported to be closely related to mungbean [45] appeared
to be more distant from mungbean but more closely
related to V. aridicola in our study. It should be noted that
V. subramaniana has a complex taxonomic history, contro-
versy in the literature and classification concerning the
taxonomy of this species still remains [48]. The differ-
ences in the phylogenetic relationship of Asian Vigna may
be explained by the differences in the methods used in the
previous studies. Morphological traits [46], rDNA and
cpDNA sequences [43,45] were used in previous studies
to demonstrate phylogenetic relationship, while our study
used SSR markers for demonstration. The use of PCR-
based SSR markers may possibly result in size homoplasy
of PCR products between/among species [49]. The same
A dendrogram depicting genetic diversity and relationships among 35 genotypes from 20 taxa of Asian Vigna as revealed by the polymorphism of 16 mungbean microsatellite markersFigure 2
A dendrogram depicting genetic diversity and relationships among 35 genotypes from 20 taxa of Asian Vigna
as revealed by the polymorphism of 16 mungbean microsatellite markers. Accession codes from the AVRDC-The
world vegetable center and the National Institute of Agrobiological Sciences (Japan) are provided in brackets.
BMC Plant Biology 2009, 9:137 />Page 7 of 12
(page number not for citation purposes)
allele size of an SSR locus may contain different sequence
variants; thus species sharing the same SSR allelic size
include species that are identical by descent and species
that have originated from convergent evolution.
Sequence annotation and gene ontology
The contigs were analyzed by GeneMark.hmm eukaryotic
version 3.3 [50] to predict Open Reading Frame (ORF)
using Medicago trunculata as a model organism and default
parameter conditions. Results from GeneMark predicted a
total of 44,112 ORFs. For functional annotation, the
potential coding regions were analyzed by BLAST2GO
[51] leading to consistent gene annotations, assigning
gene names, gene products, EC numbers and Gene Ontol-
ogy (GO) numbers. Gene Ontology provides a system to
categorize description of gene products according to three
ontologies: molecular function, biological process and
cellular component. Sequence homology search revealed
that there were 1,542 ORFs matches with non-redundant
protein database with an E-value cut-off at E-6. Nine hun-
dreds and fifty sequences were mapped to one or more
ontologies with multiple assignments possible for a given
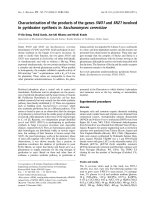
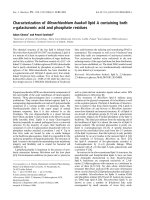
protein within a single ontology. There were 647 assign-
ments made to the molecular function ontology, with a
large proportion of these in catalytic (42.72%) and bind-
ing activities (44.17%) categories (Figure 3a). Under the
biological process ontology, 555 assignments were made
with a large proportion of assignments fell into metabolic
process and cellular process (such as secretory pathway,
transcription and translation) categories (Figure 3b).
Similarity of mungbean predicted ORFs with other plant
ESTs
To identify gene functions, the mungbean contig set was
blasted (TBLASTX) to identify ESTs encoding similar pro-
teins, at an e-value cutoff at E-6, against other plant gene
indices collected in The Gene Index Databases, Dana Far-
ber Cancer Institute, such as soybean (GMGI, 13.0), Ara-
bidopsis (AGI, 13.0), rice (OGI, 17.0), M. truncatula
(MTGI, 9.0) and Vitis vinifera (VVGI, 6.0) [52]. The
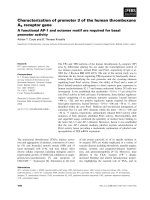
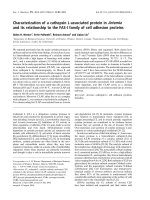
number of sequences that showed similarity to encoding
sequences is shown in Figure 4. Comparison between the
mungbean dataset and the Glycine max gene index gave
the highest number of matched sequences (7,940
sequences). V. radiata and G. max are grouped together as
tropical season legumes or Phaseoloid exhibiting exten-
sive genome conservation based on previous comparative
genetic mapping [53,54]. The other Papilionoideae leg-
ume, M. truncatula, which is a cold season legume, also
shares a large number of homologous sequences (5,759
sequences) with the mungbean dataset. A. thaliana and V.
vinifera gave lower number of matched sequences to the
mungbean dataset; 4872 and 4,949 sequences respec-
tively. The lowest number of matched sequences (1,971
sequences) was observed when the mungbean dataset was
blasted against the Oryza sativa gene index, the only
monocot plant used in the comparison.
Discovery of microRNA
To predict functional non-coding RNA, such as micro-
RNA, in the mungbean dataset, we made computational
prediction of potential microRNA using MiRFinder to
search for the potential hairpin-loop structure in their
sequences [55]. Next we calculated the minimal folding
free energy (MFE) using Sfold [56]. There were 2,247
microRNA candidates with MFE < -25 kcal/mol which
were selected for further analysis. Then we blasted the
mungbean microRNA candidates against previously
known microRNAs from Arabidopsis, rice, and other
plant species to search for potentially conserved microR-
NAs. A total of 4 miRNA candidates had sequence homol-
ogy with miR171, miR408, miR1171 and miR414, which
have been shown to target genes coding for SCARE-
CROW-like proteins implicated in radial root pattern
[57], plantacyanin [58], copper chaperone [59] and trans-
lation initiation factor [60], respectively (Table 3).
Conclusion
The results provided by the present study highlight a reli-
able and efficient way in obtaining polymorphic micros-
atellite markers and characterization of putative genes
using shotgun genome sequences of Vigna radiata. A sig-
nificance of the results from this study is that high-
throughput shotgun sequences of mungbean can be use-
ful not only for marker development, construction of link-
age map, mungbean genetic improvement, phylogenetic
relationship, but also for gene discovery as the paucity of
DNA markers in cultivated mungbean has precluded
detailed genetic research on this crop.
Methods
Plant materials, DNA extraction and 454 Life Sciences
Sequencing
Seventeen accessions of mungbean (Vigna radiata) and the
other 23 taxa of legumes in the tribe Phaseoleae including
genus Vigna (African Vigna and Asian Vigna), Phaseolus
and Glycine as listed in Additional File 3 were used in this
study. For sequencing, DNA was extracted from young leaf
tissue of mungbean cultivar "Kamphaeng Saen 1" using
DNAeasy Plant Mini Kit (Qiagen). For SSR analysis, DNA
of all plant materials was extracted from young fresh
leaves using CTAB method [61]. The concentration of
each sample was calculated from OD measurement and
the samples were separated by gel electrophoresis on
0.8% agarose gels. The sequencing was performed using
the GS-FLX instrument (454 Life Sciences, Branford, CT)
and yielded 470,024 quality filtered sequence reads with
the average length of 216 bp. The reads were deposited
into NCBI Short Read Archive.
BMC Plant Biology 2009, 9:137 />Page 8 of 12
(page number not for citation purposes)
Gene Ontology classification of the predicted mungbean ORFs according to molecular function (a) and biological process (b) using BLAST2GO [51] with E-6 cutoffFigure 3
Gene Ontology classification of the predicted mungbean ORFs according to molecular function (a) and biolog-
ical process (b) using BLAST2GO [51]with E-6 cutoff.
a
b
BMC Plant Biology 2009, 9:137 />Page 9 of 12
(page number not for citation purposes)
Prediction of sequencing coverage in contigs from a com-
pletely non repetitive genome was calculated according to
the Lander and Waterman model [32]. The number of
contigs expected containing a number of reads j is given
by equation 1.
Where N is the number of reads, L is the read length, G is
the haploid genome size in base pairs, and T is the base
pair overlap required for contig formation (in this case T
= 40).
Isolation, amplification and transferability of SSR markers
In order to identify microsatellite markers, non-redun-
dant sequences were screened for SSRs using TROLL soft-
ware />. For the
searches, we defined SSRs as being DNP ≥ 14 bases; TNP
≥ 15 bases; TTNP ≥ 16 bases; HNP (and more) ≥ 16 bases
[31]. For comparison of SSRs in plant genomic sequences,
we used the criteria of SSR motif of ≥ 20 bases [31,62,63].
Primer pairs were designed to amplify microsatellite
regions using PRIMER3 [64]. PCR was carried out in a
total volume of 10 μL containing 2 ng of DNA template,
1× Taq buffer, 2 mM MgCl
2
, 0.2 mM dNTPs, 1 U Taq DNA
polymerase (Fermentas) and 0.5 μM each of forward and
reverse primers. Amplification was performed in a Gene-
Amp PCR 9700 System thermocycler (Applied Biosys-
tems) programmed as follow: 94°C for 2 min followed by
35 cycles of 94°C for 30 s, 50-65°C for 30 s, 72°C for 1
min, and a final extension step at 72°C for 10 min. Ampli-
fied products were separated on 5% denaturing polyacry-
lamide gels and visualized by silver-staining.
Analysis of polymorphic loci
Seventeen mungbean genotypes as listed in Additional
File 3 were used for polymorphism analysis of SSR mark-
ers. Details of primer pairs for SSR markers are listed in
Additional File 4. Scoring data from polymorphic loci
were used to calculate Polymorphism Information Con-
tent (PIC) [65], Hardy-Weinberg equilibrium (HWE)
[66], pairwise linkage disequilibrium (LD) using chi-
square test, and observed heterozygosity and expected
heterozygosity using the PowerMarker 3.25 software [67].
Cross taxa transferability and phylogenetic relationship
The cross taxa transferability of all scorable 127 SSR loci
was evaluated using 17 accessions of mungbean (Vigna
radiata) and the other 23 taxa of legumes in the tribe Pha-
seoleae including genus Vigna (African Vigna and Asian
Vigna), Phaseolus and Glycine (see Additional File 3). The
percentage of transferability was calculated for each taxon
(23 taxa) in which the detected fragment/the total
number of loci analyzed. A genetic similarity matrix (see
Additional File 2) was prepared for 35 genotypes from 20
taxa at 16 SSR loci (as listed in Additiional File 4).
UPGMA (unweighted pair group method with arithmetic
mean) cluster analysis was conducted using software
NTSYSpc 2.2 [41].
Analysis of gene content and annotation
The mungbean contig set was analyzed in two parts which
are 1) gene prediction/Gene Ontology (GO) term annota-
tion and 2) functional gene identification. Gene-
Ne e
c
LN
G
T
L
ccj−−
−
==−
21
1
1
ss
s
()
Comparison of mungbean ORFs with 8 other plant gene indi-ces by tBLASTX (e-value cutoff = E-6)Figure 4
Comparison of mungbean ORFs with 8 other plant
gene indices by tBLASTX (e-value cutoff = E-6). Blue
bars represent mungbean contigs with similar homology
search against other plant gene index databases including
soybean (GMGI, 13.0), Arabidopsis (AGI, 13.0), rice (OGI,
17.0), M. truncatula (MTGI, 9.0) and Vitis vinifera (VVGI, 6.0).
Table 3: Results from homology search of the mungbean microRNA candidates against the microRNA database.
Read name Contig miRNA family MFE (kcal/mol) Target Ref
E4UUDJH02I4UG8 contig25352 miR171 -37 SCARECROW-like protein Reinhart et al., 2002
E4UUDJH02HINHM contig16040 miR408 -29 plantacyanin Sunkar and Zhu, 2004
E4UUDJH01ECGTX contig11544 miR1171 -25 putative copper chaperone3 Molnar et al., 2007
E4UUDJH01AVSEX contig25342 miR414 -26 TIF3H1 Fattash et al., 2007
microRNA families and their target genes are also present in the table.
BMC Plant Biology 2009, 9:137 />Page 10 of 12
(page number not for citation purposes)
Mark.hmm eukaryotic version 3.3 [50] based on Hidden
Markov Models was used to predict coding sequence (cds)
of the contig set using Medicago trunculata as a model
organism and default parameter conditions. For the func-
tional annotation, the potential coding sequences were
analyzed by BLAST2GO [51]. To identify gene functions,
sequence similarity search program-BLAST was used to
identify ESTs encoding similar proteins of the mungbean
contig set. All 46,646 contigs were blasted (TBLASTX)
with the threshold E-value cutoff at 1e-6 against 580,213
assembled Unique Transcripts sequences from various
plant species from The Plant Genome DataBase (Plant-
GDB) [52], which included Arabidopsis thaliana
(324,630), Glycine max (105,862), Medicago truncatula
(57,231), Oryza sativa (44,644), and Vitis vinifera
(47,846).
Authors' contributions
ST conceived of the study together with the other authors,
carried out the major part of the experiments, analyzed
the results and drafted the manuscript. PS, WS and WM
prepared plant materials and performed genetic analysis.
DS participated in library construction and sequencing.
PU and JC participated in analysis of the results. PS and ST
participated in coordination and analysis of the results.
All authors participated in writing the final manuscript.
All authors read and approved the final manuscript.
Additional material
Acknowledgements
We acknowledge Dr. Piyanot Wirachsilp and the support by the Genome
Institute, the National Center for Genetic Engineering and Biotechnology
(Thailand), the National Science and Technology Development Agency
(Thailand) and the Center for Agricultural Biotechnology, Kasetsart Uni-
versity, Kamphaeng Saen Campus through the Project on Biotechnology for
Varietal Development of Thai Mungbean. We are thankful to Dr. Norihiko
Tomooka of the National Institute of Agrobiological Sciences, Japan for
providing Vigna germplasm (JP number) used in this study and Dr. Darin
Kongkasuriyachai for reviewing the manuscript.
References
1. Weinberger K: Impact analysis on mungbean research in
south and southeast Asia. AVRDC Processing No 9991175.
Shanhua, Taiwan 2003.
2. Poehlman JM: The mungbean. New Delhi: Oxford & IBH Publishing
Co. PVT. Ltd; 1991.
3. Parida A, Raina SN, Narayan RKJ: Quantitative DNA variation
between and within chromosome complements of Vigna spe-
cies (Fabaceae). Genetica 1990, 82:125-133.
4. Humphry E, Konduri V, Lambrides J, Magner T, McIntyre L, Aitken B,
Liu J: Development of a mungbean (Vigna radiata) RFLP link-
age map and its comparison with lablab (Lablab purpureus)
reveals a high level of colinearity between the two genomes.
Theor Appl Genet 2002, 105(1):160-166.
5. Gupta P, Varshney R: The development and use of microsatel-
lite markers for genetic analysis and plant breeding with
emphasis on bread wheat. Euphytica 2000, 113:163-185.
6. Gwag JG, Chung JW, Chung HK, Lee JH, Ma KH, Dixit A, Park YJ, Cho
EG, Kim TS, Lee SH: Characterization of new microsatellite
markers in mung bean, Vigna radiata (L.). Molecular Ecology
Notes 2006, 6(4):1132-1134.
7. Somta P, Musch W, Kongsamai B, Chanprame S, Nakasathien S, Too-
jinda T, Sorajjapinun W, Seehalak W, Tragoonrung S, Srinives P: New
microsatellite markers isolated from mungbean (Vigna radi-
ata (L.) Wilczek). Mol Ecol Resource 2008, 8:1155-1157.
8. Kumar SV, Tan SG, Quah SC, Yusoff K: Isolation of microsatellite
markers in mungbean, Vigna radiata . Molecular Ecology Notes
2002, 2(2):96-98.
9. Kumar SV, Tan SG, Quah SC, Yusoff K: Isolation and characteri-
zation of seven tetranucleotide microsatellite loci in mung-
bean, Vigna radiata . Molecular Ecology Notes 2002, 2(3):293-295.
10. Miyagi M, Humphry M, Ma ZY, Lambrides CJ, Bateson M, Liu CJ: Con-
struction of bacterial artificial chromosome libraries and
their application in developing PCR-based markers closely
linked to a major locus conditioning bruchid resistance in
mungbean (Vigna radiata
L. Wilczek). Theor Appl Genet 2004,
110(1):151-156.
11. Margulies M, Egholm M, Altman WE, Attiya S, Bader JS, Bemben LA,
Berka J, Braverman MS, Chen YJ, Chen Z, et al.: Genome sequenc-
ing in microfabricated high-density picolitre reactors. Nature
2005, 437(7057):376-380.
12. Swaminathan K, Varala K, Hudson ME: Global repeat discovery
and estimation of genomic copy number in a large, complex
genome using a high-throughput 454 sequence survey. BMC
Genomics 2007, 8:132.
13. Wicker T, Schlagenhauf E, Graner A, Close TJ, Keller B, Stein N: 454
sequencing put to the test using the complex genome of bar-
ley. BMC Genomics 2006, 7:275.
Additional file 1
Characteristics of 58 primer pairs targeting 60 polymorphic microsat-
ellite loci analyzed in 17 accessions of mungbean (16 cultivated and
1 wild mungbean) as listed in Additional File 3. PCR conditions and
electrophoresis were described in Somta et al. (2008) [7]. Polymorphism
information content (PIC), observed heterozygosity, expected heterozygos-
ity, Hardy-Weinberg equilibrium (HWE), pair-wise and linkage disequi-
librium (LD) of polymorphic loci were calculated using software
POWERMARKER 3.25 [67].
Click here for file
[ />2229-9-137-S1.DOC]
Additional file 2
Dice's Similarity Matrix. This additional file contains a table expressing
the Dice's Similarity Matrix.
Click here for file
[ />2229-9-137-S2.DOC]
Additional file 3
Plants used in this study. This additional file contains a table listing all
of the plants used in the study.
Click here for file
[ />2229-9-137-S3.DOC]
Additional file 4
SSRs used in the phylogenetic study. This additional file contains a table
showing the SSRs used in the phylogenetic study.
Click here for file
[ />2229-9-137-S4.DOC]
BMC Plant Biology 2009, 9:137 />Page 11 of 12
(page number not for citation purposes)
14. Macas J, Neumann P, Navratilova A: Repetitive DNA in the pea
(Pisum sativum L.) genome: comprehensive characterization
using 454 sequencing and comparison to soybean and Medi-
cago truncatula. BMC Genomics 2007, 8:427.
15. Cheung F, Haas BJ, Goldberg SM, May GD, Xiao Y, Town CD:
Sequencing Medicago truncatula expressed sequenced tags
using 454 Life Sciences technology. BMC Genomics 2006, 7:272.
16. Analysis of the genome sequence of the flowering plant Ara-
bidopsis thaliana . Nature 2000, 408(6814):796-815.
17. Jaillon O, Aury JM, Noel B, Policriti A, Clepet C, Casagrande A,
Choisne N, Aubourg S, Vitulo N, Jubin C, et al.: The grapevine
genome sequence suggests ancestral hexaploidization in
major angiosperm phyla. Nature 2007, 449(7161):463-467.
18. Tuskan GA, Difazio S, Jansson S, Bohlmann J, Grigoriev I, Hellsten U,
Putnam N, Ralph S, Rombauts S, Salamov A, et al.: The genome of
black cottonwood, Populus trichocarpa (Torr. & Gray). Sci-
ence 2006, 313(5793):1596-1604.
19. Zhu W, Ouyang S, Iovene M, O'Brien K, Vuong H, Jiang J, Buell CR:
Analysis of 90 Mb of the potato genome reveals conservation
of gene structures and order with tomato but divergence in
repetitive sequence composition. BMC Genomics 2008, 9:286.
20. Thomas BC, Rapaka L, Lyons E, Pedersen B, Freeling M: Arabidopsis
intragenomic conserved noncoding sequence. Proc Natl Acad
Sci USA 2007, 104(9):3348-3353.
21. Wang HC, Hickey DA: Rapid divergence of codon usage pat-
terns within the rice genome. BMC Evol Biol 2007, 7(Suppl 1):S6.
22. Gao LF, Tang JF, Li HW, Jia JZ: Analysis of microsatellites in
major crops assessed by computational and experimental
approaches. Molecular Breeding 2003, 12(3):245-261.
23. Nicot N, Chiquet V, Gandon B, Amilhat L, Legeai F, Leroy P, Bernard
M, Sourdille P: Study of simple sequence repeat (SSR) markers
from wheat expressed sequence tags (ESTs). Theoretical and
Applied Genetics 2004, 109(4):
800-805.
24. Jung S, Abbott A, Jesudurai C, Tomkins J, Main D: Frequency, type,
distribution and annotation of simple sequence repeats in
Rosaceae ESTs. Funct Integr Genomics 2005, 5(3):136-143.
25. Aggarwal RK, Hendre PS, Varshney RK, Bhat PR, Krishnakumar V,
Singh L: Identification, characterization and utilization of
EST-derived genic microsatellite markers for genome anal-
yses of coffee and related species. Theoretical and Applied Genetics
2007, 114(2):359-372.
26. Feng SP, Li WG, Huang HS, Wang JY, Wu YT: Development, char-
acterization and cross-species/genera transferability of EST-
SSR markers for rubber tree (Hevea brasiliensis). Molecular
Breeding 2009, 23(1):85-97.
27. Yonemaru J, Ando T, Mizubayashi T, Kasuga S, Matsumoto T, Yano M:
Development of genome-wide simple sequence repeat
markers using whole-genome shotgun sequences of sor-
ghum (Sorghum bicolor (L.) Moench). DNA Res 2009,
16(3):187-193.
28. Bedell JA, Budiman MA, Nunberg A, Citek RW, Robbins D, Jones J,
Flick E, Rholfing T, Fries J, Bradford K, et al.: Sorghum genome
sequencing by methylation filtration. PLoS Biol 2005, 3(1):e13.
29. Yu JK, Dake TM, Singh S, Benscher D, Li W, Gill B, Sorrells ME:
Development and mapping of EST-derived simple sequence
repeat markers for hexaploid wheat. Genome 2004,
47(5):805-818.
30. Asp T, Frei UK, Didion T, Nielsen KK, Lubberstedt T: Frequency,
type, and distribution of EST-SSRs from three genotypes of
Lolium perenne, and their conservation across orthologous
sequences of Festuca arundinacea, Brachypodium distach-
yon, and Oryza sativa. BMC Plant Biol 2007, 7:36.
31. Cardle L, Ramsay L, Milbourne D, Macaulay M, Marshall D: Compu-
tational and experimental characterization of physically
clustered simple sequence repeats in plants. Genetics 2000,
156:847-854.
32. Lander ES, Waterman MS: Genomic mapping by fingerprinting
random clones: a mathematical analysis. Genomics 1988,
2(3):231-239.
33. Murray MG, Palmer JD, Cuellar RE, Thompson WF: Deoxyribonu-
cleic acid sequence organisation in the mungbean genome.
Biochemistry 1979, 18:5259-5266.
34. Seehalak W, Somta P, Sommanas W, Srinives P: Microsatellite
markers for mungbean developed from sequence database.
Mol Ecol Resour 2009, 9:862-864.
35. Sangsiri C, Kaga A, Tomooka N, Vaughan D, Srinives P: Genetic
diversity of the mungbean (Vigna radiata, Leguminosae)
genepool based on microsatellite analysis. Aust J Bot 2007,
55:837-847.
36. Provan J, Powell W, Hollingsworth PM: Chloroplast microsatel-
lites: new tools for studies in plant ecology and evolution.
Trends Ecol Evol 2001, 16:142-147.
37. Wolfe KH, Li WH, Sharp PM: Rates of nucleotide substitution
vary greatly among plant mitochondrial, chloroplast, and
nuclear DNAs. Proc Natl Acad Sci USA 1987, 84(24):9054-9058.
38. Ouyang S, Buell CR: The TIGR plant repeat databases: a collec-
tive resource for the identification of repetitive sequences in
plant. Nucleic Acids Research 2004, 32:360-363.
39. Somta P, Seehalak W, Srinives P: Development, characterization
and cross-species amplification of mungbean (Vigna radiata)
genic microsatellite markers. Conserv Genet 2009 [http://
www.springerlink.com/content/01738786115x452g/].
40. Chaitieng B, Kaga A, Tomooka N, Isemura T, Kuroda Y, Vaughan DA:
Development of a black gram [Vigna mungo (L.) Hepper]
linkage map and its comparison with an azuki bean [Vigna
angularis (Willd.) Ohwi and Ohashi] linkage map. Theor Appl
Genet 2006, 113(7):1261-1269.
41. Rohlf FJ: NTSYS-pc: numerical taxonomy and multivariate
analysis system version 2.2. NewYork: Exeter Publishing Ltd;
2005.
42. Yano A, Yasuda K, Yamaguchi H: A test for molecular identifica-
tion of Japanese archaeological beans and phylogenetic rela-
tionship of wild and cultivated species of subgenus
Ceratotropis (Genus Vigna, Papilionaceae) using sequence
variation in two non-coding regions of the trnL and trnF
genes. Economic Botany 2004, 58:S135-S146.
43. Ye TT, Yamaguchi H: Phylogenetic relationship of wild and cul-
tivated Vigna (subgenus Ceratotropis, Fabaceae) from Myan-
mar based on sequence variations in non-coding regions of
trnT-F. Breed Sci 2007, 57:271-280.
44. Tomooka N, Yoon MS, Doi K, Kaga A, Vaughan D: AFLP analysis
of diploid species in the genus Vigna subgenus Ceratotropis.
Genet Resour Crop Ev 2002, 49(5):521-530.
45. Doi K, Kaga A, Tomooka N, Vaughan DA: Molecular phylogeny of
genus Vigna subgenus Ceratotropis based on rDNA ITS and
atpB-rbcL intergenic spacer of cpDNA sequences. Genetica
2002, 114(2):129-145.
46. Tomooka N, Vaughan DA, Moss H, Maxted N: The Asian Vigna:
Genus Vigna Subgenus Ceratotropis Genetic Resources. Klu-
wer, Dordrecht; 2002.
47. Seehalak W, Tomooka N, Waranyuwat P, Thipyapong P, Laosuwan P,
Kaga A, Vaughan DA: Genetic diversity of the Vigna germplasm
from Thailand and neighboring regions revealed by AFLP
analysis. Genet Resour Crop Evol 2006, 53:1043-1059.
48. Tomooka N, Kaga A, Vaughan D: The Asian Vigna (
Vigna subge-
nus Ceratotropis) biodiversity and evolution. In Plant Genome
Diversity and Evolution Enfield: Science Publishers; 2006.
49. Garza JC, Slatkin M, Freimer NB: Microsatellite allele frequencies
in humans and chimpanzees, with implications for con-
straints on allele size. Mol Biol Evol 1995, 12(4):594-603.
50. Lukashin AV, Borodovsky M: GeneMark.hmm: new solutions for
gene finding. Nucleic Acids Res 1998, 26(4):1107-1115.
51. Conesa A, Gotz S, Garcia-Gomez JM, Terol J, Talon M, Robles M:
Blast2GO: a universal tool for annotation, visualization and
analysis in functional genomics research. Bioinformatics 2005,
21(18):3674-3676.
52. Duvick J, Fu A, Muppirala U, Sabharwal M, Wilkerson MD, Lawrence
CJ, Lushbough C, Brendel V: PlantGDB: a resource for compar-
ative plant genomics. Nucleic Acids Res 2008:D959-965.
53. Boutin SR, Young ND, Olson TC, Yu ZH, Vallejos CE, Shoemaker
RC: Genome conservation among three legume genera
detected with DNA markers. Genome 1995, 38(5):928-937.
54. Choi HK, Mun JH, Kim DJ, Zhu H, Baek JM, Mudge J, Roe B, Ellis N,
Doyle J, Kiss GB, et al.: Estimating genome conservation
between crop and model legume species. Proc Natl Acad Sci USA
2004, 101(43):15289-15294.
55. Huang TH, Fan B, Rothschild MF, Hu ZL, Li K, Zhao SH: MiRFinder:
an improved approach and software implementation for
genome-wide fast microRNA precursor scans. Bmc Bioinfor-
matics 2007, 8:341.
Publish with Bio Med Central and every
scientist can read your work free of charge
"BioMed Central will be the most significant development for
disseminating the results of biomedical research in our lifetime."
Sir Paul Nurse, Cancer Research UK
Your research papers will be:
available free of charge to the entire biomedical community
peer reviewed and published immediately upon acceptance
cited in PubMed and archived on PubMed Central
yours — you keep the copyright
Submit your manuscript here:
/>BioMedcentral
BMC Plant Biology 2009, 9:137 />Page 12 of 12
(page number not for citation purposes)
56. Ding Y, Chan CY, Lawrence CE: Sfold web server for statistical
folding and rational design of nucleic acids. Nucleic Acids Res
2004, 32:W135-W141.
57. Reinhart BJ, Weinstein EG, Rhoades MW, Bartel B, Bartel DP: Micro-
RNAs in plants. Genes Dev 2002, 16(13):1616-1626.
58. Sunkar R, Zhu JK: Novel and stress-regulated microRNAs and
other small RNAs from Arabidopsis. Plant Cell 2004,
16(8):2001-2019.
59. Molnar A, Schwach F, Studholme DJ, Thuenemann EC, Baulcombe
DC: miRNAs control gene expression in the single-cell alga
Chlamydomonas reinhardtii . Nature 2007, 447(7148):1126-1129.
60. Fattash I, Voss B, Reski R, Hess WR, Frank W: Evidence for the
rapid expansion of microRNA-mediated regulation in early
land plant evolution. BMC Plant Biol 2007, 7:13.
61. Murray MG, Thompson WF: Rapid isolation of high molecular
weight plant DNA. Nucleic Acids Res 1980, 8(19):4321-4325.
62. Wang Z, Weber JL, Zhong G, Tanksley SD: Survey of plant short
tandem repeats. Theor Appl Genet 1994, 88:1-6.
63. Lagercrantz U, Ellegren H, Andersson L: The abundance of vari-
ous polymorphic microsatellite motifs differs between plants
and vertebrates. Nucleic Acids Res 1993, 21(5):1111-1115.
64. Rozen S, Skaletsky H: Primer3 on the WWW for general users
and for biologist programmers. Methods Mol Biol 2000,
132:365-386.
65. Botstein D, White RL, Skalnick MH, Davies RW: Construction of a
genetic linkage map in man using restriction fragment
length polymorphism. Am J Hum Genet 1980, 32:314-331.
66. Guo SW, Thompson EA: Performing the exact test of Hardy-
Weinberg proportion for multiple alleles. Biometrics 1992,
48(2):361-372.
67. Liu K, Muse SV: PowerMarker: an integrated analysis environ-
ment for genetic marker analysis. Bioinformatics 2005,
21(9):2128-2129.