báo cáo khoa học: " Analysis of a post-translational steroid induction system for GIGANTEA in Arabidopsis" pdf
Bạn đang xem bản rút gọn của tài liệu. Xem và tải ngay bản đầy đủ của tài liệu tại đây (437.13 KB, 13 trang )
BioMed Central
Page 1 of 13
(page number not for citation purposes)
BMC Plant Biology
Open Access
Research article
Analysis of a post-translational steroid induction system for
GIGANTEA in Arabidopsis
Markus Günl, Eric FungMin Liew, Karine David and Joanna Putterill*
Address: Plant Molecular Sciences, School of Biological Sciences, University of Auckland, Private Bag 92019, Auckland, New Zealand
Email: Markus Günl - ; Eric FungMin Liew - ; Karine David - ;
Joanna Putterill* -
* Corresponding author
Abstract
Background: To investigate the link between the flowering time gene GIGANTEA (GI) and
downstream genes, an inducible GI system was developed in Arabidopsis thaliana L. Heynh.
Transgenic Arabidopsis plant lines were generated with a steroid-inducible post-translational
control system for GI. The gene expression construct consisted of the coding region of the GI
protein fused to that of the ligand binding domain of the rat glucocorticoid receptor (GR). This
fusion gene was expressed from the constitutive cauliflower mosaic virus 35S promoter and was
introduced into plants carrying the gi-2 mutation. Application of the steroid dexamethasone (DEX)
was expected to result in activation of the GI-GR protein and its relocation from the cytoplasm to
the nucleus.
Results: Application of DEX to the transgenic plant lines rescued the late flowering phenotype
conferred by the gi-2 mutation. However, despite their delayed flowering in the absence of steroid,
the transgenic lines expressed predicted GI downstream genes such as CONSTANS (CO) to relatively
high levels. Nevertheless, increased CO and FLOWERING LOCUS T (FT) transcript accumulation was
observed in transgenic plants within 8 h of DEX treatment compared to controls which was
consistent with promotion of flowering by DEX. Unlike CO and FT, there was no change in the
abundance of transcript of two other putative GI downstream genes HEME ACTIVATOR PROTEIN
3A (HAP3A) or TIMING OF CHLOROPHYLL A/B BINDING PROTEIN 1 (TOC1) after DEX application.
Conclusion: The post-translational activation of GI and promotion of flowering by steroid
application supports a nuclear role for GI in the floral transition. Known downstream flowering
time genes CO and FT were elevated by DEX treatment, but not other proposed targets HAP3A
and TOC1, indicating that the expression of these genes may be less directly regulated by GI.
Background
Timing the transition to flowering to synchronise with
favourable seasons of the year is critical for successful sex-
ual reproduction in many plants. Arabidopsis thaliana (L.)
Heynh (Arabidopsis) flowers rapidly in the lengthening
days of spring and summer (long days; LD 16h L/8 h dark)
and shows delayed flowering in short day conditions (SD,
8 h L/16 h D) [1]. GIGANTEA (GI) is a key regulator of the
photoperiodic response of Arabidopsis as plants carrying
mutations in this gene no longer flower rapidly in
response to LD [1,2]. Instead, the gi mutant develops a
large rosette of leaves and thus is "gigantic" in size com-
Published: 30 November 2009
BMC Plant Biology 2009, 9:141 doi:10.1186/1471-2229-9-141
Received: 30 June 2009
Accepted: 30 November 2009
This article is available from: />© 2009 Günl et al; licensee BioMed Central Ltd.
This is an Open Access article distributed under the terms of the Creative Commons Attribution License ( />),
which permits unrestricted use, distribution, and reproduction in any medium, provided the original work is properly cited.
BMC Plant Biology 2009, 9:141 />Page 2 of 13
(page number not for citation purposes)
pared to wild type plants before finally flowering. The gi
mutant flowers at a similarly delayed time as wild type
plants in SD.
Since the role of GI in promoting flowering was first high-
lighted by mutant analysis [1], GI has been shown to have
other distinct functions. These include roles in photomor-
phogenesis and in regulation of the circadian clock, an
internal oscillator that regulates daily rhythms of ~24 h in
duration [2-8]. A molecular basis for some of the effects of
GI on clock function was recently provided [9]. GI was
shown to interact with an F-box containing blue light
receptor ZEITLUPE (ZTL) leading to the proteasome-
dependant degradation of the central clock component
TIMING OF CHLOROPHYLL A/B BINDING PROTEIN 1
(TOC1) [9,10].
A module of genes acting in the order GI - CONSTANS
(CO) - FLOWERING LOCUS T (FT) were shown to pro-
mote flowering in LD [reviewed by [11]]. These are all
rhythmically expressed and regulated by the circadian
clock [11]. FT encodes a strong promoter of flowering
which was recently shown to function as a mobile flower-
ing hormone or "florigen" [reviewed by [12]]. After induc-
tion of FT transcription, FT protein was produced in the
vasculature of the leaves, mobilized in the phloem and
uploaded in the shoot apex where it interacted with a bZip
transcription factor called FD [reviewed by [12]]. This led
to activation of genes including the floral integrator SUP-
PRESSION OF OVEREXPRESSION OF CO1 (SOC1) in the
shoot apex, then floral meristem identity genes such as
APETALA 1 (AP1) and the transition from vegetative to
floral development [reviewed by [12]]. The coincidence of
CO expression with light in the late afternoon in LD stabi-
lized the CO protein resulting in up-regulation of FT in
the late afternoon and promotion of flowering [reviewed
by [13]]. In SD, CO was expressed predominantly in the
night and CO protein was degraded and thus flowering
was not promoted [reviewed by [13]].
GI was placed upstream of CO in the photoperiod path-
way, as CO expression was reduced in gi mutants and up-
regulated by over expression of GI from the cauliflower
mosaic virus 35S promoter (35S) [5,14]. As expected from
the regulatory hierarchy just described, the gi mutant had
very low transcript levels of FT [14]. How GI might func-
tion at the molecular level to promote CO expression and
flowering was not clear from its amino acid sequence
which was predicted to form a large 1173 aa protein with
no domains of known biochemical function such as DNA
binding [2,5,7]. GI transcript cycled and accumulated to
peak levels ~10 h after dawn with highest protein levels at
~12 h after lights on (Zeitgeber 12, ZT 12) in LD [2,15].
CO transcript was biphasic with a peak in the late after-
noon in LD and a second peak persisting through the
night and at dawn then falling to trough levels during
much of the day [14,16]. Recently, GI and a blue light
receptor FKF1 (FLAVIN-BINDING, KELCH REPEAT, F-
BOX 1), related to ZTL, were shown to interact in a light-
stimulated fashion and target a repressor of CO transcrip-
tion - CYCLING DOF FACTOR 1 - for degradation by the
proteasome [16-18]. Chromatin immunoprecipitation
assays showed that the FKF1 and GI proteins interacted in
vivo with the CO gene promoter supporting a nuclear role
for GI in flowering [18].
Despite this remarkable progress, important questions
remain about the molecular role of GI in promoting the
transition to flowering and the other processes that it
influences. For example, it is not clear if GI promotes
flowering solely through GI-FKF1 interactions as 35S::GI
constructs accelerate flowering in fkf1
mutant plants [18]
and CO transcript levels are reduced in gi mutants at all
time points in both LD and SD [5,14], not only in the late
afternoon in LD when GI and FKF1 interact in wild type
plants [18].
Thus, our overall aim was to use an inducible GI system to
ascertain if there were other previously unknown early tar-
gets (protein or transcript) of GI action that would cast
light on the broader roles of GI. The approach chosen was
to fuse the ligand binding domain of the rat glucocorti-
coid receptor (GR) to the C-terminus of GI. This would
allow post-translational induction of GI activity by appli-
cation of the steroid hormone Dexamethasone (DEX)
[reviewed by [19]].
Previously, use of a similar post-translational steroid
induction system was very productive in the search for
early targets of the flowering time regulator CO [20-22].
Plants carrying a 35S::CO-GR transgene flowered earlier
than wild type in the presence of DEX [20] and 1 h of DEX
treatment increased the expression of CO targets such as
FT and TWIN SISTER OF FT (TSF) [21,22]. Furthermore,
the increased transcript accumulation occurred in the
presence of the translational inhibitor cycloheximide.
This indicated that translation of other gene products was
not needed once DEX had been applied and thus that FT
and TSF were direct targets of CO.
Here we report on the characterisation of a steroid-induc-
ible post-translational control system for GI in Arabidop-
sis.
Results and Discussion
A steroid-inducible GI fusion protein promotes the
transition to flowering
We constructed transgenic gi lines to investigate floral
induction and gene expression using a post-translation-
ally-inducible GI protein. The transgenic lines (TG lines)
BMC Plant Biology 2009, 9:141 />Page 3 of 13
(page number not for citation purposes)
were designed to express a GI protein fusion protein com-
posed of a 277 amino acid ligand binding domain of the
rat glucocorticoid receptor (GR) fused to the C-terminus
of GI in a gi mutant background (ecotype Columbia, Col,
carrying the strong gi-2 allele [2]). The fusion gene was
expressed from the constitutive 35S promoter. The tran-
script and protein product of the 35S::GI-GR construct
were expected to be present throughout the day/night
cycle in LD in the transgenic plants. Experiments with two
other epitope tagged versions of 35S::GI supported this
idea as immunoblotting with antibodies directed to these
epitope tags showed there was only a slight variation in
the steady state levels of those fusion proteins in total pro-
tein extracts in LD [15]. In addition, the GI protein fusions
to these epitope tags were functional in that they could
rescue the late flowering phenotype of gi-2 mutants in LD
[15].
The GI-GR fusion proteins described here would be
expected to be non functional in the absence of added
steroid and retained in the cytoplasm, while in the pres-
ence of DEX, the fusion protein would relocate to the
nucleus and be activated [reviewed by [19]]. This would
provide the opportunity to test the ability of the DEX acti-
vated GI-GR fusion protein to rescue the late flowering gi-
2 phenotype and induce gene expression.
Four independent, homozygous, single-locus insertion
lines of 35S::GI-GR gi-2, named TG1 to TG4, were gener-
ated and used for further work. As expected from a trans-
gene expressed from the 35S promoter, total GI transcript
accumulated to higher levels in all four TG lines compared
to Col plants (Figure 1a). To test if the 35S::GI-GR con-
struct was functional, groups of TG, Col and gi-2 mutant
plants were grown in LD conditions and watered either
with DEX (+DEX) or control solutions (-DEX). DEX appli-
cation started at seed imbibition and was repeated every 3
to 4 days after that. Photographs of 41 day old plants
showed that +DEX TG plants had well-developed inflores-
cences, but like gi-2 plants, the -DEX TG plants showed no
sign of flowering (Figure 1b). This indicated that DEX
induction of the GI-GR fusion protein in the TG lines res-
cued the late flowering gi-2 mutant phenotype.
Flowering time was measured by analyzing leaf number
and by counting the days from germination to flowering.
The TG lines flowered earlier in the presence of DEX than
in its absence using either method (Figure 2a to 2c). The
results from graphing leaf counts over time demonstrated
that TG and control plants produce leaves at a similar rate
as the control plants in all treatments before flowering
(Figure 2c), while the flowering time of Col and gi-2
mutant plants was not affected by DEX application (Fig-
ure 2a to 2c).
Figure 2a shows the total leaf number at the time of flow-
ering in the presence or absence of DEX. Following DEX
application, all the TG plants flowered much earlier than
non-treated plants. The +DEX TG plants flowered with an
average of 20.2 leaves +/- SD 2.9 while the -DEX TG plants
flowered much later with an average of 55 leaves +/- SD
7.8. This is comparable to Col wild type plants which
flowered with 16.1 leaves +/- SD 2.9 and gi-2 mutant
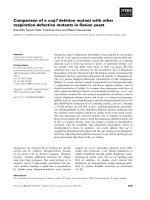
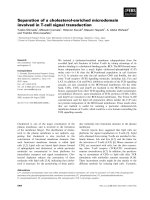
GI expression and flowering time phenotype in transgenic (TG) and control Arabidopsis plants under long day condi-tions in response to application of the steroid dexametha-sone (DEX)Figure 1
GI expression and flowering time phenotype in trans-
genic (TG) and control Arabidopsis plants under long
day conditions in response to application of the ster-
oid dexamethasone (DEX). a) GI transcript accumulation
was measured using qRT-PCR. Relative transcript abundance
10 h after lights on is shown with levels normalised to
ACTIN2 (mean +/- SD of 2 qRT-PCR runs is shown). b) Pho-
tographs of 41 day old TG2 and control plants (Col and gi-2
mutant plants) treated with DEX (+DEX) or control solu-
tions (-DEX) from the time of imbibition. The pink dots on
the leaves were made to assist with leaf counts.
0
0.5
1
1.5
2
2.5
3
3.5
4
Col TG1 TG2 TG3 TG4
Relative
GI
expression
a)
b)
BMC Plant Biology 2009, 9:141 />Page 4 of 13
(page number not for citation purposes)
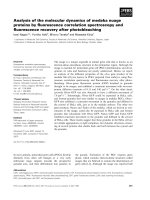
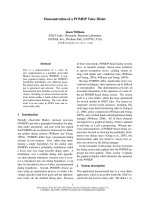
Figure 2
Flowering time measurements in transgenic (TG) and control Arabidopsis plants under long day conditions in
response to application of the steroid Dexamethasone (DEX). a-c) Plants were treated with DEX (+DEX) or
control solutions (-DEX) from the time of imbibition. n = 10-12. a) Total number of leaves (rosette + cauline)
at flowering. The data is presented as mean +/-SD. b) Percentage of plants showing visible floral buds and c)
number of leaves developed during the life cycle. For b) and c), the data from the four TG lines is presented as
mean +/- SD. d) TG2 plants were treated with DEX or control solutions every 4 days from the days shown and
total numbers of leaves at the time of flowering were counted. The data is presented as mean+/-t.se; p = 0.05,
n = 4-9. The flowering time of wild type Col plants is shown for comparison.
0
10
20
30
40
50
60
70
80
TG1 TG2 TG3 TG4 Col gi-2
Leaf number at flowering
+DEX
-DEX
a)
0
10
20
30
40
50
60
70
80
90
100
13 33 53 73 93 113
Days
Plants with floral bud (%)
TG +DEX
TG -DEX
Col
gi-2
b)
0
10
20
30
40
50
60
70
80
10 30 50 70 90
Days
Number of leaves
TG +DEX
TG -DEX
Col
gi-2
c)
11
13
15
17
19
21
23
25
-1012345678910111213
Plant age (days) at first DEX application
Leaf number at flowering
d)
Col flowering
gi-2
gi-2
gi-2
TG2
BMC Plant Biology 2009, 9:141 />Page 5 of 13
(page number not for citation purposes)
plants which flowered at 67.3 +/- SD 6.4 leaves respec-
tively.
One exception was the -DEX TG1 plant group which flow-
ered with 44.9 +/- SD 5.5 leaves indicating some "leaki-
ness" in the control of flowering by the 35S::GI-GR
construct in this transgenic line. This was unexpected as
qRT-PCR of GI transcript levels (Figure 1a) indicated that
GI transcript accumulated to a similar level in TG1 and
TG2. It is possible that this difference between the two TG
lines might be due to a slight change in the GR portion of
the fusion protein that occurred only in the TG1 trans-
genic plant. This may have led to it being retained less well
in the cytoplasm in the absence of DEX in these plants.
The sub-cellular location of the GI-GR fusions could be
analysed using western blotting on plant sub-cellular frac-
tions. Unfortunately, antibodies we raised to the GI pro-
tein did not detect GI in plant extracts and a commercial
antibody could not be located that would detect the GR
portion in immunoblotting.
Figure 2b presents the results of the days-to-flowering
measurement carried out on four TG lines and control
plants. The earliest flowering group consisted of +/-DEX
Col plants and more than 50% of these had flowered by
23 days. Shortly afterwards, the second group started to
develop flowers. This group consisted of the TG plants
treated with DEX; more than 50% of these plants had
flowered by 27 days. The third group consisted of plants
from the +/-DEX treatments of the gi-2 mutant and of the
-DEX TG lines; more than 50% of these had flowered at 50
days. These groupings are similar to those seen from the
leaf counts (Figure 2a).
In order to gain insight into when the TG lines first
became responsive to DEX, groups of TG2 plants were
grown in LD conditions and sprayed with DEX every 4
days starting with the first group where seeds were
imbibed with DEX (day 0) and the last group treated from
12 days old (Figure 2d). Flowering time measurements
showed that plants sprayed from day 12 onwards (flower-
ing at an average of 22.2 leaves +/- t.se 1.2; p 0.05) were
significantly later flowering than day 0 plants (18.8 leaves
+/- t.se 1.9; p 0.05) (Figure 2d). This indicated that the
TG2 plants were responsive to DEX within the first 8-12
days of development. In another experiment with the TG2
line, we obtained similar results and found that plants
remained sensitive to DEX even when it was first applied
to much older plants - at 24 days-old, an age by which
wild type Col plants would have flowered (Figure 2b).
These +DEX TG plants flowered with an average of 39.3
leaves +/- SD 2.1 compared to the -DEX controls which
flowered at 66.2 leaves +/- SD 18.
Induction of flowering gene expression in the transgenic
lines 28 h after DEX application
Since DEX treatments led to a dramatic reduction in flow-
ering time of the 35S::GI-GR gi-2 mutant plants, we
expected that potent flowering time activators such as FT
would be induced by DEX application. In order to begin
to investigate the effect of DEX induction of GI activity on
gene expression in floral inductive LD, we used quantita-
tive Reverse Transcriptase RT-PCR (qRT-PCR) to measure
the effect on known GI downstream flowering-time genes,
CO, FT and SOC1. Fifteen day-old plants from all four of
the TG lines and controls grown in LD on agar plates were
treated with DEX and then harvested 28 h later, 15 hours
after lights on, during the late afternoon (ZT15) on Day 2
(Figure 3).
The selection of this growth regime and harvest time was
an important consideration. First, as we were interested in
the promotive effects of GI on flowering, we carried out
the experiments in LD. Second, previous work had shown
that both FT and CO gene expression cycles with high
points late in the light period of LD [14]. Third, plants
constitutively over-expressing GI had higher CO transcript
levels throughout the day/night cycle, while they retained
cyclical FT expression [5]. Thus, once the GI-GR fusion
had been activated by DEX, it was expected that CO
expression would be able to be analyzed at any time dur-
ing the day/night cycle, and FT expression during the
afternoon. By applying DEX at ZT11 on Day 1, when GI
protein levels normally peak in wild type plants [15], we
reasoned that we would be exposing the plants to the
effects of GI activation both on Days 1 and 2, thus maxi-
mizing the gene expression response by ZT15 on Day 2.
The response of FT expression to 28 h DEX application
was the strongest of the three genes (Figure 3b). The
increase ranged from 2.9 to 10.1 fold. Two of the +DEX
TG lines had FT levels as high as the -DEX Col plants. The
gi-2 mutant expressed FT at 0.14 and 0.03× the level of
Col plants at ZT11 and ZT15 (-DEX) respectively. Levels of
FT were higher in the -DEX TG lines than in the gi-2
mutant (up to 14.2× higher), indicating some leakiness in
the function of the gene construct, but still less than the
levels observed in Col plants (0.15 to 0.5× Col levels at
ZT15, -DEX). The good level of DEX induction of FT tran-
script accumulation was consistent with the acceleration
of flowering in TG lines treated with DEX (Figure 1 and 2).
In three of the +DEX TG lines, CO expression rose weakly
(1.4× to 1.6×), while the fourth line showed a more dra-
matic boost with an increase of 7.5× over the -DEX con-
trols (Figure 3a). CO expression in the +DEX TG lines was
higher than in Col plants at ZT15 in all cases. However, we
observed high background CO gene expression in -DEX
TG plants; the gi-2 mutant expressed CO at 0.2 and 0.3×
BMC Plant Biology 2009, 9:141 />Page 6 of 13
(page number not for citation purposes)
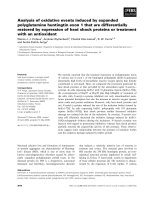
Figure 3
Analysis of transcript abundance of flowering-time genes in transgenic (TG) and control Arabidopsis plants in
long day conditions 28 h after DEX application. a) CO b) FT c) SOC1. Relative transcript accumulation is shown
at ZT 11 just prior to DEX application and at ZT15 on Day 2, 28 h after DEX was applied to 15 day-old plants
growing on agar plates in LD. Plants were treated with DEX (+DEX) or control solutions (-DEX). Transcript
abundance was quantified using qRT-PCR and expression levels were normalised to ACTIN2. The data is pre-
sented as mean +/- SD of 2 qRT-PCR runs. The black bars on the harvest scheme indicate night, the open bars
indicates day and the grey bar indicates the length of treatment with DEX or control solutions, ZT0 is lights
on.
0
0.5
1
1.5
2
2.5
3
3.5
4
4.5
5
Col
gi-2
TG1
TG2
TG3
TG4
Col
gi-2
TG1
TG2
TG3
TG4
Col
gi-2
TG1
TG2
TG3
TG4
Day 1 ZT 11 Day 2 ZT 15 -DEX Day 2 ZT 15 +DEX
Relative CO expression
a)
0
0.5
1
1.5
2
2.5
Col
gi-2
TG1
TG2
TG3
TG4
Col
gi-2
TG1
TG2
TG3
TG4
Col
gi-2
TG1
TG2
TG3
TG4
Day 1 ZT 11 Day 2 ZT 15 -DEX Day 2 ZT 15 +DEX
Relative FT expression
b)
0
0.5
1
1.5
2
2.5
3
3.5
4
4.5
5
Col
gi-2
TG1
TG2
TG3
TG4
Col
gi-2
TG1
TG2
TG3
TG4
Col
gi-2
TG1
TG2
TG3
TG4
Day 1 ZT 11 Day 2 ZT 15 -DEX Day 2 ZT 15 +DEX
Relative SOC1 expression
c)
ZT 0
Da
y
1
ZT 16
ZT 0
Da
y
2
Harvest 1;DEX application
ZT 16 ZT 0ZT 11 ZT 15
Harvest 2; 28 h DEX
BMC Plant Biology 2009, 9:141 />Page 7 of 13
(page number not for citation purposes)
the level of Col plants at ZT11 and ZT15 (-DEX) respec-
tively, but expression in the -DEX TG plants was higher at
0.4 to 0.9× the level of Col plants. This high level of CO
expression, close to wild type Col levels, was not expected
as it did not correlate with the late flowering observed in
the -DEX TG plants.
Slight differences between +DEX TG and -DEX TG plants
were also observed for SOC1 expression; but there was less
than a two-fold increase in the +DEX lines (1.1 to 1.6×)
(Figure 3c). Background levels of SOC1 expression in the
-DEX TG plants were high as they were similar to Col
plants at ZT15. Even higher background levels were
observed at ZT11. At this time point, all the -DEX TG lines
had SOC1 expression that was higher than Col plants. The
gi-2 mutant itself expressed moderate levels of SOC1 at
about 0.5× that of Col plants at ZT11 and ZT15 (-DEX).
This was consistent with previous reports on the effect of
gi mutations on SOC1 expression in whole seedlings
[23,24]. A much greater effect of gi mutations on SOC1
expression in the shoot apex would be expected as there is
strong up regulation of SOC1 in the shoot apex in LD
[23,24], but this would be greatly diluted in our experi-
ments as we examined SOC1 expression in total aerial
parts of young plants.
We also confirmed GI transcript levels in the transgenic
plants were not affected by DEX application. DEX was
applied at ZT8 to 21- day-old TG2 plants grown on agar
plates in LD. QRT-PCR showed that GI transcript levels
were the same in the -DEX/+DEX plants when they were
compared at 4 different time points; 8 h, 16 h, 24 h or 32
h later (data not shown).
Induction of flowering gene expression in the transgenic
lines 8 and 16 h after DEX application
Since the 28 h DEX treatment gave increases in flowering
gene expression, particularly FT, for all TG lines (Figure 3)
the DEX treatment was decreased to gain some insight
into the kinetics of this induction (Figure 4). In this exper-
iment, DEX was sprayed onto plants grown in plant
growth cabinets. This was done to match the gene expres-
sion experiments to the conditions used to measure flow-
ering time and examine if the high background levels of
flowering time gene expression in the -DEX plants (Figure
3) was also observed in plants growing in these non- ster-
ile conditions.
FT expression in the TG lines showed more than a 4-fold
increase in +DEX TG lines 8 h after DEX application com-
pared to -DEX TG plants (Figure 4b). The +DEX TG lines
expressed FT to ~0.4× the level of wild type Col plants 8 h
after DEX was applied. CO expression was increased >3×
after 8 h in both the +DEX TG lines compared to -DEX
treatments and was at a higher level than in Col plants
(Figure 4a). SOC1 expression in both + DEX TG lines was
not increased and it was expressed at a comparable level
to the controls at ZT16 (Figure 4c) indicating that 8 h was
not sufficient to alter SOC1 expression in these condi-
tions.
In the -DEX TG lines, FT transcript levels were less than
0.1× that of wild type Col plants, CO transcript was 0.4×
that detected in Col plants and SOC1 expression was 0.6×
the level of Col plants. Using wild type Col as a calibrator,
it appeared that the background gene expression in the -
DEX TG plants was reduced when plants were grown in
non sterile conditions (Figure 4) compared to on agar
plates (Figure 3).
The spray assay for FT expression was repeated in a time
course where 18 day old plants were sprayed at ZT8 and
harvested 8 h later (ZT16) and 16 h later at ZT24 (Figure
4d). The gi-2 mutant was included to test the level of FT
expression in this mutant when grown in non-sterile con-
ditions and compare it to the -DEX TG plants. After 8 h of
induction (at ZT16) the +DEX TG line showed a 2.6-fold
FT induction over the -DEX TG control. The -DEX TG line
expressed FT at 0.03× the level of Col and 8.5× the level of
gi-2. Thus, the accumulation of FT in the -DEX TG line was
higher than gi-2, but considerably less than observed in
Col plants, consistent with the flowering time data. After
16 h of induction, at ZT0, FT levels in all genotypes tested
were very low. This was expected as FT expression cycled
even when GI was constitutively expressed; ZT0 was a low
point in the FT expression cycle, coming after a period of
darkness when FT accumulation drastically declines due
to the instability of the CO protein during darkness [[5],
reviewed by [13]].
Expression of the putative flowering time gene HAP3A
and the circadian clock gene TOC1 after application of
DEX
Accumulation of transcript of HEME ACTIVATOR PRO-
TEIN 3A (HAP3A) a putative flowering time regulator pro-
posed to be positively regulated by GI [25] and the
circadian clock gene TOC1 was examined. TOC1 tran-
script accumulation was previously proposed as being
positively regulated by GI in a regulatory sub-circuit of the
circadian clock [26].
In plants over expressing GI (35S::GI), HAP3A had been
detected at all time points and at increased levels particu-
larly towards the end of the day, compared to wild type
plants [25]. Therefore, HAP3A expression was analysed
either 28 h after DEX application (at ZT15), or 8 h after
DEX spraying (at ZT 16), in TG and control plants. HAP3A
expression was generally very similar across all genotypes
and treatments (Figure 5). No induction of HAP3A expres-
BMC Plant Biology 2009, 9:141 />Page 8 of 13
(page number not for citation purposes)
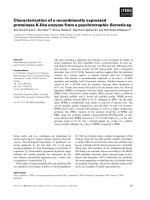
Figure 4
Analysis of transcript abundance of flowering-time genes in transgenic (TG) and control Arabidopsis plants in
long day conditions 8 or 16 h after DEX application. a) CO b) FT c) SOC1. Relative transcript accumulation is
shown 8 h after DEX was sprayed onto 15 day- old plants growing in hydroponic media. Plants were treated
with DEX (+DEX) or control solutions (-DEX) at ZT8 and harvested at ZT16. d) FT transcript accumulation is
shown either 8 h (ZT16) or 16 h (ZT24) after DEX was sprayed onto 18 day-old plants growing in hydroponic
media in LD. Plants were treated with DEX (+DEX) or control solutions (-DEX) at ZT8. Transcript abundance
was quantified using qRT-PCR and expression levels were normalised to ACTIN2. The data is presented as
mean +/- SD of 2 qRT-PCR runs for a and b) and a single run for c). The black bar on the harvest scheme indi-
cates night, the open bar indicates day and the grey bar indicates the length of treatment with DEX or control
solutions, ZT0 is lights on.
ZT 0 ZT 8
Harvest 1
;
8 h
DEX application
ZT 16 ZT 24
Harvest 2
;
16 h
0.0
0.1
Col
gi-2
TG1
Col
gi-2
TG1
Col
gi-2
TG1
Col
gi-2
TG1
ZT 16 -DEX ZT 16 +DEX ZT 24 -DEX ZT 24 +DEX
Relative FT ex
p
0.8
1.0
1.2
1.4
1
.
6
p
ression
d)
0
0.2
0.4
0.6
0.8
1
1.2
1.4
1.6
1.8
2
Col TG1 TG2 Col TG1 TG2
ZT16 -DEX ZT16 +DEX
Relative SOC1 expression
c)
0
1
2
3
4
5
6
7
Col TG1 TG2 Col TG1 TG2
ZT16 -DEX ZT16 +DEX
Relative
FT
expression
b)
0
0.2
0.4
0.6
0.8
1
1.2
1.4
1.6
1.8
Col TG1 TG2 Col TG1 TG2
ZT16 -DEX ZT16 +DEX
Relative
CO
expression
a)
ZT 0 ZT 8
Harvest; 8 h DEX
DEX application
ZT 16 ZT 0
BMC Plant Biology 2009, 9:141 />Page 9 of 13
(page number not for citation purposes)
sion was seen in +DEX TG lines compared to -DEX lines
in either experiment.
Expression of the clock gene TOC1 is circadian regulated
and peaks in the late afternoon [27]. We tested if DEX
application led to induction of TOC1 at ZT15 (28 h after
DEX application) (Figure 6a) or at ZT16 or at ZT 24 (8 h
or 16 h after application of DEX) (Figure 6b). TOC1 was
expressed at higher levels in the evening than at dawn in
wild type Col plants as expected (Figure 6b). This pattern
was seen in all the genotypes including the +DEX TG line,
indicating that DEX induction of GI activity had not
altered the pattern of core-clock gene regulation in LD.
The daily expression pattern of two other core-clock genes
was also not altered by DEX application in this experi-
ment (data not shown). TOC1 expression was similar
across all genotypes in these experiments. Neither loss of
GI activity in the gi-2 mutant, or induction of GI activity
in the +DEX TG lines resulted in changes to TOC1 expres-
sion compared to Col plants (Figure 6a, b). An experiment
was also performed where plants grown in liquid culture
in continuous light were exposed to DEX, but again there
was no change in TOC1 or HAP3A expression after 8, 16
or 24 h of DEX treatment of TG1 and TG2 plants (data not
shown).
Conclusion
DEX application to the TG lines successfully rescued the
late flowering phenotype conferred by the gi-2 mutation.
The induction of GI activity by DEX supports the idea that
GI functions to promote flowering from within the
nucleus as suggested by the work of Sawa et al. [18] and
previously in transient assays when GI-reporter fusion
proteins were observed in the nucleus and a nuclear-local-
isation region was defined [3,18]. Consistent with induc-
tion of flowering by DEX, increased transcript
accumulation of the GI downstream floral promoters CO
and FT was observed in TG plants after 8 h of DEX appli-
cation.
CO has been proposed to trigger expression of FT by inter-
acting with the HAP protein trimeric complex which
binds to promoter CCAAT boxes [25,28]. HAP3A tran-
script levels were observed to increase in GI-over express-
ing transgenic plants, suggesting that GI may regulate
HAP3A [25]. However, no induction of HAP3A was
observed in our TG lines in the experimental time frame
used here suggesting that transcript accumulation of
HAP3A may not be directly regulated by GI.
Modeling and experimental testing of circadian clock
function predicted that GI would fulfill part of a predicted
"Y" function needed to stimulate TOC1 expression in the
interlocking loop model of the circadian clock [26,29].
Experiments with the TG lines show no induction of GI
activity by DEX on TOC1 transcript levels and no reduc-
tion in TOC1 levels in the gi-2 mutant, suggesting that this
gene may not be directly regulated by GI. It is possible that
we missed a transient increase in TOC1 expression. Some
effects of gi mutations on TOC1 transcript accumulation
were reported previously, but these experiments were car-
ried out under very different light or temperature regimes
from this work [6,8].
The TG plants were responsive to DEX induction of GI
within the first 8-12 days of development. However, floral
buds were only visible when the plants were ~27 days-old,
and the +DEX TG plants were slightly later flowering than
wild type Col control plants (Figure 2). The responses of
the GI-GR TG plants to DEX application also were more
modest that seen in 35S::CO-GR plants. The latter
responded to DEX from the time of seed imbibition and
flowered significantly earlier than wild type plants in LD
[20]. This suggests that there was some limitation on the
activity of the GI-GR fusion protein. This contrasts with
work in this laboratory with other epitope-tagged versions
of GI that fully complemented the gi-2 mutant [15].
Unfortunately, we were not able to verify the effect of DEX
on the cellular localization of the GI-GR fusion protein, as
antibodies we raised to the GI protein did not detect GI in
plant protein extracts, and a commercial antibody could
not be located that would detect the GR portion in west-
ern blotting.
An intriguing problem encountered was that despite the -
DEX TG plants being late flowering, there were often very
high levels of expression of GI downstream genes such as
CO in these TG lines compared with the gi-2 mutant. One
explanation is that the leaky expression of genes such as
CO was in tissues that were not competent to respond to
it and thus FT expression and flowering was not strongly
promoted. For example, expression of CO in the compan-
ion cells of the phloem using tissue specific promoters is
highly floral promotive, whereas expression of CO in the
shoot apex does not promote flowering [12,30,31].
In conclusion, the GI-GR system described here was func-
tional in promoting flowering and allowed tests of induc-
tion of putative GI downstream genes. However, given the
leaky gene expression observed and that full activity of GI-
GR was not achieved, development of systems that tightly
regulate the temporal and spatial control of GI transcript
rather than a post translational system may be preferable
in future work. For example, constructs that lead to induc-
tion of GI transcription specifically in the phloem would
be interesting for further study of the effect of GI on flow-
ering time.
BMC Plant Biology 2009, 9:141 />Page 10 of 13
(page number not for citation purposes)
Analysis of transcript abundance of the putative flowering-time gene HAP3A in transgenic (TG) and control Arabidopsis plants in long day conditions after DEX applicationFigure 5
Analysis of transcript abundance of the putative flowering-time gene HAP3A in transgenic (TG) and control
Arabidopsis plants in long day conditions after DEX application. a) Relative transcript accumulation is shown at ZT15
on Day 2, 28 h after DEX was applied to 15 day-old plants growing on agar plates in LD. b) Relative transcript accumulation in
TG plants is shown at ZT 16, 8 h after DEX was sprayed onto 15 day-old plants growing in hydroponic media in LD. Plants
were treated with DEX (+DEX) or control solutions (-DEX). Transcript abundance was quantified using qRT-PCR and expres-
sion levels were normalised to At2g32170. The data is presented as mean +/- SD for 3 qRT-PCR replicates. The black bars on
the harvest scheme indicate night, the open bars indicate day and the grey bar indicates the length of treatment with DEX or
control solutions, ZT0 is lights on.
a)
b)
ZT 0 ZT 8
Harvest; 8 h DEX
DEX application
ZT 16 ZT 0
0
0.2
0.4
0.6
0.8
1
1.2
1.4
1.6
1.8
TG1 TG2 TG1 TG2
ZT 16 -DEX ZT 16 +DEX
Relative
HAP3a
expression
ZT 0
Day 1
ZT 16
ZT 0
Day 2
DEX application
ZT 16 ZT 0ZT 11 ZT 15
Harvest; 28 h DEX
0
0.5
1
1.5
2
2.5
3
WT gi-2 TG1 TG2 WT gi-2 TG1 TG2
Day 2 ZT 15 -DEX Day 2 ZT 15 +DEX
Relative HAP3a expression
Methods
Plant material, growth and treatments
All plant material used in this work was derived from the
Arabidopsis thaliana L. Heynh ecotype Columbia (Col).
The gi-2 mutant has been described previously [2]. Plants
were grown under long-day conditions (16 h light/8 h
dark) in controlled growth cabinets in 100 - 110 μM m
-2
s
-1
fluorescent light at 22°C. For flowering time analyses,
plants were grown in soil or rockwool blocks moistened
with hydroponics media [[32], without Na
2
SiO
3
] and
watered every 3-4 days with 10 μM DEX 0.01% (w/v)
Tween-20 or control solution, or sprayed with 30 μM DEX
0.01% (w/v) Tween-20 or control solution. Leaves were
counted every 2-3 days and the time when plants were
bolting was recorded. To establish the responsiveness of
transgenic plants (TG) plants to dexamethasone (DEX),
30 μM DEX 0.01% (w/v) Tween-20 was first sprayed at 4,
8 or 12 days after germination (seeds for day 0 treatment
were imbibed with DEX solution) on groups of TG plants
grown on rockwool and thereafter repeated every 4 days
and flowering time was recorded as total leaf number. The
flowering time experiments were repeated with similar
results.
BMC Plant Biology 2009, 9:141 />Page 11 of 13
(page number not for citation purposes)
Analysis of transcript abundance of the TOC1 circadian clock gene in transgenic (TG) and control Arabidopsis plants in long day conditions after DEX applicationFigure 6
Analysis of transcript abundance of the TOC1 circadian clock gene in transgenic (TG) and control Arabidopsis
plants in long day conditions after DEX application. a) Relative TOC1 transcript accumulation is shown at ZT15 on Day
2, 28 h after DEX was applied to 15 day-old plants growing on agar plates in LD. b) Relative transcript accumulation is shown
either 8 h (ZT16) or 16 h (ZT24) after DEX was sprayed onto plants growing in hydroponic media in LD. Plants were treated
with DEX (+DEX) or control solutions (-DEX). Transcript levels were normalised to At2g32170 in a) or ACTIN2 in b). The
data is presented as mean +/- SD for 3 qRT-PCR replicates. The black bars on the harvest scheme indicate night, the open bars
indicate day and the grey bar indicates the length of treatment with DEX or control solutions, ZT0 is lights on.
0
0.2
0.4
0.6
0.8
1
1.2
1.4
1.6
WT gi-2 TG1 TG2 WT gi-2 TG1 TG2
Day 2 ZT 15 -DEX Day 2 ZT 15 +DEX
Relative
TOC1
expression
0.0
0.2
0.4
0.6
0.8
1.0
1
.
2
Col
gi-2
TG1
Col
gi-2
TG1
Col
gi-2
TG1
Col
gi-2
TG1
ZT 16 -DEX ZT 16 +DEX ZT 24 -DEX ZT 24 +DEX
Relative
TOC1
expression
ZT 0
Day 1
ZT 16
ZT 0
Day 2
DEX application
ZT 16 ZT 0ZT 11 ZT 15
Harvest; 28 h DEX
a)
b)
ZT 0 ZT 8
Harvest 1; 8 h DEX DEX application
ZT 16 ZT 24
Harvest 2; 16 h DEX
For gene expression measurements, seeds were surface-
sterilised and grown for 2-3 weeks on MS media agar
plates [33] or on rockwool blocks saturated with hydro-
ponic media. Plants grown on MS agar were wet with 30
ml 10 μM DEX 0.01% (w/v) Tween-20 solution or control
solution (plate assay), while those grown on rockwool
were sprayed with 30 μM DEX 0.01% (w/v) Tween-20
solution or control solution (spray assay). For both treat-
ments, DEX was applied 2-3 weeks after germination and
plant tissue was harvested before and after DEX treatment.
The gene expression experiments were repeated on inde-
pendently grown plants and similar results were obtained.
Plasmids and plant transformation
The coding region of the ligand binding domain from the
rat glucocorticoid receptor (GR) was fused to the 3'-end of
the full length GI cDNA driven by the CaMV 35S pro-
moter (35S::GI-GR). Details of the cloning procedure can
be obtained from the authors. The construct was trans-
formed into the gi-2 mutant background and kanamycin-
resistant transformants selected. Four independent
homozygous, single copy, transformed lines were used for
further work. The presence and identity of the GI-GR gene
fusion junction was confirmed in all 4 TG lines by PCR
and DNA sequencing.
BMC Plant Biology 2009, 9:141 />Page 12 of 13
(page number not for citation purposes)
RNA extraction, cDNA synthesis and qRT-PCR
For gene expression experiments RNA was extracted from
50 - 100 mg plant tissue using the RNeasy
®
Plant Mini Kit
(Qiagen) and a DNase on-column treatment was carried
out during RNA extraction. RNA quality and quantity was
confirmed using RNA Nano Labchips (Agilent Incorp.)
analyzed on an Agilent 2100 Bioanalyzer. One-two micro-
grams total RNA was transcribed into cDNA with Super-
script III reverse transcriptase (Invitrogen) according to
the manufacturer using a (dT)
17
primer (5'-GACTC-
GAGTCGACATCGATTTTTTTTTTTTTTTTT-3'). As a control
for potential genomic DNA contamination the same pro-
cedure was carried out omitting the reverse transcriptase.
To determine relative gene expression levels using quanti-
tative Real Time PCR (qRT-PCR), 1 μl cDNA was used in a
total reaction volume of 10 μl 1× SYBR
®
Green PCR Master
Mix (Applied Biosystems) with final primer concentra-
tions of 0.5 μM. Each cDNA sample was analysed in trip-
licate qRT-PCR reactions, either once or twice, on a 7900
HT Sequence Detection system (Applied Biosystems). Rel-
ative gene expression levels were calculated using the 2
-
ΔΔCT
method [34]. The gene expression experiments were
repeated on independently grown plants and similar
results were obtained.
Primers used for qRT-PCR
Primers that were used for quantification of gene expres-
sion levels were tested for amplification efficiency prior to
use with a dilution series of an arbitrary cDNA sample.
The following primer pairs were used for qRT-PCR; 5'-
TTGCAACTCCAAGTGCTACG-3' and 5'-GCTCGAAG-
GAGTTCCACAAG-3' for GI, 5'-ACTGGTGGTGGATCAA-
GAGG-3' and 5'-GAATTAGGGAACAGCCACGA-3' for
CO, 5'-CTGGAACAACCTTTGGCA AT-3' and 5'-TACACT-
GTTTGCCTGCCAAG-3' for FT, 5'-CGAAAGCTTCCTCCT-
GGTTA-3' and 5'-GAGTTTTGCCCCTCACCATA-3' for
SOC1, 5'-GATTCCACGAGTTTGGGAGA-3' and 5'-CCT-
TAGCCATTGGGAGATCA-3' for TOC1, 5'-GCGTT-
GCCTCCTAATGGTAA-3' and 5'-
ACCCTCCAACTCCCTGTACC-3' for HAP3A, 5'-
TGCTTTTTCATCGACACTGC-3' and 5'-CCATATGTGTC-
CGCAAAATG-3' for At2g32170, 5'-CTCTCCCGCTATG-
TATGTCGCCA-3' and 5'-GTGAGACACACCATCACCAG-
3' for ACT2.
Authors' contributions
MG carried out flowering time experiments and gene
expression experiments, drew the figures and helped write
the manuscript, EFL carried out gene expression experi-
ments, KD helped to produce and test the transgenic lines
and to criticize the manuscript, JP conceived of the study,
supervised the overall project and wrote the manuscript.
All authors read and approved the final manuscript.
Acknowledgements
We thank Robert Schaffer for his insightful comments on the manuscript
and Hong Liu, Chin-Chin Yeoh, Frances Ikin and Nga Tama for their tech-
nical assistance.
References
1. Koornneef M, Hanhart CJ, Veen JH Van der: A genetic and physi-
ological analysis of late flowering mutants in Arabidopsis thal-
iana. Molecular and General Genetics 1991, 229:57-66.
2. Fowler S, Lee K, Onouchi H, Samach A, Richardson K, Coupland G,
Putterill J: GIGANTEA: a circadian clock-controlled gene that
regulates photoperiodic flowering in Arabidopsis and encodes
a protein with several possible membrane-spanning
domains. EMBO Journal 1999, 18(17):4679-4688.
3. Huq E, Tepperman JM, Quail PH: GIGANTEA is a nuclear pro-
tein involved in phytochrome signaling in Arabidopsis. Pro-
ceedings of the National Academy of Sciences of the United States of
America 2000, 97(17):9789-9794.
4. Oliverio KA, Crepy M, Martin-Tryon EL, Milich R, Harmer SL,
Putterill J, Yanovsky MJ, Casal JJ: GIGANTEA regulates phyto-
chrome A-mediated photomorphogenesis independently of
its role in the circadian clock. Plant Physiology 2007,
144(1):495-502.
5. Mizoguchi T, Wright L, Fujiwara S, Cremer F, Lee K, Onouchi H,
Mouradov A, Fowler S, Kamada H, Putterill J, et al.: Distinct roles of
GIGANTEA in promoting flowering and plant circadian
rhythms in Arabidopsis. Plant Cell 2005, 17:2255-2270.
6. Martin-Tryon E, Kreps J, Harmer S: GIGANTEA acts in blue light
signaling and has biochemically separable roles in circadian
clock and flowering time regulation. Plant Physiology 2007,
143:473-486.
7. Park DH, Somers DE, Kim YS, Choy YH, Lim HK, Soh MS, Kim HJ,
Kay SA, Nam HG: Control of circadian rhythms and photope-
riodic flowering by the Arabidopsis GIGANTEA gene. Science
1999, 285(5433):1579-1582.
8. Gould P, Locke J, Larue C, Southern M, Davis S, Hanano S, Moyle R,
Milich R, Putterill J, Millar A, et al.: The molecular basis of tem-
perature compensation in the Arabidopsis circadian clock.
The Plant Cell 2006, 18:1177-1187.
9. Kim WY, Fujiwara S, Suh SS, Kim J, Kim Y, Han LQ, David K, Putterill
J, Nam HG, Somers DE: ZEITLUPE is a circadian photorecep-
tor stabilized by GIGANTEA in blue light. Nature 2007,
449(7160):356-360.
10. Alabadi D, Oyama T, Yanovsky MJ, Harmon FG, Mas P, Kay SA:
Reciprocal regulation between TOC1 and LHY/CCA1 within
the Arabidopsis circadian clock. Science 2001,
293(5531):880-883.
11. Putterill J, Laurie R, Macknight R: It's time to flower: the genetic
control of flowering time. BioEssays 2004, 26:363-373.
12. Kobayashi Y, Weigel D: Move on up, it's time for change mobile
- signals controlling photoperiod-dependent flowering. Genes
& Development 2007, 21(19):2371-2384.
13. Searle I, Coupland G: Induction of flowering by seasonal
changes in photoperiod. Embo Journal 2004, 23(6):1217-1222.
14. Suarez-Lopez P, Wheatley K, Robson F, Onouchi H, Valverde F, Cou-
pland G: CONSTANS mediates between the circadian clock
and the control of flowering in Arabidopsis. Nature 2001,
410(6832):1116-1120.
15. David KM, Armbruster U, Tama N, Putterill J: Arabidopsis
GIGANTEA protein is post-transcriptionally regulated by
light and dark. Febs Letters 2006, 580(5):1193-1197.
16. Imaizumi T, Tran HG, Swartz TE, Briggs WR, Kay SA: FKF1 is essen-
tial for photoperiodic-specific light signalling in Arabidopsis.
Nature 2003, 426:302-306.
17. Imaizumi T, Schultz T, Harmon F, Ho L, Kay S: FKF1 F-box protein
mediates cyclic degradation of a repressor of CONSTANS in
Arabidopsis. Science 2005, 309:293-297.
18. Sawa M, Nusinow DA, Kay SA, Imaizumi T: FKF1 and GIGANTEA
complex formation is required for day-length measurement
in Arabidopsis. Science 2007, 318(5848):261-265.
19. Padidam M: Chemically regulated gene expression in plants.
Current Opinion in Plant Biology 2003, 6(2):169-177.
20. Simon R, Igeno MI, Coupland G: Activation of floral meristem
identity genes in Arabidopsis. Nature 1996, 384(6604):59-62.
Publish with BioMed Central and every
scientist can read your work free of charge
"BioMed Central will be the most significant development for
disseminating the results of biomedical research in our lifetime."
Sir Paul Nurse, Cancer Research UK
Your research papers will be:
available free of charge to the entire biomedical community
peer reviewed and published immediately upon acceptance
cited in PubMed and archived on PubMed Central
yours — you keep the copyright
Submit your manuscript here:
/>BioMedcentral
BMC Plant Biology 2009, 9:141 />Page 13 of 13
(page number not for citation purposes)
21. Samach A, Onouchi H, Gold SE, Ditta GS, Schwarz-Sommer Z, Yanof-
sky MF, Coupland G: Distinct roles of CONSTANS target genes
in reproductive development of Arabidopsis. Science 2000,
288(5471):1613-1616.
22. Yamaguchi A, Kobayashi Y, Goto K, Abe M, Araki T: TWIN SISTER
OF FT (TSF) acts as a floral pathway integrator redundantly
with FT. Plant and Cell Physiology 2005, 46(8):1175-1189.
23. Lee H, Suh SS, Park E, Cho E, Ahn JH, Kim SG, Lee JS, Kwon YM, Lee
I: The AGAMOUS-LIKE 20 MADS domain protein integrates
floral inductive pathways in Arabidopsis. Genes & Development
2000, 14(18):2366-2376.
24. Borner R, Kampmann G, Chandler J, Gleissner R, Wisman E, Apel K,
Melzer S: A MADS domain gene involved in the transition to
flowering in Arabidopsis. Plant Journal 2000, 24(5):591-599.
25. Wenkel S, Turck F, Singer K, Gissot L, Le Gourrierec J, Samach A,
Coupland G: CONSTANS and the CCAAT Box Binding Com-
plex Share a Functionally Important Domain and Interact to
Regulate Flowering of Arabidopsis. Plant Cell 2006,
18(11):2971-2984.
26. Locke J, Southern M, Kozma-Bognár L, Hibberd V, Brown P, Turner
M, Millar A: Extension of a genetic network model by iterative
experimentation and mathematical analysis. Molecular Systems
Biology 2005, 1:13.
27. Strayer C, Oyama T, Schultz TF, Raman R, Somers DE, Mas P, Panda
S, Kreps JA, Kay SA: Cloning of the Arabidopsis clock gene
TOC1, an autoregulatory response regulator homolog. Sci-
ence 2000, 289(5480):768-771.
28. Ben-Naim O, Eshed R, Parnis A, Teper-Bamnolker P, Shalit A, Coup-
land G, Samach A, Lifschitz E: The CCAAT binding factor can
mediate interactions between CONSTANS-like proteins
and DNA. Plant 2006, 46(3):462-476.
29. Locke JCW, Kozma-Bognar L, Gould PD, Feher B, Kevei E, Nagy F,
Turner MS, Hall A, Millar AJ: Experimental validation of a pre-
dicted feedback loop in the multi-oscillator clock of
Arabi-
dopsis thaliana. Molecular Systems Biology 2006, 2:59.
30. An HL, Roussot C, Suarez-Lopez P, Corbesler L, Vincent C, Pineiro
M, Hepworth S, Mouradov A, Justin S, Turnbull C, et al.: CON-
STANS acts in the phloem to regulate a systemic signal that
induces photoperiodic flowering of Arabidopsis. Development
2004, 131(15):3615-3626.
31. Ayre BG, Turgeon R: Graft transmission of a floral stimulant
derived from CONSTANS. Plant Physiology 2004,
135(4):2271-2278.
32. Gibeaut DM, Hulett J, Cramer GR, Seemann JR: Maximal biomass
of Arabidopsis thaliana using a simple, low-maintenance
hydroponic method and favorable environmental condi-
tions. Plant Physiology 1997, 115:317-319.
33. Murashige T, Skoog F: A revised medium for rapid growth and
bio assays with tobacco tissue cultures. Physiologica Plantarum
1962, 15:473-497.
34. Livak KJ, Schmittgen TD: Analysis of relative gene expression
data using real-time quantitative PCR and the 2
ΔΔCT
method.
Methods 2001, 25:402-408.