báo cáo khoa học: " Validation of reference genes for quantitative real-time PCR during leaf and flower development in Petunia hybrida" pot
Bạn đang xem bản rút gọn của tài liệu. Xem và tải ngay bản đầy đủ của tài liệu tại đây (649.64 KB, 11 trang )
RESEARC H ARTIC LE Open Access
Validation of reference genes for quantitative
real-time PCR during leaf and flower
development in Petunia hybrida
Izaskun Mallona
1
, Sandra Lischewski
2
, Julia Weiss
1
, Bettina Hause
2
, Marcos Egea-Cortines
1*
Abstract
Background: Identification of genes with invariant levels of gene expression is a prerequisite for validating
transcriptomic changes accompanying development. Ideally expression of these genes should be independent of
the morphogenetic process or environmental condition tested as well as the methods used for RNA purification
and analysis.
Results: In an effort to identify endogenous genes meeting these criteria nine reference genes (RG) were tested in
two Petuni a lines (Mitchell and V30). Growth conditions differed in Mitchell and V30, and different methods were
used for RNA isolation and analysis. Four different software tools were employed to analyze the data. We merged
the four outputs by means of a non-weighted unsupervised rank aggregation method. The genes identified as
optimal for transcriptomic analysis of Mitchell and V30 were EF1a in Mitchell and CYP in V30, whereas the least
suitable gene was GAPDH in both lines.
Conclusions: The least adequate gene turned out to be GAPDH indicating that it should be rejected as reference
gene in Petunia. The absence of correspondence of the best-suited genes suggests that assessing reference gene
stability is needed when performing normaliza tion of data from transcriptomic analysis of flower and leaf
development.
Background
The general aims of transcriptomic analysis are identifi-
cation of genes differentially expressed and measure ment
oftherelativelevelsoftheirtranscripts. Transcriptomic
analysis like that relying on microarray techniques reveals
an underlying expression dynamic that changes between
tissues and over time [1]. Results must then be validated
by other means in order to obtain robust data that will
support w orking hypotheses directed at a better under-
standing of development or environmental responsive-
ness. Since the advent of qu antitative PCR, it has become
the method of choice to validate gene expression data.
However, data obtained by qPCR can be strongly affected
by the properties of the starting material, RNA extraction
procedures, and cDNA synthesis. Therefore, relative
quantification procedures require comparison of the
gene of interest to an internal control, based on a
normalization factor derived from one or more genes
that can be argued to be equally active in the relevant cell
types. This requires the previous identification of such
genes, which can then be reliably used to normali se rela-
tive expression of genes of interest.
Identification of candidate genes useful for normaliza-
tion has become a major task, as it has been shown that
normalization errors are probably the most common
mistake, result ing in significant artefacts that can lead to
erroneous conclusions [2]. Several softw are tools have
been developed to compute relative levels of specific
transcripts (commonly referred to as ‘gene expression’,
although obviously transcript stability is also an impor-
tant factor contributing to transcript levels) based on
group-wise comparisons between a gene of interest and
another endogenous gene [3]. However identification of
genes with stable patterns of gene expression requires
pairwise testing of several genes with each other.
Among the software programs developed toward this
end are geNorm [4], BestKeeper [5], NormFinder [6] or
* Correspondence:
1
Genetics, Instituto de Biotecnología Vegetal, Universidad Politécnica
de Cartagena (UPCT), 30203 Cartagena, Spain
Mallona et al. BMC Plant Biology 2010, 10:4
/>© 2010 Mallona et al; licensee BioMed Central Ltd. This is an Open Access article distributed under the terms of the Creative C ommons
Attribution License (http://creativecommons.o rg/ licenses/by/2.0), which permits unrestricted use, distribution, and reproduction in
any medium, provided the orig inal work i s properly cited.
qBasePlus [7]. The programs geNorm and qBasePlus use
pairwise comparison s and geometric averaging across a
matrix of reference genes. qBasePlus also calculates a
coefficient of variation (CV) for each gene as a stability
measurement. BestKeeper uses pairwise correlation ana-
lysis o f each internal gene to an optimal normalization
factor that merges data from all of them. Finally, Norm-
Finder fits data to a mathematical model, which allows
comparison of intra- and intergroup variation and calcu-
lation of expression stability.
Using the programs described above researchers have
identified genes suitable for use as normalization con-
trols in Arabidopsis [8], rice [9], potato leaves [10], the
parasitic plant Orobanche ramosa [11], Brachypodium
distachyon [12] and grape [13]. In the Solanaceae, candi-
date genes for normalization have been determined
based on EST abundance [14], and qPCR followed by
statistical analysis using the tools described above have
been reported [15].
A feature shared amongst these studies, and a large
number of additional public ations describing human,
animal and plant systems, is the identification of genes
specific for a certain tissue, developmental stage or
environmental condition. This is a logical e xperimental
design, as individual research programs tend to be
focused, and the number of appropriate genes can be
expected to be inversely related to the number of cell
types or conditions under investigation. Recent studies
that included different cultivars of soybean [16], under-
score how the characteristics of the plant and the types
of organs studied must drive the experimental approach
to transcriptomic analysis.
The garden Petunia ( Petunia hybrida) has been exten-
sively used as a model for developmental biology
[17,18]. Amongst the inbred Petunia lines used in
research, the white-flowered Mitchell [19], also known
as W115, is routinely exploited for transformation and
scent studies [20-22]. The genetics of flower pigmenta-
tion has been intensively studied in lines such as V30
[23]. Mitchell and V30 are genetically dissimilar, as
demonstrated in mapping studies, and vary in a nu mber
of other ways, including growth habit and amenability
to propagation in culture. Here we have used multiple
developmental stages of flowers and leaves of these two
Petunia lines to identify genes that show re liable robust-
ness as candidates for use in normalization of relative
transcript abundance. The experiments were carried out
in two differ ent laboratories, with different PCR
machines and different purification and amplification
conditions. We found that the final shortlist of valuable
genes was different between lines suggesting the neces-
sity of performing reference gene stability measurements
as part of the experimental design where differences in
gene expression in Petunia is tested.
Results
(1948 w)
Petunia lines, developmental stages and selection
of genes for normalization
Two very different Petunia lines were used for the ana-
lyses. Mitchell , also known as W115, is a doubled hap-
loid line obtained from anther culture of an interspecific
Petunia hybrid [19]; it is characterized by vigorous
growth, exceptional fertility, strong fragrance and white
flowers. V30 is an inbred line of modest growth habit
and fertility featuring deep purple petals and pollen.
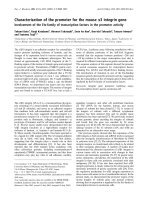
From each line we harvested flowers representing four
developmental stages, from young flower buds to open
flowers shortly before anthesis, and tw o leaf develop-
mental stages, young and full-sized (Figure 1).
Potentially useful RG were selected based on review of
the relevant litera ture, from which we identified genes
previously used for normalization or routinely used as
controls for northern blots or RT-PCR. From the origi-
nal list we developed a short list of nine, including
genes encoding Actin-11 (ACT), Cyclophilin-2 (CYP)
[10], Elongation factor 1a (EF1a), Ubiqui tin (UBQ) Gly-
ceraldehyde-3-phosphate dehydrogenase (GAPDH), GTP-
binding p rotein RAN1 (RAN1), SAND protein (SAND)
[8,24,25], Ribosomal protein S13 (RPS13 )[6]and
b-Tubulin 6(TUB)[26](Table1).Theproductsof
these genes are associated with a wide variety of biologi-
cal functions. Moreover, these genes are described as
not co-regulated, a prerequisite for using one of the
algorithms to identify stably expressed genes (geNorm)
reliably [4].
Strategy for data mining and statistical analysis
The genes described above were selected to test for sta-
bility of transcript levels through leaf and flower devel-
opment in two Petunia lines, Mitchell and V30. As the
aim of the present work is to find i f we could obtain a
similar rank of genes irrespective of the Petunia line,
growth conditions or sample processing, we developed
all the data mining procedures separately for each line.
Cycle threshold (CT) values were determined and
expression stability, i.e., the constancy of transcript
levels, ranked. As a strategy for calculating relative
expression quantities (RQ) we applied the qBasePlus
software, taking into account for eac h reaction its speci-
fic PCR efficiency. Rescaling of normalized quantities
employed the sample with the lowest CT value (see
materials and methods and Figure 2). With qBasePlus
we measured expression stability (M values) and coeffi-
cients of variation (CV values). Relative quantities were
transferred to geNorm for computing M stability values.
It is worth noting that the procedure for computing M
values differs between geNorm and qBasePlus. Finally,
we used the combined stability measurements produced
by geNorm, NormFinder, BestKeeper and qBasePlus to
Mallona et al. BMC Plant Biology 2010, 10:4
/>Page 2 of 11
establish a consensus rank of genes by applying Ran-
kAggre g [27]. T he input to this statistical package was a
matrix of rank-ordered genes according to the different
stability measurements previously computed. RankAg-
greg calculated Spearman footrule distances and the
software reformatted this distance matrix into an
ordered list that matched each inital order as closely as
possible This consensus rank list was obtained by means
of the Cross-Entropy Monte Carlo algorithm present in
the software.
CT values and variability between organs and
developmental stages in Mitchell and V30
Real-time PCR reactions were performed on the six
cDNA samples obtained from each Petunia line with the
nine primer pairs representing the candidate RG. In
order to assess run reliability non-template controls
were added and three technical repetitions were
included for each biological replicate. CT values were
defined as the number of cycles required for normalized
fluorescence to reach a manually set threshold of 20%
total fluorescence. Product melting analysis and/or gel
electrophoresis allowed for the discarding of non-speci-
fic products. Moreover, we considered only CT technical
repetitions differing by less than one cycle.
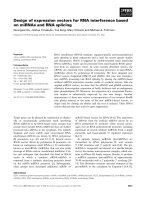
The CT values obtained for all the genes under study
differed between the two Petunia lines (Figure 3). The
range of values was consistently narrower in Mitchell
than in V30. This could indicate that gene expression in
general is less variable in Mitchell than in V30, however
these data correspond to averages derived from all the
samples and further analysis showed that in fact V30
exhibited more constant levels of tested transcripts at
the single organ level or developmental stage (see
below).
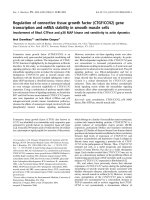
For Mitchell samples UBQ was the most highly
expressed gene overall, with a CT of 14.8, and SAND
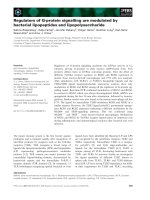
Figure 1 Deve lopmental stages o f leaves a nd flowers used for R NA extractions. Repr esentativ e photographs of leav es and flowers of
Petunia hybrida lines Mitchell (a, c) and V30 (b, d) are shown. The leaf stages are young, small leaf (leaf of the left in a, b) and fully expanded
leaf (leaf of the right in a, b). Flowers at four different developmental stages are shown (c, d). From left to right they range from young flower
bud (stage A, 1-1.5 cm), over-elongated bud (stage B, 2.5-3 cm) and pre-anthesis (stage C, 3.5-4.5 cm) to fully developed flower (stage D, open
flower).
Table 1 Genes, primers and amplicon characteristics
Gene
name
Molecular function Accesion Tblastx
e-value
Primer sequences
(forward/reverse)
Length
(bp)
Efficiency
ACT Actin 11 SGN-U208507 (At3 g12110.1) 2e-110 TGCACTCCCACATGCTATCCT/
TCAGCCGAAGTGGTGAAAGAG
114 1.75 ± 0.07
CYP Cyclophilin SGN-U207595 (At2 g21130.1) 1.9e-75 AGGCTCATCATTCCACCGTGT/
TCATCTGCGAACTTAGCACCG
111 1.64 ± 0.10
EF1a Elongation factor 1-alpha SGN-U207468 (At5 g60390.1) 0 CCTGGTCAAATTGGAAACGG/
CAGATCGCCTGTCAATCTTGG
103 1.62 ± 0.08
GAPDH Glyceraldehyde-3-phosphate
dehydrogenase
SGN-U209515 (At1 g42970.1) 9.2e-79 AACAACTCACTCCTACACCGG/
GGTAGCACTAGAGACACAGCCTT
135 1.83 ± 0.09
RPS13 Ribosomal protein S13 SGN-U208260 (At4 g00100.1) 4e-77 CAGGCAGGTTAAGGCAAAGC/
CTAGCAAGGTACAGAAACGGC
114 1.70 ± 0.04
RAN1 GTP-binding nuclear protein SGN-U207968 (At5 g20010.1) 1e-119 AAGCTCCCACCTGTCTGGAAA/
AACAGATTGCCGGAAGCCA
103 1.71 ± 0.07
SAND SAND family protein SGN-U210443 (At2 g28390.1) 8.2e-76 CTTACGACGAGTTCAGATGCC/
TAAGTCCTCAACACGCATGC
135 1.61 ± 0.12
TUB Tubulin beta-6 chain SGN-U207876 (At5 g12250.1) 6e-147 TGGAAACTCAACCTCCATCCA/
TTTCGTCCATTCCTTCACCTG
114 1.61 ± 0.05
UBQ Polyubiquitin SGN-U207515 (At4 g02890.2) 8e-107 TGGAGGATGGAAGGACTTTGG/
CAGGACGACAACAAGCAACAG
153 1.67 ± 0.02
Selected candidate reference genes accessions are shown as identifiers of Solanaceae Genomics Network (SGN) and Arabidopsis TAIR databases (in brackets).
Homologous Arabidopsis gene s were dete rmined on the basis of tblastx e-values
Mallona et al. BMC Plant Biology 2010, 10:4
/>Page 3 of 11
the lowest, with a CT of 21.2. In contrast, the highest
and lowest expressed genes in V30 were EF1a and ACT,
with CTs of 18.3 and 25.1, respectively.
Analysis of varian ce of CT values between organ s was
performed separately for Mitchell and V30 samples.
Since CT v alues were not normally distributed, we calcu-
lated Kruskall-Wallis and a post-hoc Pairwise Rank Sum
Wilcoxon test, both non-parametrical, using a Bonferroni
correction an d a significance cut-off of 0.05. In Mitchell
the genes RAN1, RPS13 and UBQ showed significant dif-
ferences in transcript levels between developmental
stages (Additional file 1). RAN1 transcript levels differed
significantly between leaf A and flowers C and D, RPS13
differed in flower D from the rest of floral stages ana-
lysed, and UBQ transcript levels differed significantly
between leaf A and flower D. For V30, the overall CT
variability was higher than that seen in Mitchell; in fact,
expression of all the genes analysed showed significant
differences between one or more se ts of organs and/or
development al stages. Expression of the genes GAPDH
and TUB differed between leaves A and C, while levels of
other measured transcripts were essentially the same in
the two leaf stages. In contrast, during flower develop-
ment, we could distinguish genes that showed two levels
of significantly different CT values (GAPDH and TUB),
those that showed three (ACT, CYP, EF1a and RPS13)
and others that differed at each developmental stage ana-
lysed (RAN1, SAND and UBQ).
Stability of gene expression in Mitchell and V30
Data from each of the two chosen Petunia lines were
analyzed separate ly. As a first approach, we applied data
as a unique population and transf erred it to NormFin-
der, BestKeeper, geNorm and qBasePlus according to
the flowchart plotted in Figu re 2. In a second approach,
we subdivided data into several subpopulations, corre-
sponding to unique developmental stages (i.e., flower C
or leaf A), then, piped this data into the qBasePlus and
geNorm tools. The results of both sets of analyses are
presented in Tables 2 and 3 and Additional files 2, 3
and 4.
CT values were log-transformed and used as input for
the NormFinder tool, which fitted this data into a
Figure 3 Expression profiling of reference genes in different organs and Petunia lines. CT values are inversely proportional to the amount
of template. Global expression levels (CT values) in the different lines tested are shown as 25th and 75th quantiles (horizontal lines), median
(emphasized horizontal line) and whiskers. Whiskers go from the minimal to maximal value or, if the distance from the first quartile to the
minimum value is more than 1.5 times the interquartile range (IQR), from the smallest value included within the IQR to the first quartile. Circles
indicate outliers, the values smaller or larger than 1.5 times the IQR.
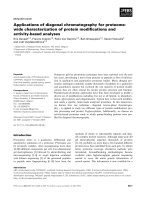
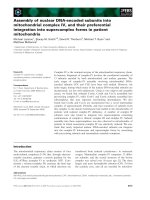
Figure 2 Data analysis flow chart. CT (cycle threshold) values
were calculated using different thresholds depending on the
variety. Efficiency value taken for line Mitchell was 2; for line V30,
there was one value for each tube. Circles indicate statistical results
to be merged with RankAggreg (Pihur 2009). Relative quantities
(RQ) were scaled to the sample with lowest CT value (flower stage
C). CT data were checked for normality (Shapiro-Wilk test) and, due
to non-normality, they were analysed by non-parametrical tests
(Kruskal and Wallis). Since CT values showed non-equal distributions
according to the organ from which RNA was extracted, they were
further tested using pairwise Wilcoxon tests with Bonferroni’s
correction with the aim of solving pairwise significant variations. A
significance threshold of 0.05 was used. Abbreviations: PV, pairwise
variation; M, classical stability value; stab, NormFinder stability value;
CV, variation coefficient; r2, determination coefficient - regression to
BestKeeper; RQ, relative quantities.
Mallona et al. BMC Plant Biology 2010, 10:4
/>Page 4 of 11
mathematical model based on six independent groups
corresponding to single developmental stages. Estimates
for stability of gene expre ssion are based on the com-
parison between inter- and intra-group variability. In the
Mitchell line, the gene exhibiting the most stable level of
expression wa s EF1a (stability value of 0.018) and CYP
and EF1a represented the best combination (0.017). In
V30, NormFinder es timated UBQ (0.053) as the most
stably expressed gene, and RAN1 and UBQ (0.069) as
the best combination of two genes.
CT values and one efficiency value for each primer
pair served as input f or the BestKeeper package. This
program was intended to establish the best-suited stan-
dards out of the nine RG candidates, and to merge
them in a normalization factor called the BestKeeper
index. Because BestKeeper software is designed to deter-
mine a reliabl e normalization factor but not to compute
the goodness of each RG independently, we took as the
stability-of-expression value the coefficient of determina-
tion of each gene to the BestKeeper index. BestKeeper
calculated the highest reliability for CYP in line Mitchell
and V30 finding GAPDH astheleastsuitablegenein
Mitchell and TUB in V30.
qBasePlus and geNorm calculate M stability values by
a slightly different procedure. This parameter is defined
as the average pair-wise variation in the level of tran-
scripts from one gene with that of all other reference
genes in a given group of samples; it is inversely related
to expression stability. However, because the inclusion
of a gene with highly variable expression can alter the
Table 2 Optimal genes for quantification of individual and mixed organs in each Petunia line.
Mitchell
Statistic Flower Leaf
A B C D A+B+C+D A C A+C
M geNorm EF1a (0.05)
RPS13 (0.05)
SAND (0.14)
UBQ (0.14)
EF1a (0.13)
RPS13 (0.13)
RAN1 (0.08)
RPS13 (0.08)
RAN1 (0.47)
SAND (0.47)
EF1a (0.11)
RPS13 (0.11)
RAN1 (0.14)
SAND (0.14)
EF1a (0.37)
RPS13 (0.37)
M qBasePlus ACT (0.55)
RPS13 (0.56)
EF1a (0.60)
RPS13 (0.60)
CYP (0.60)
SAND (0.64)
EF1a (0.30)
RAN1 (0.34)
EF1a (0.80)
SAND (0.82)
RPS13 (0.77)
EF1a (0.78)
SAND (0.93)
RAN1 (0.93)
EF1a (0.85)
RAN1 (0.92)
CV qBasePlus ACT (0.05)
SAND (0.15)
RPS13 (0.07)
CYP (0.25)
CYP (0.09)
SAND (0.11)
EF1a (0.05)
TUB (0.14)
EF1a (0.25)
SAND (0.28)
RPS13 (0.14)
RAN1 (0.18)
SAND (0.12)
RAN1 (0.18)
RAN1 (0.20)
EF1a (0.21)
Min. number 2 (0.04) 2 (0.07) 2 (0.12) 2 (0.05) 4 (0.15) 2 (0.10) 2 (0.13) 2 (0.12)
V30
Statistic Flower Leaf
A B C D A+B+C+D A C A+C
M geNorm RAN1 (0.11)
UBQ (0.11)
TUB (0.12)
CYP (0.12)
RPS13 (0.23)
UBQ (0.23)
ACT (0.02)
CYP (0.02)
RAN1 (0.45)
ACT (0.45)
TUB (0.07)
RAN1 (0.07)
RPS13 (0.09)
TUB (0.09)
RAN1 (0.20)
UBQ (0.20)
M qBasePlus CYP (0.30)
RAN1 (0.33)
CYP (0.66)
TUB (0.69)
SAND (0.63)
CYP (0.63)
RPS13 (0.29)
EF1a (0.30)
ACT (2.27)
RAN1 (2.44)
TUB (0.34)
UBQ (0.36)
SAND (0.27)
RPS13 (0.29)
UBQ (0.49)
RPS13 (0.51)
CV qBasePlus CYP (0.05)
TUB (0.10)
RAN1 (0.09)
CYP (0.11)
SAND (0.10)
ACT (0.25)
EF1a (0.06)
CYP (0.06)
ACT (0.70)
RAN1 (0.82)
UBQ (0.06)
TUB (0.09)
SAND (0.03)
RPS13 (0.06)
UBQ (0.14)
RPS13 (0.16)
Min. number 2 (0.10) 2 (0.07) 2 (0.09) 2 (0.04) NA 2 (0.04) 2 (0.03) 2 (0.07)
M values computed by geNorm and qBasePlus allow to rank optimal reference genes. For each organ and mix of organs the two top-ranked genes are shown.
The number of genes required for a reliable quantification is established using a Pairwise Variation (PV) cut-off of 0.15; n is the the minimum number of control
genes required NA means that no one pairwise variation was under the proposed cut-off .
Table 3 Gene suitability rankings for the whole dataset.
Rank position NormFinder BestKeeper qBasePlus M qBasePlus CV geNorm M Consensus
Mitchell V30 Mitchell V30 Mitchell V30 Mitchell V30 Mitchell V30 Mitchell V30
1 EF1a UBQ CYP CYP EF1a ACT EF1a RAN1 RAN1 RPS13 EF1alpha CYP
2 CYP RAN1 EF1a EF1a SAND RAN1 SAND CYP SAND UBQ SAND RAN1
3 RPS13 ACT RPS13 ACT RAN1 CYP RPS13 ACT UBQ RAN1 RPS13 ACT
4 UBQ GAPDH ACT SAND RPS13 TUB RAN1 TUB EF1alpha CYP RAN1 UBQ
5 ACT RPS13 UBQ UBQ CYP RPS13 CYP RPS13 RPS13 ACT CYP RPS13
6 SAND SAND TUB GAPDH UBQ UBQ UBQ UBQ CYP TUB UBQ TUB
7 TUB EF1alpha SAND RPS13 TUB EF1alpha TUB EF1alpha TUB EF1alpha TUB EF1alpha
8 GAPDH TUB RAN1 RAN1 ACT SAND ACT GAPDH ACT SAND ACT SAND
9 RAN1 CYP GAPDH TUB GAPDH GAPDH GAPDH SAND GAPDH GAPDH GAPDH GAPDH
Gene expression data were analyzed using five statistical parameters in both Petunia lines. Each column refers to a gene suitability ranking computed by one
statistical tool, taking into account all data of a Petunia line.
Mallona et al. BMC Plant Biology 2010, 10:4
/>Page 5 of 11
esti mation of the rest, geNorm (but not qBasePlus) per-
forms a stepwise exclusion of the least stably expressed
genes. Taking into account the entire dataset from
Mitchell with geNorm, RAN1 and SAND were calculated
to be the most stably expressed genes (M value 0.5),
GAPDH the least (1.15). In V30, RPS13 and UBQ were
calculated to be the genes of least variable expression
(0.64), whereas GAPDH was the most variable (2.61). In
terms of qBasePlus M values, EF1a was valued as the
best gene for Mitchell (0.85) and GAPDH the worst
(1.76); for V30, ACT was ranked as the most valuabl e
gene (2.11) and GAPDH was the worst (3.66).
Considering each developmental stage separately, we
found that M values were consistently higher in Mitchell
than in V30, suggesting more variable levels of RG
expression in Mitchell. Flower stage D exhibit ed the
most stable expression pattern in both lines (Figure 4).
It is noteworthy that stability of transcript levels
between reproducti ve and vegetative modules differed in
the two lines. In general, M values calculated with qBa-
sePlus, were higher in flowers stage C and D than in
leaves from Mitchell, whereas V30 showed an opposite
trend. A remarkabl e case was GAPDH, with an M value
four times higher in Mitchell than in V30 at leaf stage
C, whereas it was three times lower in Mitchell com-
pared to V30 at flower stage A (see Table 2).
Mean CV value, a measurement of the variation of rela-
tive quantities of RNA for a normalized reference gene,
showed little difference between lines, with a value of 0.42
in Mitchell and 0.44 in V30, for data analysed as a whole.
Determination of the number of genes for normalization
Quantification of gene expression relative to multiple
reference genes implies the calculation of a normaliza-
tion factor (NF) that merges data from several internal
genes. Determination of the minimal numb er of its
components is estimated by computing the pairwise var-
iation (PV) of two sequential NFs (Vn/n+1) as the stan-
dard deviation of the logarithmically transformed NFn/
NFn+1 ratios, reflecting the effect of including an addi-
tional gene [4]. If the pairwise variation value for n
genes is below a cut-off of 0.15, additional genes are
considered not to improve normalization. The number
of genes required for normalization was determined to
be two for both Mitchell and V30, except when either
different floral developmental stages or vegetative and
reproductive stages were mixed (see Table 2).
The PV values showed the same trend as that seen for
stability measurements, i.e., the developmental stage
with the lowest average PV was flower stage D, both in
Mitchell and V30. In contrast, gene expression in leaves
of Mitchell showed more variability, with higher PV
values, than those of V30 (Figure 5).
Consensus list of similarities between lines
The different software progr ams used to determine gene
suitability for normalizationofgeneexpressiongive
slightly different result s and statistical stability values for
each gene. We arranged the intern al genes in five lists
according to the rank positions generated by each of the
five statistical approaches, M values by geNorm and qBa-
sePlus, NormFinder stability value, coefficient of determi-
nation to BestKeeper and CV of qBasePlus. These lists
were used to create an aggregate order, with the aim of
obtaining an optimal list of genes for each Petunia line.
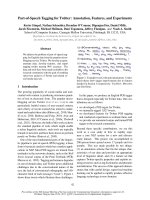
The results of the merged data revealed that the most ade-
quate of the genes tested for normalization in Mitchell are
EF1a, SAND and RPS13 ; the three showing the lowest
reliability are TUB, ACT and GAPDH (Figure 6A and 6B).
For V30, the best candidate g enes are CYP, RAN1 and
ACT, while the three lowest ranking are EF1a, SAND and
GAPDH. Thus none of the genes found as highly reliable
Figure 4 geNorm and qBasePlus a verage expression stability measure values for reference genes in individual samples.Average
expression stability values (M values) are an inverse proportion measure of expression stability. GeNorm computes M values by stepwise
exclusion of the least stable gene. (a) geNorm and qBasePlus output of Mitchell samples. (b) geNorm and qBasePlus output of V30 samples.
Mallona et al. BMC Plant Biology 2010, 10:4
/>Page 6 of 11
coincide between the lines. Despite of that, GAPDH was
highly unstable in both lines.
Discussion
Identification of robust normalization genes for Petunia
We have attempted to identify a set of genes suitable for
normalization of transcript levels in P. hybrida.Since
several Petunia lines are used for research, we based this
work on two that are extensively used for different pur-
poses. In an effort to reflect different growth environ-
ments typical of distinct lab s etups, plants of ea ch line
were grown in a set of conditions, differing in photoper-
iod, thermoperiod and growth substrate between lines
(see methods). RNA was isolated using different RNA
extraction kits, and amplifications were carried out
using di fferent reagents and PC R machines. The experi-
mental design aimed to maximize potential variability in
transcript abundance for the putative RG under study.
Highly contrasting results would suggest that every
laboratory do a pilot experiment to identify genes suita-
ble for use in normalization ; similar results between the
two systems would point to a set of genes reliable for
broad application, minimally for the lines and develop-
mental stages described.
Our findings in terms of line-associated variability
were not in a ccordance with the results from a soybean
study comparing different cultivars. Re sults of that study
suggested no highly relevant cultivar influence on RG
suitability [16]. A similar study has been reported in cof-
fee, for which average M stability values for leaves from
different cultivars were lower than that for different
organs of a single cultivar. Our result suggests that
there are differences in gene expression between same
tissues from different lines as well as different tissues
from the same line.
Noise in gene expression patterns
Development of petals, like that of many tissues and
organs in Petunia, is characterized by a spatial and tem-
poral gradient of cell division that is eventually replaced
by cell expansion [28]. However the experiments
described h ere used whole flower tissues including full
petals along with sepals, stamens and carpels. This
imposes a general requirement that any gene emerging
as robust be differe ntially regulated to a huge extent
neither in the various tissues analyzed together nor in
these tissues at different stages of maturation. One
interesting aspect of our findings was the identification
of flower stage C as a particularly noisy developmental
stage compared to early or fully developed flowers. The
transition between cell division and expansion in petals,
or other flower tissues during this developmental stage,
might explain the increased noise. An alternative non-
exclusive explanation is that the intermediate s tages of
flower development are generally less tightly defined
than the open flower stage.
Leaf development similarly consists of cell growth fol-
lowed with cell expansion [29]. However, an important
difference between floral and leaf deve lopment is that
leaves perform their essential function, e.g., photosynth-
esis, from a very early stage such that developing leaf
tissue is always a mixture of at least three processes:
growth, cell morpho genesis and differentiated cell func-
tion. This combination of processes might account for
the increased gene expression noise observed.
Number of genes required for normalization of gene
expression in Petunia
Gathering data from several RG into a normalization
factor is currently an accepted method of accurate rela-
tive quantification of gene expression [30]. Moreover,
Figure 5 Minimum number of genes necessary for reliable and
accurate normalization. GeNorm pairwise variation values (PV
values) are computed by an algorithm which measures pairwise
variation (Vn/n + 1) between two sequential normalization factors
NFn and NFn + 1, where n is the number of genes involved in the
normalization factor. (a) refers to Mitchell line and (b) to V30.
Mallona et al. BMC Plant Biology 2010, 10:4
/>Page 7 of 11
this method has been statistically and empirically vali-
dated [13,31]. Ideally the number of genes required
should be low enough to make experimental procedures
affordable, and high enough to merit confidence in the
conclusions. The PV value obtained for both Mitchell
and V30 was very low. Although the value tended to be
higher in Mitchell, the number of genes deemed neces-
sary for normalization was the same for both lines:
using the proposed cut-off of 0.15 and comparing single
developmental stages, the required number was two for
Mitchell and V30. The requirement for only two genes
is low compared to the results re ported for other phylo-
genetically related species [10,15,32] and will require sig-
nificantly less work than the previously suggested
minimum of three genes [4].
Data mining strategies and consensus list of genes
for normalization
The present research aims t o identify the control genes
best suited for use in gene expression studies in several
organs of two Petunia lines. Th e candidate RG com-
bined classical and recently identified genes. Since each
software package can introduce bias, we employed sev-
eral tools in our ana lysis. As discussed by other authors,
geNorm bases its stability measurement on pairwise
comparisons of relative expression quantitie s of all the
panel of genes in the material of interest requiring a
suite of non-coregu lated RG [6]. BestKeeper and Norm-
Finder examine primarily CT v alues, whereas qBasePlus
and geNorm e valuate RQ, a consequence of which is
that PCR efficiency dissimilarities can affect stability
measurements [16]. Nevertheless, some of these algo-
rithms are intrinsically biased because they assume that
data are normally distributed. For instance BestKeeper is
based on Pearson correlation analysis, which requires
normally distributed and variance homogeneous data.
The author described this problem and suggested
further versions of the software in w hich Spearman and
Kendall Tau correlation should be used [5]. However,
those versions are currently not available.
Our plant material di verged in the variability of statis-
tical outputs amongst lines. V30 showed a high variabil-
ity in terms of raw expression data (CT va lues) and low
in terms of expression stability measurements, whereas
Mitchell showed the opposite responses. Our global
analysis merged different statistics, some of which are
CT-based and others RQ-based, with the aim of coun-
teracting this biasing influence.
Summarizing the results of our entire dataset analysis,
geNorm recommended use of RAN1 and SAND gene s
for Mitchell and RPS13 and UBQ for V30 and
Figure 6 Rank aggregation of gene lists using the Monte Carlo algorithm. Visual representation of rank aggregation using Monte Carlo
algorithm with the Spearman footrule distances. (a) refers to Mitchell line and (b) to V30. The solution of the rank aggregation is shown in a
plot in which genes are ordered based on their rank position according to each stability measurement (grey lines). Mean rank position of each
gene is shown in black, as well the model computed by the Monte Carlo algorithm (red line).
Mallona et al. BMC Plant Biology 2010, 10:4
/>Page 8 of 11
discouraged use of GAPDH for both lines. Non-suitabil-
ity of GAPDH has bee n described by several authors
[33,34]. Regarding to Solanaceae, its unsuitability has
been confirmed in tomato [15] but it was selected as a
stable RG in coffee [35]. Due to its sequential exclusion
of the least stable gene in the M value cal culus algo-
rithm, geNorm M values can differ from those of qBase-
Plus. qBasePlus corresponded with geNorm, evaluating
EF1a as the most r eliable gene in line Mitchell but dif-
fered in line V30, recommending ACT as the best candi-
date. EF1a suitability has been confirmed in potato
during biotic and abiotic stress [10], atlantic salmon [36]
and several developmental stages of Xenopus laevis [37].
Expression of ACT genes differs depending on the
family member. ACT2/7 has been reported as a stably
expressed gene whereas ACT11 was reported as unstable
[38,39]. It is worth noting that the ACT gene used in
this study corresponds to an ACT11.
Conclusions
Altogether, there were strong similarities between the
different programs but the coincidence in assigning best
and worst gene s was not absolute. The fact that each
program identifi ed slightly different genes as best suited
for normalization prompted us to merge the data in an
unsupervised way and giving identical weight to the out-
put of the different programs. We used the RankAggreg
program for this purpose. Our results show t hat
GAPDH was the worst gene to use in normalization in
both lines. In contrast, the suggested genes did not coin-
cide and were EF1a and SAND in Mitchell, whilst CYP
and RAN1 were the genes of choice in V30. In conclu-
sion, we provide a list of genes in discrete developmen-
tal stages that show M values below 0.5 (Table 2) [4].
A normalization factor including two genes should be
enough for reliable quantification. Nevertheless we pro-
pose a reference gene stability test when performing
gene expression studies in Petunia.
Methods
Plant material
Petunia hybrida lines Mitchell and V30 were grown
in growth chambers. Mitchell plants were grown on
ED73 + Optifer (Patzer) under a 10 h light/14 h dark
cycle, with a constant temperature of 22°C (60% humidity).
V30 plants were germinated in vermiculite and grown
in a vermiculite-perlite-turf-coconut fiber mixture
(2:1:2:2). Plants were kept under a long day photoper iod
(16L: 8 D) with 25°C in L and 18°C in D.
Flowers were classified into four developmental stages:
flower buds (stage A, 1-1.5 cm), elongated buds (stage
B, 2,5-3 cm), pre-anthesis (stage C, 3.5 -4.5 cm) and
fully opened flowers shortly before anthesis (stage D)
according to Cnudde et al. [40]. L eaves were harvested
at two different stages, stage A corresponded to young,
small leaves and stage C to fully expanded ones. Three
independent samples of each of the developmental
stages of flowers and leaves were taken.
RNA isolation and cDNA synthesis
Mitchell material
Total RNA was isolated from 100 mg homogenized
plant material using an RNeasy Mini Kit (Qiagen, Hil-
den, Germany). Putative genomic DNA contamination
was eliminated by treatment with recombinant DNase I
(Qiagen) as recommended by the vendor. RNA concen-
tration and purity was estimated from the ratio of absor-
bance readings at 260 and 280 nm and the RNA
integrity was tested by gel electropho resis. cDNA synth-
esis was performed using M-MLV reverse transcriptase
(Promega, Mannheim, Germany) starting with 1 μgof
total RNA in a volume of 20 μL with oligo(dT)19 pri-
mer at 42°C for 50 min.
V30 material
Samples were homogenized in liquid nitrogen with a
mortar and pestle. Total RNA was isolated using the
NucleoSpin® RNA Plant (Macherey-Nagel, Düren, Ger-
many) according to the manufacturer ’s protocol. This
RNA isolation kit contains DNaseI in the extraction buf-
fer, added to the column once RNA is bound to the spin
column. RNA was measured by photometry at 260 nm
and quality-controlled on denaturing agarose gels. Total
RNA (0.8 μg) was transcribed using the SuperScript® III
(Invitrogen Corp., Carlsbad, CA) and oligodT20 employ-
ing 10 μL 2× RT reaction mix, 2 μLRTenzymemix
and 8 μL RNA. Reverse transcription was performed on
a GeneAmp Perkin-Elmer 9700 thermocycler (Perkin
Elmer, Norwalk, CT, USA) by using the following pro-
gramme: 10 min at 25°C, 30 min at 50°C and 5 min at
85°C; addition of 1 u of Escherichia coli RNAse H, and
incubation for 2 h at 15°C.
PCR optimisation
We selected nine genes to be tested as reference tran-
scripts (ACT, CYP, EF1a, GAPDH, RAN2, RPS13, SAND
and UBQ) based on previous descriptions (see below)
(Table 1). PCR conditions were optimised using cDNA
from leaves (stage A) in a Robocycler gradient 96 (St ra-
tagene, La Jolla, CA) and GoTaq® Flexi DNA polymerase
(Promega) in a 25 μL reaction containing: 2 μLof
cDNA, 2 mM MgCl2, 0.2 mM each dNTP, 0.4 μLof
each primer and 1.25 U enzyme.
Real-time PCR
Mitchell
Real-time PCR was performed in an Mx 3005P QPCR
system (Stratagene, La Jolla, CA) using a SYBR Green
based PCR assay (with ROX as the optional reference
dye; Power SYBR G reen PCR Mastermix, Applied Bio-
systems, Foster City, CA). A master mix containing
enzymes and primers was added individually per well.
Mallona et al. BMC Plant Biology 2010, 10:4
/>Page 9 of 11
Each reaction mix containing a 15 ng RNA equivalent of
cDNA and 1 pM gene-specific primers (Tab. 3) was
subjected to the following protocol: 95°C for 10 min fol-
lowed by 50 cycles of 95°C for 30 sec, 60°C for 1 min
and 72°C for 30 sec, and a subsequent standard dissocia-
tion protocol. As a control for genomic DNA contami-
nation,15ngoftotalnon-transcribedRNAwasused
under the same conditions as described above. All assays
were performed in three technical replicates, as well
three biological replicates.
V30
Reactions were carried out with the SYBR Premix Ex
Taq® (TaKaRa Biotechnology, Dalian, Jiangsu, China) in
a Rotor-Gene 2000 thermocycler (Corbett Research,
Sydney, Australia) and an alysed with Rotor-Gene analy-
sis software v. 6.0 as described before [41] with the fol-
lowing modifications: Reaction profiles used were 40
cycles of 95°C for 30 s, 55°C or 60°C for 20 s, 72°C for
15 s, and 80°C f or 15 s, followed by melting at 50-95°C
employing the following protocol: 2 μL RNA equivalent
of cDNA, 7.5 μLSYBRPremixExTaq2×,0.36μLof
each primer at 10 μM and 4.78 μL distilled water.
Annealing temperature was 5 5°C (TUB, CYP, ACT,
EF1a, GAPDH, and SAND)or60°C(RPS13, UBQ,
RAN1) according to the previous optimisation. In order
to reduce pipetting variability, we performed reaction
batches containing primer pairs, and templates were
added in the end. We performed three technical repli-
cates for each reaction and non-template controls, as
well three biological replicates.
Bioinformatics and statistical analysis
Data analysis strategy is described in detail in results.
Reaction efficiency calculus was done using the amplifi-
cation curve fluorescence, analyzing each tube separately
as described by Liu and Saint (2002) [42]. It was calcu-
lated as follows: E fficiency = F(n)/F(n-1), in which n is
defined as the 20% value of the fluorescence at the max-
imum of the second derivative curve. Curve was defined
by one measure in each amplification cycle. We used
only the exponentia l phase of the amplification re action.
Software packages included geNorm v3.4, the excel add-
in of NormFinder v0.953, BestKeeper v1 and qBasePlus
v1.2. Other statistical procedures were performed with
the R program , v2.7.1 with the
packages stats v2.7.1, multcompView v0.1-0 and Ran-
kAggreg v0.3-1[27].
Additional File 1: Mitchell line.
Click here for file
[ />S1.RTF ]
Additional File 2: Supplemental tables.
Click here for file
[ />S2.XLS ]
Additional File 3: Supplemental tables.
Click here for file
[ />S3.XLS ]
Additional File 4: Supplemental tables.
Click here for file
[ />S4.XLS ]
Abbreviations
ACT: Actin 11; CT: cycle threshold; CV: coefficient of variation; CYP: Cyclophilin;
EF1a: Elongation factor 1-alpha; GAPDH: Glyceraldehyde-3-phosphate
dehydrogenase; qPCR: quantitative PCR; RAN1: GTP-binding nuclear protein; RG:
reference genes; RPS13: Ribosomal protein S13; RQ: Relative quantity; SAND:
SAND family protein; TUB: b-Tubulin 6 chain; UBQ: Polyubiquitin.
Acknowledgements
Work performed in the lab of MEC and JW was funded by BIOCARM (Project
Bananasai) and MEC (Project AGL2007-61384). IM obtained a PhD fellowship
from the Fundación Séneca. This work was performed in partial fulfilment of
the PhD degree of IM in the framework of the MSc-PhD program with
Quality mention from the Spanish Ministry of Education MCD-2005-00339.
Work performed in the lab of BH was funded by the “Pact for Research and
Innovation” of the Leibniz Society, Germany. Thanks to Ronald Koes and
Francesca Quatroccio for providing seeds of line V30, and Tom Gerats for
seeds of line Mitchell. Michiel Vandenbussche is acknowledged for primers
of GAPDH. Thanks to Luciana Delgado-Benarroch, Juana María Gómez
Ballester and María Manchado -Rojo for comm ents on the manuscript. Our
special thanks to Judith Strommer for helping with the edition of the
manuscript and advice.
Author details
1
Genetics, Instituto de Biotecnología Vegetal, Universidad Politécnica
de Cartagena (UPCT), 30203 Cartagena, Spain.
2
Leibniz-Institut für
Pflanzenbiochemie, Weinberg 3, PO Box 110432, D-06120 Halle (Saale),
Germany.
Authors’ contributions
IM, BH, JW and MEC designed the experiments. IM and SL performed the
experiments. IM performed data analysis and table and figure drawing. MEC
wrote the first draft, and IM, BH, SL, JW and MEC corrected and approved
the manuscript. JW, BH and MEC wrote grant applications.
Received: 3 July 2009
Accepted: 7 January 2010 Published: 7 January 2010
References
1. Jiao YL, Tausta SL, Gandotra N, Sun N, Liu T, Clay NK, Ceserani T, Chen MQ,
Ma LG, Holford M, et al: A transcriptome atlas of rice cell types uncovers
cellular, functional and developmental hierarchies. Nature Genetics 2009,
41(2):258-263.
2. Gutierrez L, Mauriat M, Guenin S, Pelloux J, Lefebvre JF, Louvet R, Rusterucci
C, Moritz T, Guerineau F, Bellini C, et al: The lack of a systematic validation
of reference genes: a serious pitfall undervalued in reverse transcription-
polymerase chain reaction (RT-PCR) analysis in plants. Plant Biotechnol J
2008, 6(6):609-618.
3. Pfaffl MW, Horgan GW, Dempfle L: Relative expression software tool (REST
(C)) for group-wise comparison and statistical analysis of relative
expression results in real-time PCR. Nucl Acids Res 2002, 30(9):e36.
4. Vandesompele J, De Preter K, Pattyn F, Poppe B, Van Roy N, De Paepe AFS:
Accurate normalization of realtime quantitative RT-PCR data by
geometric averaging of multiple internal control genes. Genome Biology
2002, 3:research0034.1-research0034.11.
5. Pfaffl MW, Tichopad A, Prgomet C, Neuvians TP: Determination of stable
housekeeping genes, differentially regulated target genes and sample
integrity: BestKeeper - Excel-based tool using pair-wise correlations.
Biotechnology Letters 2004, 26(6):509-515.
Mallona et al. BMC Plant Biology 2010, 10:4
/>Page 10 of 11
6. Andersen CL, Jensen JL, Orntoft TF: Normalization of real-time
quantitative reverse transcription-PCR data: A model-based variance
estimation approach to identify genes suited for normalization, applied
to bladder and colon cancer data sets. Cancer Research 2004, 64(15):
5245-5250.
7. Hellemans J, Mortier G, De Paepe A, Speleman F, Vandesompele J: qBase
relative quantification framework and software for management and
automated analysis of real-time quantitative PCR data. Genome Biology
2007, 8(2):R19.
8. Czechowski T, Stitt M, Altmann T, Udvardi MK, Scheible WR: Genome-wide
identification and testing of superior reference genes for transcript
normalization in Arabidopsis. Plant Physiol 2005, 139(1):5-17.
9. Jain M, Nijhawan A, Tyagi AK, Khurana JP: Validation of housekeeping
genes as internal control for studying gene expression in rice by
quantitative real-time PCR. Biochem Biophys Res Commun 2006, 345(2):
646-651.
10. Nicot N, Hausman J-F, Hoffmann L, Evers D: Housekeeping gene selection
for real-time RT-PCR normalization in potato during biotic and abiotic
stress. J Exp Bot 2005, 56(421):2907-2914.
11. Gonzalez-Verdejo CI, Die JV, Nadal S, Jimenez-Marin A, Moreno MT, Roman
B: Selection of housekeeping genes for normalization by real-time RT-
PCR: analysis of Or-MYB1 gene expression in Orobanche ramosa
development. Anal Biochem 2008, 379(2):176-181.
12. Hong SY, Seo PJ, Yang MS, Xiang F, Park CM: Exploring valid reference
genes for gene expression studies in Brachypodium distachyon by real-
time PCR. BMC Plant Biol 2008, 8:112.
13. Reid KE, Olsson N, Schlosser J, Peng F, Lund ST: An optimized grapevine
RNA isolation procedure and statistical determination of reference
genes for real-time RT-PCR during berry development. BMC Plant Biology
2006, 6:27.
14. Coker JS, Davies E: Selection of candidate housekeeping controls in
tomato plants using EST data. Biotechniques 2003, 35(4):740-742,744-746.
15. Exposito-Rodriguez M, Borges A, Borges-Perez A, Perez J: Selection of
internal control genes for quantitative real-time RT-PCR studies during
tomato development process. BMC Plant Biology 2008, 8(1):131.
16. Jian B, Liu B, Bi Y, Hou W, Wu C, Han T: Validation of internal control for
gene expression study in soybean by quantitative real-time PCR. BMC
Molecular Biology 2008, 9:59.
17. Gerats T, Strommer J: Petunia. Evolutionary, developmental and
physiological genetics. New York: Springer 2009.
18. Gerats T, Vandenbussche M: A model system comparative for research:
Petunia. Trends Plant Sci 2005, 10(5):251-256.
19. Mitchell AZ, Hanson MR, Skvirsky RC, Ausubel FM: Anther culture of
Petunia: Genotypes with high frequency of callus, root, or plantlet
formation. Z Pflanzenphysiol 1980,
100:131-146.
20. Dudareva N, Pichersky E: Metabolic engineering of plant volatiles. Current
Opinion in Biotechnology 2008, 19(2):181-189.
21. Boatright J, Negre F, Chen XL, Kish CM, Wood B, Peel G, Orlova I, Gang D,
Rhodes D, Dudareva N: Understanding in vivo benzenoid metabolism in
petunia petal tissue. Plant Physiol 2004, 135(4):1993-2011.
22. Spitzer B, Ben Zvi MM, Ovadis M, Marhevka E, Barkai O, Edelbaum O,
Marton I, Masci T, Alon M, Morin S, et al: Reverse genetics of floral scent:
Application of tobacco rattle virus-based gene silencing in petunia. Plant
Physiol 2007, 145(4):1241-1250.
23. Koes RE, Spelt CE, Reif HJ, Vandenelzen PJM, Veltkamp E, Mol JNM: Floral
Tissue of Petunia-Hybrida (V30) Expresses Only One Member of the
Chalcone Synthase Multigene Family. Nucl Acids Res 1986, 14(13):5229-
5239.
24. Bey M, Stuber K, Fellenberg K, Schwarz-Sommera Z, Sommer H, Saedler H,
Zachgo S: Characterization of Antirrhinum petal development and
identification of target genes of the class B MADS box gene DEFICIENS.
Plant Cell 2004, 16(12):3197-3215.
25. Delgado-Benarroch L, Causier B, Weiss J, Egea-Cortines M: FORMOSA
controls cell division and expansion during floral development in
Antirrhinum majus. Planta 2009, 229:1219-1229.
26. Zenoni S, Reale L, Tornielli GB, Lanfaloni L, Porceddu A, Ferrarini A, Moretti
C, Zamboni A, Speghini S, Ferranti F, et al: Downregulation of the Petunia
hybrida alpha-expansin gene PhEXP1 reduces the amount of crystalline
cellulose in cell walls and leads to phenotypic changes in petal limbs.
Plant Cell 2004, 16(2):295-308.
27. Pihur V, Datta S, Datta S: RankAggreg, an R package for weighted rank
aggregation. BMC Bioinformatics 2009, 10(1):62.
28. Reale L, Porceddu A, Lanfaloni L, Moretti C, Zenoni S, Pezzotti M, Romano
B, Ferranti F: Patterns of cell division and expansion in developing petals
of Petunia hybrida. Sex Plant Reprod 2002, 15(3):123-132.
29. Beemster GTS, Vercruysse S, De Veylder L, Kuiper M, Inze D: The
Arabidopsis leaf as a model system for investigating the role of cell
cycle regulation in organ growth. J Plant Res 2006, 119(1):43-50.
30. Autran D, Jonak C, Belcram K, Beemster GTS, Kronenberger J, Grandjean O,
Inze D, Traas J: Cell numbers and leaf development in Arabidopsis: a
functional analysis of the STRUWWELPETER gene. EMBO J 2002,
21(22):6036-6049.
31. Gabrielsson BG, Olofsson LE, Sjogren A, Jernas M, Elander A, Lonn M,
Rudemo M, Carlsson LM: Evaluation of reference genes for studies of
gene expression in human adipose tissue. Obesity Res 2005, 13:649-652.
32. Brunner AM, Yakovlev IA, Strauss SH: Validating internal controls for
quantitative plant gene expression studies. BMC Plant Biol 2004, 4:14.
33. Suzuki T, Higgins PJ, Crawford DR: Control selection for RNA quantitation.
Biotechniques 2000, 29:332-337.
34. Ke LD, Chen Z, Yung WKA: A reliability test of standard-based
quantitative PCR: exogenous vs endogenous standards. Molecular and
Cellular Probes 2000, 14(2):127-135.
35. Cruz F, Kalaoun S, Nobile P, Colombo C, Almeida J, Barros L, Romano E,
Grossi-de-Sá M, Vaslin M, Alves-Ferreira M: Evaluation of coffee reference
genes for relative expression studies by quantitative real-time RT-PCR.
Molecular Breeding 2009, 23(4):607-616.
36. Olsvik PA, Lie KK, Jordal AEO, Nilsen TO, Hordvik I: Evaluation of potential
reference genes in real-time RT-PCR studies of Atlantic salmon. BMC
Molecular Biology 2005, 6(1):21.
37. Sindelka R, Ferjentsik Z, Jonak J: Developmental expression profiles of
Xenopus laevis reference genes. Developmental Dynamics 2006, 235(3):11.
38. Jian B, Liu B, Bi YR, Hou WS, Wu CX, Han TF: Validation of internal control
for gene expression study in soybean by quantitative real-time PCR. Bmc
Molecular Biology 2008, 9.
39. Paolacci AR, Tanzarella OA, Porceddu E, Ciaffi M: Identification and
validation of reference genes for quantitative RT-PCR normalization in
wheat. BMC Molecular Biology 2009, 10(1):11.
40. Cnudde F, Moretti C, Porceddu A, Pezzotti M, Gerats T: Transcript profiling
on developing Petunia hybrida floral organs. Sex Plant Reprod 2003,
16(2):77-85.
41. Manchado-Rojo M, Weiss J, Egea-Cortines M: Using 23 rDNA to identify
contaminations of E. coli in Agrobacterium tumefaciens cultures. Anal
Biochem 2008, 372:253-254.
42. Liu W, Saint DA: A new quantitative method of real time reverse
transcription polymerase chain reaction assay based on simulation of
polymerase chain reaction kinetics. Anal Biochem 2002, 302(1):52-59.
doi:10.1186/1471-2229-10-4
Cite this article as: Mallona et al.: Validation of reference genes for
quantitative real-time PCR during leaf and flower development in
Petunia hybrida. BMC Plant Biology 2010 10:4.
Submit your next manuscript to BioMed Central
and take full advantage of:
• Convenient online submission
• Thorough peer review
• No space constraints or color figure charges
• Immediate publication on acceptance
• Inclusion in PubMed, CAS, Scopus and Google Scholar
• Research which is freely available for redistribution
Submit your manuscript at
www.biomedcentral.com/submit
Mallona et al. BMC Plant Biology 2010, 10:4
/>Page 11 of 11