báo cáo khoa học: " DNA polymorphisms and haplotype patterns of transcription factors involved in barley endosperm development are associated with key agronomic traits" pot
Bạn đang xem bản rút gọn của tài liệu. Xem và tải ngay bản đầy đủ của tài liệu tại đây (840.8 KB, 11 trang )
RESEARC H ARTIC LE Open Access
DNA polymorphisms and haplotype patterns of
transcription factors involved in barley
endosperm development are associated with key
agronomic traits
Grit Haseneyer
1,4,5
, Silke Stracke
1,6
, Hans-Peter Piepho
2
, Sascha Sauer
3
, Hartwig H Geiger
4
, Andreas Graner
1*
Abstract
Background: Association mapping is receiving considerable attention in plant genetics for its potential to fine
map quantitative trait loci (QTL), validate candidate genes, and identify alleles of interest. In the present study
association mapping in barley (Hordeum vulgare L.) is investigated by associating DNA polymorphisms with
variation in grain quality traits, plant height, and flowering time to gain further understanding of gene functions
involved in the control of these traits. We focused on the four loci BLZ1, BLZ2, BPBF and HvGAMYB that play a role
in the regulation of B-hordein expression, the major fraction of the barley storage protein. The associ ation was
tested in a collection of 224 spring barley accessions using a two-stage mixed model approach.
Results: Within the sequenced fragments of four candidate genes we observed different levels of nucleotide
diversity. The effect of selec tion on the candidate genes was tested by Tajima’s D which revealed significant values
for BLZ1, BLZ2, and BPBF in the subset of two-row ed barleys. Pair-wise LD estimates between the detected SNPs
within each candidate gene revealed different intra-genic linkage patterns. On the basis of a more extensive
examination of genomic regions surrounding the four candidate genes we found a sharp decrease of LD (r
2
<0.2
within 1 cM) in all but one flanking regions.
Significant marker-trait associations between SNP sites within BLZ1 and flowering time, BPBF and crude protein
content and BPBF and starch content were detected. Most haplotypes occurred at frequencies <0.05 and therefore
were rejected from the association analysis. Based on haplotype information, BPBF was associated to crude protein
content and starch content, BLZ2 showed association to thousand-grain weight and BLZ1 was found to be asso-
ciated wi th flowering time and plant height.
Conclusions: Differences in nucleotide diversity and LD pattern within the candidate genes BLZ1, BLZ2, BPBF, and
HvGAMYB reflect the impact of selection on the nucleotide sequence of the four candidate loci.
Despite significant associations, the analysed candidate genes only explained a minor part of the total genetic var-
iation alth ough they are known to be important factors influencing the expression of seed quality traits. Therefore,
we assume that grain quality as well as plant height and flowering time are influenced by many factors each con-
tributing a small part to the expression of the phenotype. A genome-wide association analysis could provide a
more comprehensive picture of loci involved in the regulation of grain quality, thousand grain weight and the
other agronomic traits that were analyzed in this study. However, despite available high-throughput genotyping
arrays the marker density along the barely genome is still insufficient to cover all associations in a whole genome
scan. Therefore, the candidate gene-based approach will further play an important role in barley association
studies.
* Correspondence:
1
Leibniz-Institute of Plant Genetics and Crop Plant Research (IPK), Corrensstr.
3, 06466 Gatersleben, Germany
Haseneyer et al. BMC Plant Biology 2010, 10:5
/>© 2010 Hasen eyer et al; licensee BioMed Central Ltd. This is an Open Access article distributed under the terms of the Creative
Commons Attribution Lice nse ( which permits unrestricted use, dist ribu tion, and
reprodu ction in any medium , provided the original work is properly cite d.
Background
Association mapping is receiving considerable atten-
tion in plant genetics for its potential to fine map
quantitative trait loci (QTL), validate candidate genes,
and identify alleles of inter est. Association mapping
has several adv antages over lin kage mapping: Fir st, a
potentially larger number of alleles per locus can be
surveyed simultaneously [1]. Second, results refer to a
more representative genetic background. Third, the
resolution of association mapping is increased because
all recombination events accumulated in the popula-
tion history are taken into consideration [2]. There are
twowaystoidentifyDNA-markersforQTLviaasso-
ciation mapping: whole genome association mapping
and re-sequencing of candidate genes. In whole gen-
ome association mapping populations are genotyped
with a genome-wide set of closely linked and evenly
distributed markers. This essentially re quires a large
number of markers and is therefore expensive and sta-
tistically complex [3]. The number of markers to be
employed depends on the genome size and t he extent
of LD along the chromosomes. In a candidate gene-
based approach, genotyping is targeted to functional
and positional c andidate genes for the trait under con-
sideration [4]. This approach is assisted by (i) plant
genomics resources such as expressed sequence tag
(EST) databases, (ii) available knowledge on gene func-
tion in model organisms, and (iii) referenced informa-
tion on physiology, biochemistry, and molecular
genetics available for the trait of interest. In the pre-
sent study we applied a candidate gene-based approach
to find marker-trait associations for agronomic impor-
tant traits in a spring b arley collection.
The improvements of grain yield and quality, either
for fo od or for feed, are paramount targets in any barley
breeding program. It is known that transcription factors
play an important role in controlling expression during
seed development. Genetic differences in the synthesis
of storage proteins can already be observed at the tran-
scriptional l evel [5-7]. In barley, B-hordein represents
the largest fraction of the storage protein. Functional
analysis of the promoters of gen es specifica lly expressed
in the cereal endosperm , such as those encoding B-hor-
dein (e.g. Hor2), has demonstrated the existence of cis-
acting motifs capable of interacting with nuclear pro-
teins that are putatively responsible for their tissue spe-
cificity and temporal regulation [8-10]. The endosperm
box is a conserved cis-acting element, which contains
two distinct protein binding sites: the prolamin-box (PB)
and the GCN4-like motif (GLM). Four transcription fac-
tors (TFs) are the gibberellin-regulated Myb factor
(GAMYB), the barley leucine zippers 1 and 2 (BLZ1,
BLZ2), and the barley prolamin box binding factor
(BPBF) that were shown to be involved in the transcrip-
tion of B-hordeins encoded by the Hor2 locus.
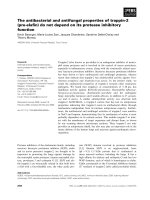
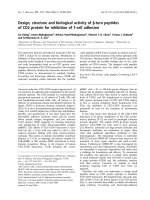
BLZ1 mRNA is detected during early endosperm
development.Thesinglecopygeneisatranscriptional
activator that interacts with endosperm-specific gene
promoters (Figure 1). Vicente-Carbajosa et al. [11]
demonstrated the involvement of BLZ1 in the regulation
of hordein gene expression through binding to the
GLM. BLZ1 protein functions as a transcriptional acti-
vator and is able to form either homodimers or hetero-
dimers with BLZ2 [12]. The BLZ2 mRNA expression is
restricted to the endosperm and its protein specifically
binds to the GLM [12]. As indicated by its designation,
the BPBF has been shown to activate hordein genes
through binding to the PB [13,14]. Transient expression
experiments in developing barley endosperms demon-
strate that BPBF trans-activates transcription from the
PB element of a native Hor2 promoter [14]. Positive reg-
ulatory interaction was observed between BPBF and
HvGAMYB in the co ntrol of endosperm ge ne expres-
sion during seed development [13]. In developing seeds
abundant expression of the transcription factor HvGA-
MYB is induced by gibberellic acid. Its mRNA can be
detected in the starchy endosperm and other grain tis-
sues [13]. The protein trans-actives transcription from
the native Hor2 promoter through binding to a third
motif (5’-AACA/TA-3’)thatispresentinendosperm-
specific genes. Thus, HvGAMYB represents a key regu-
lator of genes specifically expressed in the endosperm
during seed development [13]. In addition to seed tissue,
HvGAMYBalsoplaysaroleinotheraspectsofplant
growth and development [15] and BLZ1 expression was
also detected in leaves and roots [11].
A pheno typically well characterized spring barley col -
lection was recently established by Haseneyer et al. [16]
as re source for this association study. Information about
morphological properties of the accessions is available
and population structure was determined with 45 EST-
derived SSR markers. In the current paper we report o n
the analysis of nucleotide diversity parameters for t he
above mentioned candidat e genes. Results are presented
on the association between sequence polymorphisms
within BLZ1 (chromosome 5 H), BLZ2 (chromosome 1
H),
BPBF (chromosom e 5 H), and HvGAMYB (chromo-
some 3 H) and the phenotypic variation of the five agro-
nomic traits thousand-grain weight, starch content,
protein content, plant height and flowering time.
Methods
Plant material and phenotypic analyses
The above mentioned collection of spring barleys
selected from the B arley Core Collection (BCC) and the
Federal ex situ Genebank (HOR) was used in this study
Haseneyer et al. BMC Plant Biology 2010, 10:5
/>Page 2 of 11
(Additional file 1). The germplasm set consists of 128
two-rowed and 96 six-rowed accessions originating from
Europe (N = 109), East Asia (N = 40), America (N =
30), and West Asia and North Africa (N = 45). Eigh teen
accessions were classified as “breeding/research mate-
rial” , 55 accessions as landraces/traditional cultivars
while the remaining accessions represent advanced
breeding lines and cultivars . Accessions were phenotypi-
cally evaluated at Stuttgart-Hohenheim (South Ger-
many), Irlbach (South Germany) and Bergen-Wohlde
(North Germany) in 2004 and 2005. Each trial was
arranged in microplots in a 25 × 15 lattice design with
three replicates. Thousand-grain weight (TGW), flower-
ing time (FT), and plant height (PH) were recorded.
Grain quality (crude protein content (CPC) and starch
content (STR)) was assessed by near infrared reflectance
spectroscopy (NIRS, for further details see [16]).
Population structure
All 224 accessions were genotyped with 45 simple
sequence repeat (SSR) markers that are evenly distribu-
ted across the barley genome [17]. A population struc-
ture with K = 2 subgroups was inferred from the SSR
data by using t he STRUCTURE 2.0 software package
[18,19]. The individual steps of analysis were desc ribed
in detail by Haseneyer et al. [16].
Genotyping and genetic mapping
Eight seeds from each accession were grown in the
greenhouse and leaves from 2-week-old seedlings were
harvested and bulked for genomic DNA extraction
using the method described in Stein et al. [20]. PCR-pri-
mers were designed using the software Primer3 [21].
Primer sequences and the fragment-specific PCR profile
conditions are given in additional file 2. P CR for single
nucleotide polymorphism (SNP) analysis by DNA
sequencing was performed as described in full detail by
[22]. In preparation for DNA sequencing, we purified
the PCR amplicons in 384-well plates and adjusted to
similar molarity. 10 ng PCR product was used as tem-
plate for cycle se quencing. DNA sequences were deter-
mined using ABI BigDye Terminator 3.1 chemistry and
96-capillary sequencer systems (ABI 3730 × l). Forward
and reverse PCR primers were used as sequencing pri-
mers (Additional file 2). DNA sequence ladders were
processed for quality scoring using a software package
based on the poly-phred system [23]. We applied the
program Sequencher™ Version 4.5 (Gene Codes Coop-
eration) for sequence alignment and editing. All posi-
tions given in the text correspond to the positions in
the haplotype sequence alignments related to the start
codon (Additional file 3).
BLZ1, BLZ2 and BPBF were genetically mapped in the
Oregon Wolfe Barley (OWB) mapping population devel-
oped by Costa et al. [24]. Positions were determined on
an updated OWB map [25]. Therefore, we designed
cleaved amplified polymorphic sequence (CAPS) mar-
kers that require the use of the restriction enzymes Nci
I(BLZ1, SNP 1733), Ssp I (BLZ2, SNP 216 1), and Sty I
(BPBF, SNP -210). HvGAMYB was mapped earlier by
Haseneyer et al. [26].
Diversity and association analysis
The candidate genes’ DNA fragments w ere sequenced
for each accession of the collection. DnaSP Version 4.10
[27] was applied for the statistical sequence analysis.
This software does not take into account th e alignment
gaps that may lead to underestimated diversity values.
To avoid potential bias, insertion-deletion events (indels)
were treated as single sites. Nucleotide diversity esti-
mated as Pi (π) [28], haplo type diversity (Hd), and Taji-
ma’ s D [29] were computed. Diversity values of gene
fragments showi ng no sequ ence overl ap were calculated
fragment-wise and then the arithmetic average was
computed.
Figure 1 Interplay between the candidate genes and the promoter region of a target gene (e.g. Hor2). Transcription start is displayed as
ATG. Arrows to both sides show known interactions between the four transcription factors BLZ1, BLZ2, BPBF and HvGAMYB. Grey boxes indicate
cis-regulatory motifs named as mentioned in the black boxes.
Haseneyer et al. BMC Plant Biology 2010, 10:5
/>Page 3 of 11
LD between pairs of polymorphic sites ( minor allele
frequency, MAF ≥ 0.05) was estimated by TASSEL soft-
ware, version 1.9.3 [30]. LD is ex pressed by r
2
[31] and
the statistic al significance ( P-value) of the observed LD
is estimated by Monte-Carlo approximation of Fisher’s
exact test [32], with 1,000 permutations. In order to
estimate the local decay of LD, additional markers flank-
ing the candidate genes at increasing distances were
investigated in the entire collection. The expected v alue
of r
2
is E(r
2
) = 1/(1+C), where C =4Nc, N is the effec-
tive population size, and c is the recombination fraction
between sites [33]. This model was employed in non-
linear regression of r
2
on c, treating N as a parameter to
be estimated, using PROC N LIN of the SAS System for
Windows (Version 9.1.3.)
Combined analyses of phenotypic and genotypic data
were performed using Version 9.1.3 of the SAS System
for Windows. We followed a two-stage mixed model
approach [34,35] where in the first stage adjusted entry
means and weights were computed for each trial, which
were then subjected to a mixed model analysis com-
bined over trials in the second stage. Our analysis is
based on the assumption that genotypes are a random
sample from the world collection of barley genotypes. In
order to compute adjusted means for singl e trials, how-
ever, we formally took genotypes as fixed in the first
stage, fitting a linear model with fixed effects for geno-
types and replicate and random effects for block and
error. Thus, adjusted means were unbiased estimates o f
the genotypes’ performances in the different environ-
ments, which allowed formu lating a mixed model for
adjusted means i n the second stage. Note that taking
genotypes random, and hence computing best linear
unbiased predictors (BLUPs) of genotype performances ,
in the firs t stage wo uld have cau sed biases that would
have been difficult to account for in sta ge two [35]. In
the second stage, the following model terms were fitted:
overall mean (fixed), trial main effects (fixed), genotype
main effect (random), genotype-by-trial interaction (ran-
dom). In addition, spike morphology and geographic
origin were modelled by fixed effects for ‘row number’,
which had two levels, and ‘origin’, which had fo ur levels.
Population structure was modelled by fixed-effects
regression on a Q matrix of membership probabilities of
N genotypes in each of K subgroups. The Q matrix was
computed using the Bayesian approach of Pritchard et
al. [19]. Associations of haplotypes and SNP markers
were tested by adding a haplotype or SNP marker cov-
ariate to the fixed part of the m odel. Tests of fixed
effects were based on variance estimates using the
restricted maximum likelihood (REML) method and
denominator degrees of freedom approximated by the
method of Kenward and Roger [36]. The genetic var-
iance explained by a fixed effect was computed by the
relative reduction in genetic variance when the fixed
term was added. Weights to model the error variance of
adjusted means in stage two were computed based on
the diagonal e lements of the inverse of the asymptotic
variance-covariance matrix of adjusted means [35]. All
variance components were estimated by the REML
method. Adjusted means were compared by Wald t-
tests [37]. As the haplotype means were not variance
balanced, we used the method of Piepho [38] to gener-
ate a letter displ ay showing the significance of compari-
sons. Type I error rate was controlled by the
Bonferroni-Holm procedure [39].
Results
Sequence diversity and haplotype analysis
The polymorphism density ranged from 1 polymorph-
ism/31 bp (BLZ2), 1 polymorphism/42 bp (BPBF), 1
polymorphism/55 bp (BLZ1) to 1 po lymorphism/74 bp
(HvGAMYB). Nucleotide diversities (π) were determined
for BLZ1 (1,113 bp), BLZ2 (2,232 bp), BPBF (1,119 bp)
and HvGAMYB (3,337 bp) for the entire germplasm set
and the geographical and morphological subsets indivi-
dually (Table 1). Diversity estimates for the entire col-
lection ranged from π =2.4×10
-3
(HvGAMYB )toπ =
8.1 × 10
-3
(BPBF). In most cases individual subgroups
showed a similar range of nucleotide diversities for all
cand idate genes. An exception was only noted for BLZ2
where the two-rowed subset displayed a highly reduced
π-value, whereas a high diversity was observed for the
East Asian accessions.
Haplotype analysis indicated a similar diversity at most
gene loci and for all subpopulat ions, although the num-
ber of haplo types per locus ranged from 8 (BLZ1)to21
(BPBF). The haplotype diversity at BLZ2, BPBF and
HvGAMYB was mainly caused by the six-rowed acces-
sions that were particularly frequent in the American,
East Asian and West Asian and North African subsets.
The two-rowed subset, that primarily included European
genotypes, revealed the l owest estimates for all loci con-
sidered, especially for the BLZ2 gene.
Linkage disequilibrium
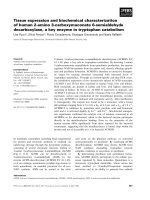
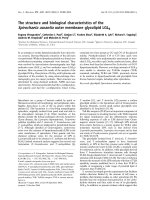
The pairwise LD values revealed different patterns for
the genes studied (Figure 2). BLZ1 and HvGAMYB
showed strong LD (r
2
>0.8, P < 0.0001) only between a
few polymorphic sites. At the BLZ1 locus two blocks of
polymorphism (positions 1740 to 1890 a nd 2520 to
2774) displayed significant LD estimates higher than r
2
=0.5(P < 0.0001). BLZ2 and BPBF showed significant
LD across the entire sequence. Eve n beyond the gap of
482 bp between the two sequenced fragments of BPBF
(positions -368 to 62 and 579 to 1129) LD persisted at a
high level (r
2
>0.4, P < 0.0001). The sites 2316 and 2361
at the BLZ2 gene and 870 at the BPBF locus segregated
separately from the remaining polymorphic sites.
Haseneyer et al. BMC Plant Biology 2010, 10:5
/>Page 4 of 11
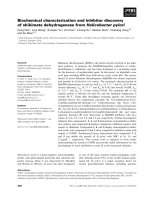
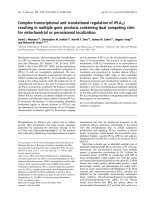
The results of the extended LD study of markers flank-
ing the four candid ate genes showed that LD remained
significant at distances up to 19 cM. However, ind ividual
r
2
values sharply decreased to r
2
<0.1 within 1 cM in the
surrounding regions of all four candidate genes (Figure 3).
Only in the proximal region of BLZ2 sustained levels of
LD were observed up to 10 cM (Additional file 4).
The impact of selection on the four candidate genes was
tested by calculating Tajima’s D. Signif icant deviations
from the mutation-drift equilibrium were observed for
BLZ1 and BPBF for the entire collection (Table 2).
Within the two-rowed subset BLZ1, BLZ2,andBPBF
were significant, while in the six-rowed subset only
BPBF reveale d a s ignifican t Tajima D-value. No signifi-
cant values were observed for HvGAMYB.
Marker-trait association
For all association analyses the model including popula-
tion st ructure (two subgroups referred to as ‘K2’ ), ‘row
number’ and ‘origin’ was applied. Several SNPs within
the candidate gene BLZ1 being in high LD with one
another were significantly ass ociated with flowering time
(Table 3, Additional file 5). They explained between 6.5
to 7.5% of the genetic variation and phenotypic means
of the respective SNP alleles revealed a significant tw o-
day difference in flowering time.
Within the BPBF gene polymorphisms in the exonic and
5’ -and3’-untra nslated regions were associated with
crude protein content. Phenotypic means of the SNP
alleles revealed a significant difference of 5.9% in crude
protein content. One SNP (pos. 579) explained 12.4% of
the genetic variation. Estimates for pairwise LD were
significant for these sites with r
2
>0.5 (P < 0.0001). A
portion (5’-untranslated region, and SNP at pos. 62) of
these sites showed association to starch content reveal-
ing a significant difference between phenotypic means of
the contrasting alleles.
Haplotype-trait association
In accordance with the handling of SNP data, haplotype-
trait associations were restricted to haplotype classes
which were more frequent than 0.05. Applying this fre-
quency threshold, three haplotype classes were detected
for BLZ1, BLZ2,andBPBF and four haplotype classes
for HvGAMYB (Additional file 5) that were entered in
the association analysis. BLZ1 was significantly (P-value
< 0.05) associated with flowering time and plant heigh t,
and explained 3.3% and 3.1% of the genetic variation,
respectively (Table 4). A weak association of BLZ1 with
crude protein content was observed explaining 2.7% of
the ge netic variation. BLZ2 haplotypes were associated
with thousand-grain weight and explained 4.0% of the
genetic variance (Table 4). Haplotypes of the candidate
gene BPBF were significantly associated to crude protein
content and starch content and explained 8.2% and 6.0%
of the genetic variation, respectively.
Discussion
In this study, a worldwide collection of spring barley
accessions was used to perform marker-trait association
analyses based on a set of four candidate genes for grain
quality.
Different patterns of sequence diversity, haplotype
diversity and LD were observed for the candidate genes
BLZ1, BLZ2, BPBF, and HvGAMYB. A similar variability
of LD patterns was found for different members of the
CBF (C-repeat binding factor) transcription factor family
Table 1 Estimates of nucleotide and haplotype diversity
for the candidate genes BLZ1, BLZ2, BPBF and HvGAMYB
Accession
(sub)set
1
No. of
polymorphism
Nucleotide
diversity
(π ×10
-3
)
No. of
haplotypes
Haplotype
diversity
(Hd)
BLZ1
Total 20 5.6 8 0.65
AM 20 5.8 6 0.68
EA 19 6.0 7 0.77
EU 20 5.2 8 0.66
WANA 20 5.2 8 0.73
2-rowed 19 5.4 7 0.63
6-rowed 20 5.8 8 0.70
BLZ2
Total 72 6.5 18 0.68
AM 27 6.0 4 0.65
EA 64 8.0 9 0.87
EU 67 4.0 9 0.38
WANA 56 6.3 9 0.80
2-rowed 58 1.8 9 0.23
6-rowed 68 5.9 16 0.86
BPBF
Total 26 8.1 21 0.68
AM 22 9.1 4 0.60
EA 25 7.6 11 0.73
EU 23 7.7 14 0.62
WANA 21 8.9 8 0.77
2-rowed 23 7.4 14 0.56
6-rowed 25 8.7 14 0.77
HvGAMYB
Total 45 2.4 18 0.74
AM 34 2.8 8 0.80
EA 30 1.8 8 0.64
EU 31 2.1 9 0.68
WANA 37 2.7 11 0.84
2-rowed 29 1.9 10 0.61
6-rowed 43 2.7 15 0.84
1: Diversity estimates for differe nt geographic regio ns (AM: America, EA: East
Asia, EU: Europe, WANA: West Asia and North Africa) and in two-rowed and
six-rowed barleys are given
Haseneyer et al. BMC Plant Biology 2010, 10:5
/>Page 5 of 11
[40]. In the present study LD within genes was weak for
BLZ1 and HvGAMYB but strong for the other two
genes. The high numbe r of s equence polymorphisms
detected at the BLZ2 locus is in accordance with obser-
vations on the homologous gene Opaque 2 in maize
[41]. Compared to the remaining members of the bzip
class of regulatory genes, BLZ2 and its homologues
seem to be characteriz ed by exception ally high level s of
polymorphism. The high SNP frequency in BLZ2 is not
reflected in a high nucleotide or haplotype diversity
since diversity in this gene is caused by only few fre-
quent and many rare SNPs. HvGAMYB showed the low-
est and BPBF the highest values of nucleotide diversity,
whereas the opposite was found for the haplotype diver-
sity. T his pattern is due t o the high pairwise LD at the
BPBF locus resulting in few frequent and many rare
haplotypes. The low level of LD, which was observed at
the HvGAMYB locus, might be due to a low selection
pressure on this gene during its domesticat ion and
breeding history [26].
Malting b arley is characterized by a low protein and
hig h starch content [42]. In this regard, two-rowed bar-
ley is preferred by European brewing industry due to
the favourabl e protein to starch relation. A strong selec-
tion for these two negatively correlated traits might have
had a bearing on nucleotide diversity in the underlying
candidate genes. This is apparent for the BLZ2 locus
where the redu ced diversity in the European subset cor-
responds with a high propo rtion of two-rowed geno-
types in this geographic subset. The observed reduction
Figure 2 Linkage disequilibrium between the polymorphic sites (MAF>0.05) within the candidate loci BLZ1, BLZ2, BPBF, Hv GAMYB.
Asterisk indicates transcription start, dashed lines indicate regions that were sequenced and “i” and “e” column indicates polymorphisms in
introns and exons, respectively. MAF = minor allele frequency.
Haseneyer et al. BMC Plant Biology 2010, 10:5
/>Page 6 of 11
in sequence variation might be a consequence of purify-
ing selection [43]. The negative Tajima D value might
indicate such kind of selection for BLZ2 in the two-
rowed subset caused by the elimination of deleterious
alleles and leaving only one major haplotype which is
common to 95 of the 108 two-rowed accessions.
It is well known t hat selection in autogamous organ-
isms leads to an increase in LD [44]. In this context,
selection may affect the regulatory regions of genes, or
target regulatory loci rather than the protein-coding
region of genes [45]. In Zea may s L. the ear underwent
dramatic morphological alteration upon domestication
and has been a continuing target of selection for grain
yield [46]. Therefore, Hufford et al. [46] hypothesize
that genes targeted by selection are more likely to be
expressed in tissues that experienced high levels of
morphological divergence during crop improvement.
Onesuchtissueinbarleyistheendospermsinceits
characteristics are the determinants of malting quality
[47]. Since expression of BLZ2 and BPBF is restricted to
the endosperm [12,14] the selection and corresponding
enrichment of only a few favourabl e alleles at these loci
entails an increase in LD. Determining the nucleotide
diversity of these two genes in wild barley would allow
verification of this hypothesis.
The tentative appraisal about the impac t of selection
on the four candidate genes was investigated by calcu-
lating Tajima’ s D. A significant deviation from the
mutation-drift-equilibrium, especially in the two-rowed
subgroup, was observed for t he three candidate genes
that were found to be associated to the target traits. In
Europe, two-rowed barley is the main target for the
improvement of seed quality parameters. This is in
accordance with the significant Tajima D values
obtained for the three loci in this subgroup indicating
footprints of selection on BLZ1, BLZ2 and BPBF.How-
ever, selection might act in different ways: In case of
BLZ2 se lection resulted in the accumula tion of a large
number of low frequency SNP alleles as 61% of the
recorded SNPs have a MAF < 5%. In conjunction with
the extended LD across this gene, this results in the pre-
sence of only one major haplotype for this gene which is
Figure 3 LD decay plot in the surrounding regions of the four candidate genes as a function of genetic distance (in cM). Dots indicate
pairwise comparisons between SNP alleles with minor allele frequency larger 0.05. The curve shows nonlinear regression of r
2
on genetic
distance.
Table 2 Tajima’s D for the candidate genes BLZ1, BLZ2,
BPBF, and HvGAMYB
Candidate gene Total 2-rowed subset 6-rowed subset
BLZ1 2.22* 2.12* ns
BLZ2 ns -2.03* ns
BPBF 2.86** 2.57* 2.74**
HvGAMYB ns ns ns
**: significant at P < 0.01, *: significant at P < 0.05, ns: not significant
Haseneyer et al. BMC Plant Biology 2010, 10:5
/>Page 7 of 11
present in 54% of the accessions. Within the subset of
two-rowed barleys, this haplotype is even more domi-
nant showing a frequency of 88% (see pre vious pra-
graph). In case o f BLZ1 and BPBF, 11% and 23% of the
SNPs show a MAF < 5%. Hence, selection was effective
in the elimination of rare SNP alleles and the accumula-
tion of moderate frequent SNP alleles was promoted.
The indication that these two genes are targeted by bal-
ancing selection is supported by significant Tajima D
values.
The detected marker-trait associations, even for poly-
morphisms explaining only a minor portion of the trait
variation, are attributed to the high statistical power
achieved by (i) exten sive and precise phenotyping of the
target traits as reflected by high heritability estimates
[16], (ii) considering the population structure of the col-
lection and (iii) the high phenotypic variability of the
worldwide collection and the large nucleotide diversity
within the selected candidate genes. However, the power
to detect an association also depends on the number of
accessions in the individual haplotype classes on which
the analysis is b ased. In the analysed collection the high
degree of diversity resulted in prevalence of rare haplo-
types that occurred in less than 5% of accessions and
thus were excluded from the analysis to avoid spurious
associations. Interestingly, most of the phenotypic differ-
ences were found b etween those rare haplotype classes.
Hence, a considerably larger collect ion size or the selec-
tive enrichment of haplotype classes would be needed to
warrant a proper sample size for rare haplotypes as well.
The observed haplotype associations of BLZ1 with
flowering time and plant height corroborate the hypoth-
esis of Vicente-Carbajosa et al. [11] that this gene is
involved in developmental processes and photoperiodic
response. Plei otropic effects of a single gene as observed
for BLZ1 lead to overlapping QTL position estimates for
different traits prov iding a basis for enhancing the effec-
tiveness of marker-assisted selection [48]. Thus, candi-
date gene-based association studies for two or more
traits might substantially contribute to cultivar improve-
ment. However, in the present study, we could not iden-
tify an advantageous haplotype or SNP sites in the
investigated candidate genes comparable to the ones
found in the sh4-d gene in rice, the Q-gene in wheat
and the ppd-H1 gene in barley [49-51]. As the present
candidate genes were described as trans-acti ve regula-
tors for hordein encoding genes [11,12,14,52], we
hypothesize that they influence both grain protein com-
position and protein content and thus are of importance
not only for malting [53] but also for nutrition al quality
[54].
Both, marker-trait and haplotype-trait associations
yielded comparable results. In both approaches signifi-
cant associations of BLZ1 with flowering time and BPBF
with crude protein and starch content were found.
Using haplotypes instead of SNP alleles revealed a
higher number of associations. This shows the higher
sensitivity and statistical power of haplotype-trait
Table 3 Percentage explained variance (%Var), phenoty-
pic means of SNP alleles, and significant (P < 0.05) mar-
ker-trait associations
Candidate gene Site position
1
%Var P -value Means of SNP
alleles
2
(accession classes)
BLZ1 Flowering time [days after sowing]
1733 6.46 0.0033 A: 67.96 C: 69.87
1825 7.38 0.0031 G: 67.96 A: 69.91
1888 6.46 0.0033 C: 67.96 T: 69.87
1890 7.10 0.0017 G: 67.50 A: 69.54
2038 7.52 0.0011 Del: 67.62 AT: 69.68
2520 7.10 0.0017 G: 67.50 A: 69.54
2562 6.46 0.0033 C: 67.96 T: 69.87
2774 7.10 0.0017 T: 67.50 C: 69.54
BPBF Crude protein content [%]
-368 6.65 0.0003 G: 14.85 A: 15.63
-315 5.40 0.0003 T: 14.85 C: 15.63
-303 6.50 0.0003 T: 14.87 A: 15.63
-215 6.86 0.0002 C: 14.86 G: 15.63
-209 6.19 0.0004 A: 14.88 G: 15.63
-166 6.07 0.0003 A: 14.87 G: 15.64
-101 5.38 0.0004 T: 14.88 C: 15.64
-27 4.94 0.0003 C: 14.88 T: 15.65
-3 6.76 0.0002 T: 14.82 C: 15.64
62 4.02 <.0001 T: 14.79 C: 15.66
579 12.40 0.0003 T: 14.90 C: 15.66
586 3.34 0.0025 G: 14.93 A: 15.58
618 3.42 0.0019 A: 14.91 G: 15.58
713 5.45 0.0008 A: 14.88 G: 15.60
797 4.06 0.0029 G: 14.94 T: 15.58
972 4.40 0.0016 G: 14.91 A: 15.59
1026 7.91 0.0019 T: 14.98 G: 15.62
1075 3.51 0.0007 A: 14.91 G: 15.63
1129 5.57 0.0007 C: 14.92 A: 15.63
Starch content [%]
-368 4.44 0.0004 A: 55.58 G: 56.74
-315 7.30 0.0007 C: 55.57 T: 56.66
-303 5.39 0.0002 A: 55.56 T: 56.77
-215 4.41 0.0004 G: 55.58 C: 56.73
-209 4.84 0.0003 G: 55.57 A: 56.74
-166 5.12 0.0001 G: 55.55 A: 56.78
-101 4.79 0.0001 C: 55.53 T: 56.78
-27 4.22 0.0001 T: 55.55 C: 56.79
-3 3.27 0.0008 C: 55.61 T: 56.72
62 0.16 0.0009 C: 55.56 T. 56.70
1: Positions refer to the sequence alignment given in additional file 3
2: All differences between classes for a given site position are significant at P
= 0.0 5
Haseneyer et al. BMC Plant Biology 2010, 10:5
/>Page 8 of 11
associations [55,56] as here accessions are divided in
several classes whereas in marker-trait associ ation only
two classes, representing the two SNP alleles, are con-
sidered. The portion of explained g enetic variance by
SNP sites was in reaso nable agreement with the
explained genetic variance by haplotypes. As would be
expected fo r a quantitative trait, only a small part of the
entire genetic variation could be explained by the varia-
tion occurring at the candidate loci. It follows that the
remaining variation is due to additional loci that also
influence the expression of crude protein content, starch
content, thousand-grain weight, plant height, and flow-
ering time.
With the increasing availability of high-throughput
genoty ping platforms for barley (DArT ar ray [57], oligo-
nucleotide pool assay [58]), estimation of genome-wide
LD decay and whole genome association studies become
a f easibl e alternative to the analysis of candidate genes.
LD studies based on such genotyping data that were
retrieved for a collection of genotypes resulted in a
decay of intrachromosomal LD below r
2
<0.2 within 2.6
cM [59], r
2
<0.15 within 3.2 cM [60] and r
2
<0.5 within
3.9 cM [58], respectively. Complementary to the
decrease in genetic diversity, LD has been shown to
increase from wild barley via landraces to modern culti-
vars [58,61]. Notwithstanding this observation, LD
within cultivated barley is also population dependent so
that comparison of genome-wide LD between collec-
tions composed of accessions with different or igins is
difficult. In our world-wide collection the extent of gen-
ome-wide LD decreases more rapidly than in geographi-
cally restricted collections of domesticated barley
germplasm [58-60]. The chromosomal regions sur-
rounding the four candidate genes display a rapid LD
decay. However, genome wide DNA fingerprinting of
the present population would significantly increase the
knowledge about LD structure in the present collection
and facilitate comparisons to other mapping panels
regarding local LD patterns and trait associations.
Conclusions
Nucleotide diversity a nd LD patterns of BLZ1, BLZ2,
BPBF,andHvGAMYB revealed differences between the
candidate genes and between geographical and morpho-
logical subsets of the collection. This reflects the impact
of selection on the nucleotide sequence of these four
candidate loci.
According t o literature, the four candidate genes
represent transcriptional key regulators in barley. How-
ever, only three of the four selected candidate genes
could b e confirmed by haplotype-trait association stu-
dies. We conclude that there is still an incomplete
knowledge about the expression and interaction of
genes controlling the quantitative traits crude protein
content, starch content, thousand-grain weight, plant
height, and flowering time in barley. Additionally, both
haplotypes and SNPs only explained a part of the
genetic variat ion. Therefore, and in accorda nce with
their quantitative inheritance, we assume that the inves-
tigated seed traits, plant height, and flowering time are
influenced by many additional hitherto unknown factors
each contributing a small part to the expression of the
phenotype.
Although genome-wide as sociation mapping could
provide a more comprehensive picture of loci involved
in the regulation of crude pr otein content, starch con-
tent, thousand-grain weight, flowering time, and plant
height there is a risk of overlooking an association in
genome-wide association studies. As has been demon-
strated in the present study, a gene may contain SNPs
that are associated and others that are not associated
with the trait under consideration. If only one or t wo
SNPs per locus (e.g. EST) would be interrogated as is
presently the case with many SNP marker arrays used
for whole genome scans, it is possible that the “right”
SNP was not included i n the array. On the other hand,
a candidate gene-based approach might suffer from the
limited knowledge about cand idates for a given trait and
hence only a part of the genetic variation for this trait is
captured. Further verification of the observed associa-
tions is difficult owing to the quantitative nature of the
target trait. Moreover, LD decay and hence genetic reso-
lution of t he present population is still insufficient to
preclude that the observed association is not due to the
presence of a physica lly linked gene be ing in LD with
the candidate gene. Notwithstanding this fact, future
Table 4 Haplotype-trait associations (P = 0.05) and percentage explained genetic variance (%Var) of the candidate
genes’ haplotypes
Candidate gene
1
Crude protein content Starch content Thousand-grain weight Flowering time Plant height
%Var Significance
2
%Var Significance %Var Significance %Var Significance %Var Significance
BLZ1 2.65 0.050 - - - - 3.28 0.031 3.05 0.036
BLZ2 - - - - 4.01 0.027 - - - -
BPBF 8.25 0.001 6.02 0.006 - - - - - -
1 Only haplotypes with a frequency greater than 0.0 5 are considered, no association was de tected between haplotypes of HvGAMYB and any of the five traits
Haseneyer et al. BMC Plant Biology 2010, 10:5
/>Page 9 of 11
candidate gene-based approaches will greatly benefit
from the continuous accumulation of knowledge on
gene function and regulation. Because of this and due to
the still insufficient marker coverage of the barley gen-
ome, the candidate gene-based association mapping will
continue to play an important role in barley.
Additional file 1: Accessions under study. Information about origin,
row number, biological status and haplotypes observed for the
candidate genes BLZ1, BLZ2, BPBF and HvGAMYB are given.
Click here for file
[ />S1.XLS ]
Additional file 2: Primer sequences for PCR and sequencing of the
candidate genes, PCR conditions and fragment range. 1: numbers
indicate positions in the nucleotide sequence alignment of the
candidate genes’ haplotypes given in additional file 3.
Click here for file
[ />S2.PDF ]
Additional file 3: Nucleotide sequence alignments of the candidate
gene fragments. Description: Haplotype sequences of BLZ1 (reference =
[GenBank:X80068.1]), BLZ2 (reference = [GenBank:Y10834.1]), BPBF
(reference = [GenBank:AJ000991.1]) and HvGAMYB (reference = [GenBank:
AY008692.1]). The alignment position is relative to the ATG and gaps are
counted. Abbreviations: hpt = haplotype, cds = coding sequence, gene
= genomic sequence (if available).
Click here for file
[ />S3.PDF ]
Additional file 4: Linkage disequilibrium in the surrounding region
of the candidate genes BLZ1 (A), BLZ2 (B), BPBF (C), and HvGAMYB
(D). The position 0.0 cM refers to the candidate gene. The symbols ×
and ◆ indicate sign ificant (P = 0.05) and non significant pairwise
comparisons, respectively.
Click here for file
[ />S4.PDF ]
Additional file 5: Haplotype sequence and marker-trait associations
detected in the four candidate genes BLZ1, BLZ2, BPBF, HvGAMYB.
Significant associations (P = 0.05) are indicated by ‘x’. The traits crude
protein content (CPC), starch content (STR), thousand-grain weight
(TGW), plant height (PH), and flowering time (FT) were considered.
Haplotype frequencies (in %) and minor allele frequencies (MAF, in %)
are given.
Click here for file
[ />S5.XLS ]
Acknowledgements
The authors thank Dr. Christian Paul and Merle Alex (Julius-Kuehn-Institute
Braunschweig-Voelkenrode, Germany) for laboratory and advisory assistance
in the determination of crude protein and starch content by NIRS. We
acknowledge Raj Kishore Pasam and Dr. Benjamin Kilian (IPK Gatersleben,
Germany) for his help and support in the extended LD study. This work was
financed by the German Ministry of Education and Research (BMBF, PTJ-BIO/
0313098).
Author details
1
Leibniz-Institute of Plant Genetics and Crop Plant Research (IPK), Corrensstr.
3, 06466 Gatersleben, Germany.
2
University of Hohenheim, Institute for Crop
Production and Grassland Research (340), Bioinformatics, 70593 Stuttgart,
Germany.
3
Max-Planck Institute for Molecular Genetics, Ihnestr. 73, D-14195
Berlin, Germany.
4
University of Hohenheim, Institute for Plant Breeding, Seed
Science and Population Genetics (350), 70593 Stuttgart, Germany.
5
Plant
Breeding, Centre of Life and Food Sciences Weihenstephan, Technische
Universitaet Muenchen, Am Hochanger 4, 85350 Freising, Germany.
6
Department of Crop Sciences, Quality of Plant Products, University of
Goettingen, Carl-Sprengel-Weg 1, 37075 Goettingen, Germany.
Authors’ contributions
GH carried out the molecular genetic studies, the sequence alignment and
analyses, the statistical association analyses, and drafted the manuscript. SSt
participated in the design and coordination of the study. HPP developed the
concept for the statistical analysis. SSa carried out sequencing of the
candidate genes. HHG and AG participated in the design and coordination
of the study, interpretation of the data and the development of the
manuscript. All authors read and approved the final manuscript.
Received: 14 June 2009
Accepted: 8 January 2010 Published: 8 January 2010
References
1. Flint-Garcia SA, Thuillet AC, Yu J, Pressoir G, Romero SM, Mitchell SE,
Doebley J, Kresovich S, Goodman MM, Buckler ES: Maize association
population: a high-resolution platform for quantitative trait locus
dissection. Plant J 2005, 44:1054-1064.
2. Buckler ES, Thornsberry JM: Plant molecular diversity and applications to
genomics. Curr Opin Plant Biol 2002, 5:107-111.
3. Hirschhorn JN, Daly MJ: Genome-wide association studies for common
diseases and complex traits. Nat Rev Genet 2005, 6:95-108.
4. Pflieger S, Lefebvre V, Causse M: The candidate gene approach in plant
genetics: a review. Mol Breed 2001, 7:275-291.
5. Bartels D, Thompson RD: Synthesis of messenger-RNAs coding for
abundant endosperm proteins during wheat-grain development. Plant
Sci 1986, 46:117-125.
6. Soave C, Salamini F: Organization and regulation of zein genes in maize
endosperm. Philos T Roy Soc B 1984, 304:341-347.
7. Sorensen MB, Cameronmills V, Brandt A: Transcriptional and post-
transcriptional regulation of gene-expression in developing barley
endosperm. Mol Gen Genet 1989, 217:195-201.
8. Hammond-Kosack MC, Holdsworth MJ, Bevan MW: In vivo footprinting of
a low molecular weight glutenin gene (LMWG-1 D1) in wheat
endosperm. Embo J 1993, 12:545-554.
9. Vicente-Carbajosa J, Beritashvili DR, Kraev AS, Skryabin KG: Conserved
structure and organization of B hordein genes in the Hor 2 locus of
barley. Plant Mol Biol 1992, 18:453-458.
10. Zhao Y, Leisy DJ, Okita TW: Tissue-specific expression and temporal
regulation of the rice glutelin Gt3 gene are conferred by at least two
spatially separated cis-regulatory elements. Plant Mol Biol 1994, 25:429-
436.
11. Vicente-Carbajosa J, Onate L, Lara P, Diaz I, Carbonero P: Barley BLZ1: a
bZIP transcriptional activator that interacts with endosperm-specific
gene promoters. Plant J 1998, 13:629-640.
12. Onate L, Vicente-Carbajosa J, Lara P, Diaz I, Carbonero P: Barley BLZ2, a
seed-specific bZIP protein that interacts with BLZ1 in vivo and activates
transcription from the GCN4-like motif of B-hordein promoters in barley
endosperm. J Biol Chem 1999, 274:9175-9182.
13. Diaz I, Vicente-Carbajosa J, Abraham Z, Martinez M, Isabel-La Moneda I,
Carbonero P: The GAMYB protein from barley interacts with the DOF
transcription factor BPBF and activates endosperm-specific genes during
seed development. Plant J
2002, 29:453-464.
14. Mena M, Vicente-Carbajosa J, Schmidt RJ, Carbonero P: An endosperm-
specific DOF protein from barley, highly conserved in wheat, binds to
and activates transcription from the prolamin-box of a native B-hordein
promoter in barley endosperm. Plant J 1998, 16:53-62.
15. Woodger FJ, Gubler F, Pogson BJ, Jacobsen JV: A Mak-like kinase is a
repressor of GAMYB in barley aleurone. Plant J 2003, 33:707-717.
16. Haseneyer G, Stracke S, Paul C, Einfeldt C, Broda A, Piepho H-P, Graner A,
Geiger HH: Population structure and phenotypic variation of a spring
barley world collection set up for association studies. Plant Breeding 2009.
17. Thiel T, Michalek W, Varshney RK, Graner A: Exploiting EST databases for
the development and characterization of gene-derived SSR-markers in
barley (Hordeum vulgare L.). Theor Applied Genet 2003, 106:411-422.
Haseneyer et al. BMC Plant Biology 2010, 10:5
/>Page 10 of 11
18. Falush D, Stephens M, Pritchard JK: Inference of population structure
using multilocus genotype data: linked loci and correlated allele
frequencies. Genetics 2003, 164:1567-1587.
19. Pritchard JK, Stephens M, Donnelly P: Inference of population structure
using multilocus genotype data. Genetics 2000, 155:945-959.
20. Stein N, Herren G, Keller B: A new DNA extraction method for high-
throughput marker analysis in a large-genome species such as Triticum
aestivum. Plant Breeding 2001, 120:354-356.
21. Rozen S, Skaletsky HJ: Primer3 on the WWW for general users and for
biologist programmers. Bioinformatics Methods and Protocols: Methods in
Molecular Biology Humana Press Totowa, NJKrawetz S, Misener S 2002, 365-
386.
22. Sauer S, Reinhardt R, Lehrach H, Gut IG: Single-nucleotide polymorphisms:
analysis by mass spectrometry. Nat Protoc 2006, 1:1761-1771.
23. Nickerson DA, Tobe VO, Taylor SL: PolyPhred: automating the detection
and genotyping of single nucleotide substitutions using fluorescence-
based resequencing. Nucleic Acids Res 1997, 25:2745-2751.
24. Costa JM, Corey A, Hayes PM, Jobet C, Kleinhofs A, Kopisch-Obusch A,
Kramer SF, Kudrna D, Li M, Riera-Lizarazu O, Sato K, Szücs P, Toojinda T,
Vales MI, Wolfe RI: Molecular mapping of the Oregon Wolfe Barleys: a
phenotypically polymorphic doubled-haploid population. Theor Appl
Genet 2001, 103:415-424.
25. Stein N, Prasad M, Scholz U, Thiel T, Zhang H, Wolf M, Kota R, Varshney RK,
Perovic D, Grosse I, Graner A: A 1,000-loci transcript map of the barley
genome: new anchoring points for integrative grass genomics. Theor
Appl Genet 2007, 114:823-839.
26. Haseneyer G, Ravel C, Dardevet M, Balfourier F, Sourdille P, Charmet G,
Brunel D, Sauer S, Geiger HH, Graner A, Stracke S: High level of
conservation between genes coding for the GAMYB transcription factor
in barley (Hordeum vulgare L.) and bread wheat (Triticum aestivum L.)
collections. Theor Appl Genet 2008, 117:321-331.
27. Rozas J, Sanchez-DelBarrio JC, Messeguer X, Rozas R: DnaSP, DNA
polymorphism analyses by the coalescent and other methods.
Bioinformatics 2003, 19:2496-2497.
28. Nei M: Molecular evolutionary genetics. Columbia University Press 1987.
29. Tajima F: Statistical method for testing the neutral mutation hypothesis
by DNA polymorphism. Genetics 1989, 123:585-595.
30. MaizeGenetics.net - Website of the Edward Buckler lab. http://www.
maizegenetics.net/.
31. Hill WG, Robertson A: Linkage disequilibrium in finite populations. Theor
Appl Genet 1968,
38:226-231.
32. Weir BS: Genetic data analysis II. Massachusetts, Sinauer 1996.
33. Sved JA: Linkage disequilibrium and homozygosity of chromosome
segments in finite populations. Theor Popul Biol 1971, 2:125-141.
34. Piepho HP: Stability analysis using the SAS system. Agron J 1999, 91:154-
160.
35. Smith AB, Cullis BR, Gilmour AR: Analysing variety by environment data
using multiplicative mixed models and adjustments for spatial field
trend. Biometrics 2001, 57:1138-1147.
36. Kenward MG, Roger JH: Small sample inference for fixed effects from
restricted maximum likelihood. Biometrics 1997, 53:983-997.
37. Wald A: Tests of statistical hypotheses concerning several parameters
when the number of observations is large. T Am Math Soc 1943, 54:426-
482.
38. Piepho HP: algorithm for a letter-based representation of all-pairwise
comparisons. J Comput Graph Stat 2004, 13:456-466.
39. Holm S: A simple sequentially rejective Bonferroni test procedure. Scand
J Stat 1979, 6:65-70.
40. Fricano A, Rizza F, Faccioli P, Pagani D, Pavan P, Stella A, Rossini L,
Piffanelli P, Cattivelli L: Genetic variants of HvCbf14 are statistically
associated with frost tolerance in a European germplasm collection of
Hordeum vulgare. Theor Appl Genet 2009, 119:1335-48.
41. Henry AM, Manicacci D, Falque M, Damerval C: Molecular evolution of the
Opaque-2 gene in Zea mays L. J Mol Evol 2005, 61:551-558.
42. Eurequa Poland - Principles of barley breeding. />eng/I.2.htm.
43. Charlesworth B, Morgan M, Charlesworth D: The effect of deleterious
mutations on neutral molecular variation. Genetics 1993, 134:1289-1303.
44. Gupta PK, Rustgi S, Kulwal PL: Linkage disequilibrium and association
studies in higher plants: present status and future prospects. Plant Mol
Biol 2005, 57:461-485.
45. Zeder MA, Emshwiller E, Smith BD, Bradley DG: Documenting
domestication: the intersection of genetics and archaeology. Trends
Genet 2006,
22:139-155.
46. Hufford KM, Canaran P, Ware DH, McMullen MD, Gaut BS: Patterns of
selection and tissue-specific expression among maize domestication and
crop improvement loci. Plant Physiol 2007, 144:1642-1653.
47. Brennan CS, Harris N, Smith D, Shewry PR: Structural differences in the
mature endosperms of good and poor malting barley cultivars. J Cereal
Sci 1996, 24:171-177.
48. Han F, Romagosa I, Ullrich SE, Jones BL, Hayes PM, Wesenberg DM:
Molecular marker-assisted selection for malting quality traits in barley.
Mol Breed 1997, 3:427-437.
49. Li C, Zhou A, Sang T: Rice domestication by reducing shattering. Science
2006, 311:1936-1939.
50. Simons KJ, Fellers JP, Trick HN, Zhang Z, Tai YS, Gill BS, Faris JD: Molecular
characterization of the major wheat domestication gene Q. Genetics
2006, 172:547-555.
51. Turner A, Beales J, Faure S, Dunford RP, Laurie DA: The pseudo-response
regulator Ppd-H1 provides adaptation to photoperiod in barley. Science
2005, 310:1031-1034.
52. Gubler F, Watts RJ, Kalla R, Jacobsen JV: GAMyb: A transcription factor
mediating gibberellin-regulated gene expression in aleurone cells of
barley. Plant Physiol 1997, 114:1493-1493.
53. Howard KA, Gayler KR, Eagles HA, Halloran GM: The relationship between
D hordein and malting quality in barley. J Cereal Sci 1996, 24:47-53.
54. Shewry PR, Tatham AS, Halford NG, Barker JH, Hannappel U, Gallois P,
Thomas M, Kreis M: Opportunities for manipulating the seed protein
composition of wheat and barley in order to improve quality. Transgenic
Res 1994, 3:3-12.
55. Cardon LR, Abecasis GR: Using haplotype blocks to map human complex
trait loci. Trends Genet 2003, 19:135-140.
56. Fallin D, Cohen A, Essioux L, Chumakov I, Blumenfeld M, Cohen D,
Schork NJ: Genetic analysis of case/control data using estimated
haplotype frequencies: application to APOE locus variation and
Alzheimer’s disease. Genome Res 2001, 11:143-151.
57. Wenzl P, Carling J, Kudrna D, Jaccoud D, Huttner E, Kleinhofs A, Kilian A:
Diversity arrays technology (DArT) for whole-genome profiling of barley.
Proc Natl Acad Sci USA 2004, 101:9915-9920.
58. Rostoks N, Ramsay L, MacKenzie K, Cardle L, Bhat PR, Roose ML,
Svensson JT, Stein N, Varshney RK, Marshall DF, Graner A, Close TJ,
Waugh R: Recent history of artificial outcrossing facilitates whole-
genome association mapping in elite inbred crop varieties. Proc Natl
Acad Sci USA 2006, 103:18656-18661.
59. Zhang LY, Marchand S, Tinker NA, Belzile F: Population structure and
linkage disequilibrium in barley assessed by DArT markers. Theor Appl
Genet 2009, 119:43-52.
60. Comadran J, Thomas WTB, van Eeuwijk FA, Ceccarelli S, Grando S,
Stanca AM, Pecchioni N, Akar T, Al-Yassin A, Benbelkacem A, Ouabbou H,
Bort J, Romagosa I, Hackett CA, Russell JR: Patterns of genetic diversity
and linkage disequilibrium in a highly structured Hordeum vulgare
association-mapping population for the Mediterranean basin. Theor Appl
Genet 2009, 119:175-187.
61. Morrell PL, Toleno DM, Lundy KE, Clegg MT: Low levels of linkage
disequilibrium in wild barley (Hordeum vulgare ssp. spontaneum) despite
high rates of self-fertilization. Proc Natl Acad Sci USA 2005, 102:2442-2447.
doi:10.1186/1471-2229-10-5
Cite this article as: Haseneyer et al.: DNA polymorphisms and haploty pe
patterns of transcription factors involved in barley endosperm
development are associated with key agronomic traits. BMC Plant
Biology 2010 10:5.
Haseneyer et al. BMC Plant Biology 2010, 10:5
/>Page 11 of 11