báo cáo khoa học: " Single nucleotide polymorphisms for assessing genetic diversity in castor bean (Ricinus communis)" potx
Bạn đang xem bản rút gọn của tài liệu. Xem và tải ngay bản đầy đủ của tài liệu tại đây (2.14 MB, 11 trang )
RESEARC H ARTIC LE Open Access
Single nucleotide polymorphisms for assessing
genetic diversity in castor bean
(Ricinus communis)
Jeffrey T Foster
1
, Gerard J Allan
2
, Agnes P Chan
3
, Pablo D Rabinowicz
3,4,5
, Jacques Ravel
3,4,6
, Paul J Jackson
7
,
Paul Keim
1*
Abstract
Background: Castor bean (Ricinus communis) is an agricultural crop and garden ornamental that is widely
cultivated and has been introduced worldwide. Understanding population structure and the distribution of castor
bean cultivars has been challenging because of limited genetic variability. We analyzed the population genetics of
R. comm unis in a worldwide collection of plants from germplasm and from naturalized populations in Florida, U.S.
To assess genetic diversity we conducted survey sequencing of the genomes of seven diverse cultivars and
compared the data to a reference genom e assembly of a widespread cultivar (Hale). We determined the
population genetic structure of 676 samples using single nucleotide polymorphisms (SNPs) at 48 loci.
Results: Bayesian clustering indicated five main groups worldwide and a repeated pattern of mixed genotypes in
most countries. High levels of population differentiation occurred between most populations but this structure was
not geographically based. Most molecular variance occurred within populations (74%) followed by 22% among
populations, and 4% among continents. Samples from naturalized populations in Florida indicated significant
population structuring consistent with local demes. There was significant population differentiation for 56 of 78
comparisons in Florida (pairwise population j
PT
values, p < 0.01).
Conclusion: Low levels of genetic diversity and mixing of genotypes have led to minimal geographic structuring
of castor bean populations worldwide. Relatively few lineages occur and these are widely distributed. Our
approach of determining population genetic structure using SNPs from genome-wide comparisons constitutes a
framework for high-throughput analyses of genetic diversity in plants, particularly in species with limited genetic
diversity.
Background
Determining the extent and distribution of genetic
diversity is an essential component of plant breeding
strategies. Assessing genetic diversity in plants has
involved increasingly sophisticated approaches, from
ear ly allozyme work, to amplified fragment length poly-
morphisms (AFLPs), and microsatellites. Due to their
multi-allelic states, development of simple sequence
repeats (SSR) or microsatellites is often the best option
for investigating population differentiation, but develop-
ment and genotyping of large numbers of s amples can
be costly and size homoplasy is often a concern [1].
Recently, single nucleotide poly morphisms (SNPs) have
emerged as an increasingly valuable marker system.
SNPs are a viable alternative for assessing population
genetic structure for several reasons. First, as binary,
codominant markers, heterozygosity can be directly
measured. Second, unlike microsatellites their power
comes not from the number of alleles, but from the
large number of loci that can be assessed. Thus, even in
alowdiversityspeciesthegenetic population discrimi-
nation power can be equivalent to the same number of
loci in a genetically diverse species, once the rare SNPs
arediscovered.Third,themoreevolutionaryconserved
nat ure of SNPs makes them less subject to the prob lem
of homoplasy [2]. Finally, SNPs are amenable to high-
* Correspondence:
1
Center for Microbial Genetics and Genomics, Northern Arizona University,
Flagstaff, AZ 86011-4073 USA
Foster et al. BMC Plant Biology 2010, 10:13
/>© 2010 Foster et al; license e BioMed Central Ltd. This is an Open Access article distributed under the terms of the Creative Commons
Attribution License (http: //creativecommons.org/licenses/by/2.0), which permits unrestricted use, distribution, and reproduction in
any medium, prov ided the origina l work is p rope rly cited.
throughput automation, allowing rapid and efficient
genotyping of large numbers of samples [3]. Thus far,
the major obstacle has been to discover rare poly-
morphic sites, but novel sequencing approaches are now
mitigating this issue. In plants, SNP discovery can be
facilitated by using methylation-filtration libraries to
exclude extensive repeat regions, targeting primarily
informative S NPs [4]. Methylation filtration is thus not
a new method but it is not commonly used to target
polymorphic sites in low diversity species and should
serve as a useful tool for other plant species with limited
genetic diversity.
Low genetic variation is a keyfeatureofsomeagro-
economically important crops such as peanuts [5] and
watermelons [6], which have experienced intense selec-
tion for a limited number of specific phenotypes. Loss
of genetic diversity is common in the domes tication
process of many plant species, likely due to populatio n
bottlenecks [ 7]. Castor bean (Ricinus communis L.) is an
agro-economically important species from the Euphor-
biaceae family and appears to have low ge netic diver sity
and no geographically based patterns of genetic related-
ness based on AFLP and SSR studies [8]. Compared
with other crop plants, the genetics of R. communis has
been relatively little studied. However, recent sequencing
efforts have revealed a moderate sized genome (~350
Mb) organized within 10 chromosomes (P. Rabinowicz
et al., unpublished) so in depth studies of castor bean
genetics will be able to rapidly advance.
Castor bean has historically been cultivated as an agri-
cultural crop for the oil derived from its seeds, which has
numerous industrial and cosmetic uses. In fact, castor oil
has a long documented hist ory of use for ointments and
medicines by t he ancient Egyptians and Greeks. World-
wide production of seeds in 2007 was 1.2 million metric
tones, with India, China, and Brazil leading global harvests
[9]. The plants are also grown as ornamentals due to their
prolific growth on poor soils and vibrant leaf and floral
coloration. The species has a worldwide tropical and sub-
tropical distribution, including most of the southern Uni-
ted States. Ricinus communis appears to have originated in
eastern Africa as suggested by the high diversity of plants
in Ethiopia [10,11], but this has not been directly tested.
Plants can be self- or cross-pollinated by wind, with out-
crossing a predominant mode of reproductio n [12,13].
The seeds are highly toxic to humans, pets, and livestock
and are the source of the poison ricin [14]. Castor bean
plants commonly escape cultivation and are found in dis-
turbed sites such as roadsides, stream banks, abandoned
lots, and the edges of agriculture fields, such that the spe-
cies is considered an invasive weed throughout much of
its introduced range [15].
We used high-throughput SNP genotyping to assess
genome-wide diversity and population structure in a
worldwide collection of R. communis samples. The
objectives of this study were five-fold: 1) to test the uti-
lity of SNPs in determining population structure, 2) to
assess worldwide genome diversity in castor b ean using
SNPs; 3) to determine large-scale patterns of introduc-
tion and relatedness among populations; 4) to examine
geographical patterns of genetic v ariation based on
country of origin; and 5) to investigate fine-s cale popu-
lation structure u sing a subset of naturalized popula-
tions distributed across 13 sites from 12 counties in
Florida, U.S.
Results
Our genome-wide assessment of SNP variation in castor
bean revealed relatively low levels of genetic variation.
The 232 high quality SNPs were discovered in 171,003
aligned bases, for a total of 0.13% or 1 SNP every 737
bases. We emphasize, however, that this still represents
a small fraction of the genome, as reads of 98% identity
and 98% read coverage in the Hale genome revealed
15.2 Mb of total sequence before filtering the data set
for SNP discovery. Given that reads with 100% identity
among all 8 cultivars were excluded from this analysis
(because they did no t contain SNPs), it is likely that the
number of SNPs per base is overestimated (at a genome
wide level) and true nucleotide diversity across the gen-
ome is much lower. Nonetheless, these data constitute
substantially more genome coverage than achieved with
previous analyses based on AFLPs and SSRs [8]. Average
observed heterozygosity acr oss all 48 SNPs and popula-
tions was 0.15 and estimated heterozygosity was 0.21
(Table 1). These low levels of g enetic variation are con-
sistent with that identified using AFLPs and SSRs [8].
Nuclear SNP genotypes of the worldwide collection of
germplasm samples (n = 488) were best described by 5
clusters, as determined by the best K value in Stru cture
(Fig. 1). Groupings were not consistent with continental
patterns or country of origin. The AMOVA results
revealed that most of the molecular variance occurred
within populations (74%) followed by 22% among popu-
lations, and 4% among continents, results that are also
consistent with previous work [8]. Despite limited
genetic variation worldwide, few countries showed
groupings where the majority of genotypes were consid-
ered part of the same cluster. For countries with greater
than one sample, only Botswana, El Salvador, Iran, Syria,
USA (Oregon only) and US Virgin Islands had homoge-
neous groupings where all samples from the same coun-
try clustered together. Thus, 39 of 45 coun tries had
samples with genotypes from more than one group.
Furthermore, admixture was common within each sam-
ple, with possible membership in >1 cluster for the
majority of samples. Limiting our grouping results to a
60% threshold for population assignment for each
Foster et al. BMC Plant Biology 2010, 10:13
/>Page 2 of 11
sample provided an alternate depiction of genotype dis-
tributions (Fig. 2). Here, samples from 26 of 38 coun-
tries were ident ified as originating from a single source.
Nonetheless, worldwide populati ons were largely a mix-
ture of genotypes with little geographic structuring.
Consistent with this finding, pairwise population j
PT
values indicate significant population differentiation for
most countries; in a tally of the comparisons 83% (438
of 528) of samples from different populations/countries
were separated at p < 0.01 [Additional file 1]. Genetic
differentiation was not determined by private alleles (an
allele found in only one popula tion), however, because
no alleles were specific to any one population.
Inclusion of samples from Florida w ith the worldwide
sample collection strongly influenced overall Structure
results and only two distinct clusters were indicated
worldwide, with nearly all samples from Florida assigned
to the same group. Analyzed separately, naturalized
populations f rom 13 sites (in 12 counties) throughout
Florida consisted of two distinct population groupings
(Fig. 3). Only two populations, from Hendry and Put-
nam counties, had all samples in the same cluster, indi-
cating widespread introduction and mixi ng of genotypes
in most of the state. Observed heterozygosity was only
0.07, while expected heterozygosity was 0.22 (Table 2).
Themajorityofmolecularvarianceoccurredwithin
populations (84%), rather than among populations
(16%). Nonetheless, pairwise population j
PT
values indi-
cated significant population differentiation; for 56 of 78
compa risons (72%), the different populations were sepa-
rated at p < 0.01 (Table 3). Effects of inbreeding were
apparent in the introduced Florida populations; expected
heterozygosity values (biased) far exceeded observed het-
erozygosity (0.22 vs. 0.07, respectively; F = 0.719 ± 0.018
SE, range 0.555-0.862). Seven samples from five popula-
tions contained at least one private allele within Florida.
The genetic distances for samples from the same site
were spati ally autocorrelated (Ma ntel test, r = 0 .08, P =
0.001), but it was not a linear relationship over geo-
graphic distance (R
2
= 0.006). Assessment of genetic dis-
tances of the 12 populations using Principal Coordinates
Analysis indicated that samples from 11 of the 12 popu-
lations each clustered toget her in a plot containing the
first two axes (data not shown).
Discussion
Our assessment of genome wide diversity in R. communis
suggests that it has low genetic diversity and structure for
all populations that we sampled. Even our upwardly biased
estimate of nucleotide diversity is far less than the average
number of SNPs found in plants such as maize [16]. Low
Table 1 Summary statistics for 48 loci in worldwide
collection of Ricinus communis.
Population n %P Ho He
Afghanistan 11 75 0.11 0.28
Algeria 6 54 0.07 0.25
Argentina 43 96 0.14 0.28
Bahamas 6 60 0.16 0.24
Benin 8 67 0.15 0.25
Botswana 9 42 0.04 0.10
Brazil 41 98 0.18 0.31
Cambodia 8 69 0.18 0.27
China 5 48 0.14 0.12
Costa Rica 5 67 0.19 0.22
Cuba 17 81 0.19 0.29
Ecuador 4 63 0.28 0.23
Egypt 5 63 0.10 0.23
El Salvador 4 44 0.15 0.19
Ethiopia 4 40 0.13 0.13
Greece 2 8 0.05 0.03
Guatemala 8 60 0.11 0.23
Hungary 3 25 0.04 0.10
India 79 94 0.13 0.29
Iran 25 79 0.09 0.24
Israel 5 56 0.19 0.18
Jamaica 6 81 0.15 0.31
Indonesia (Java) 5 44 0.10 0.15
Jordan 5 63 0.21 0.20
Kenya 4 73 0.29 0.27
Madagascar 7 52 0.15 0.18
Mexico 7 69 0.11 0.21
Morocco 5 56 0.15 0.22
Nepal 5 58 0.15 0.21
USA (Oregon) 3 10 0.03 0.05
Pakistan 5 48 0.10 0.17
Panama 8 77 0.29 0.29
Paraguay 8 73 0.11 0.21
Peru 25 88 0.16 0.27
Puerto Rico 7 73 0.24 0.29
Serbia 2 42 0.16 0.20
South Africa 4 54 0.26 0.21
Sri Lanka 2 35 0.08 0.16
Syria 9 73 0.16 0.23
Turkey 50 92 0.15 0.33
Uruguay 8 73 0.28 0.27
US Virgin Islands 8 69 0.19 0.23
Yugoslavia 1 4 0.04 0.02
Zaire 5 63 0.23 0.25
Zanzibar 1 2 0.02 0.01
Mean 11 59 0.15 0.21
%P = Percent of polymorphic loci, He = Expected heterozygote frequency, Ho
= Observed heterozygote frequency.
Foster et al. BMC Plant Biology 2010, 10:13
/>Page 3 of 11
rates of heterozygosity in SNPs found in our study corro-
borate findings of limited worldwide genetic variability
seen with AFLPs and SSRs [8] and argue for local breeding
populations that are highly inbred. Castor bean popula-
tions worldwide clustered into five distinct groups that
were not geographically structured. This is despite the fact
that there were often high levels of pairwise population
differentiation based on country of origin. This suggests
that plants within a particular region m ay have been
derived from multiple sources or introductions, likely due
to human-assisted migration via domestication. Further-
more because plants from an accession or country did not
fall into the same genetic-based cluster, we argue that
multiple sources or introductions to individual countries is
the most plausible explanation for the observed patterns
One alternative hypothesis is that the observed patterns
are due to worldwide gene flow, but we reject this idea
based on the fact that castor bean seeds are gravity
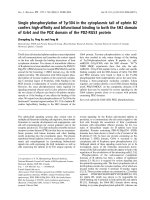
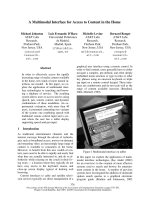
Figure 1 Clustering of samples (n = 488) from program Structure where samples are displayed based on country of origin. Values of K
(number of clusters) ranged from 2 to 5. The most supported model was K = 5; models with lower K values are shown to demonstrate
progression of groupings.
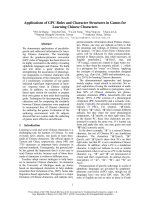
Figure 2 Genotypes of Ricinus communis from nuclear SNPs were best described by five genetic clusters in a worldwide collection of
488 germplasm samples. Group colors correspond to Fig. 1 and circle sizes represent relative number of samples. Samples were only
considered in a particular group if they meet a 60% threshold of group assignment. Thus, not all samples were assigned to a group because
they shared affiliation with several different groups.
Foster et al. BMC Plant Biology 2010, 10:13
/>Page 4 of 11
dispersed rather than bird dispersed; we know of no mor-
phological adapt ations that would assist in long distance
dispersal (e.g., seeds are smooth rather than hooked, or
barbed). We also found no unique alleles in any of the
sampled accessions, which is consistent with a domesti-
cated species in which genetic variation has been reduced.
Limited genetic variation was also observed in plants col-
lected throughout Florida, but lik e t he worldwide germ-
plas m accessions, nearly all populations showed a mix of
genotypes throughout state. Low levels of genetic diversity
in R. communis are consistent with comparable reduced
variation in many cultivated plants [17], such as soybean
[18] and cotton [19]. Conversely, many ornamental species
have relatively high genetic diversity, likely because of
multiple introductions [20-22]. As both a crop and orna-
mental plant, R. communis mayhavelostmuchofits
diversity through cultivation but human-assisted introduc-
tions and seed mixtures from different sources appear to
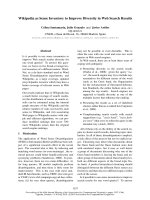
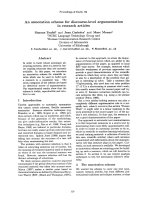
Figure 3 Genotypes of Ricinus communis from nuclear SNPs in a collection (n = 188) from 13 sites in 12 counties of Florida were best
described by two genetic clusters. Inset is a Structure diagram on which map is based. Populations correspond to those from Table 2.
Table 2 Summary statistics for 48 loci in 13 wild populations of Ricinus communis in Florida.
County Population n %P Ho He
Miami-Dade 1 24 83 0.09 0.27
Miami-Dade 2 10 60 0.07 0.21
Palm Beach 3 20 67 0.08 0.24
Hendry 4 9 31 0.06 0.09
Lee 5 12 69 0.08 0.20
Sarasota 6 12 73 0.12 0.26
Highlands 7 9 71 0.05 0.25
Okeechobee 8 8 60 0.09 0.23
Indian River 9 14 77 0.07 0.27
Polk 10 24 73 0.05 0.22
Brevard 11 12 71 0.05 0.26
Orange 12 27 81 0.04 0.27
Putnam 13 7 25 0.03 0.10
Mean 14.5 65 0.07 0.22
n = sample size, %P = Percent of polymorphic loci, He = Expected heterozygote frequency, Ho = Observed heterozygote frequency
Foster et al. BMC Plant Biology 2010, 10:13
/>Page 5 of 11
have maintained this limited diversity in most populations.
Low genetic diversity is likely a consequence of a genetic
bottleneck due to domestication, as seen in a range of
other crops [7]. Alternatively, fragmentation of popula-
tions, subsequent loss of gene flow and the effects o f
genetic drift could also account for loss of heterozygosity
(i.e., the Wahlund Effect [23]), but more research on the
timing of introd uctions is needed to verify these alterna-
tive explanations.
One aspect of working with populations that contain
a mix of diverse genotypes is that they are often difficult
to partition into well- defined groups, even with compu-
tationally rigorous programs such as Structure (i.e.,
Bayesian-based approach) [24,25]. For example, Twito
et al. [24] found that 25 SNPs from gene regions could
be used to accurately assign the correct population in
12 breeds of chicken, but 8 diverse breeds were
excluded from analysis due to difficulties with popula-
tion assignment. Furthermore, our data suggest that
additional SNPs may be necessary for better resolution
of relationships of samples among populations within
countries. Turakulov and Easteal [26] found that at least
65 SNP loci were necessary for definitive population
identification and >100 SNPs were necessary for assign-
ment probabilities over 90% in their sample set.
Although we could assign genotypes to specific group-
ings, additional loci will be needed to increase confi-
dence in assignments, possibly p roviding much clearer
differentiation among populations within country of ori-
gin. Nonetheless, based on the mix ed population struc-
ture observed thus far, it is possible that each
accession/population, no matter how extensively
sampled, will reveal a mixture of genotypes, but t his
remains to be confirmed. Finally, we employed tradi-
tional analytical methods for populatio n genetics, such
as F
ST
comparisons, with some caution due to issues
with non-equilibrium dynamics often associated with
recent introductions of species [27].
The power of SNP discovery using o ur methods
should not be misconstrued as an indication of diversity
in a species that shows low overall genetic diversity; our
SNP discovery found relatively few SNPs desp ite exten-
sive survey of several castor bean genomes (8 total).
Measures of population structure such as Fst (or equiva-
lent analogs) are typically based upon these r are SNPs
and are not directly comparable to u nbiased SNP dis-
covery methods in other species. Theref ore, our results
are not directly comparable with other species for which
SNP markers have been developed (e.g., maize).
Comparison of genetic to geographic distances in nat-
uralized Florida populations indicated spatial structuring
of populations and no evidence of a s equential spread
from a single introduction point. Rather, there also
appears t o have been multiple i ntroductions in Florida.
Local differentiation, however, was present (high j
PT
values) among most of these populations. It appears that
once plants have been introduced, inbreeding occurs
within local demes, as evide nced by the significantly
hig her values of expected vs. observed heterozygosity in
the Florida populations (mean F = 0.719). Gene flow is
not regional, and R. communis is not dispersed widely
after its initial introduction . Therefore, dispersal appears
to be dependent on human introduction, or by limited
escape into nearby disturbed areas, owing to the fact
that the capsules are heavy, and seeds are explosively
and therefore gravity-dispersed only meters from the
parent plant [28]. The mixed mating system in R. com-
munis provides alternate options for reproduction,
which suggests that pollen flow, and hence gene flow
could be extensive among geographically proximal
Table 3 Pairwise population j-PT values from wild Ricinus communis populations in 13 sites in Florida.
12345678910111213
Miami-Dade 1 – 0.255 0.001 0.001 0.019 0.076 0.251 0.007 0.001 0.001 0.009 0.001 0.001
Miami-Dade 2 0.014 – 0.005 0.001 0.044 0.041 0.448 0.003 0.001 0.001 0.011 0.005 0.001
Palm Beach 3 0.091 0.125 – 0.001 0.001 0.002 0.005 0.001 0.001 0.001 0.019 0.001 0.001
Hendry 4 0.235 0.272 0.328 – 0.014 0.001 0.001 0.001 0.001 0.001 0.001 0.001 0.001
Lee 5 0.057 0.053 0.150 0.099 – 0.011 0.183 0.001 0.002 0.434 0.007 0.001 0.001
Sarasota 6 0.035 0.069 0.129 0.332 0.109 – 0.085 0.008 0.008 0.001 0.012 0.001 0.001
Highlands 7 0.015 0.000 0.128 0.153 0.025 0.065 – 0.204 0.004 0.013 0.020 0.048 0.001
Okeechobee 8 0.102 0.163 0.202 0.293 0.155 0.162 0.031 – 0.001 0.001 0.010 0.015 0.016
Indian River 9 0.114 0.147 0.178 0.350 0.126 0.095 0.150 0.220 – 0.001 0.002 0.001 0.001
Polk 10 0.124 0.108 0.208 0.105 0.000 0.174 0.066 0.162 0.167 – 0.001 0.001 0.001
Brevard 11 0.084 0.103 0.089 0.320 0.145 0.103 0.090 0.152 0.127 0.150 – 0.001 0.001
Orange 12 0.076 0.082 0.130 0.257 0.143 0.111 0.054 0.088 0.206 0.154 0.110 – 0.001
Putnam 13 0.360 0.471 0.480 0.635 0.435 0.458 0.324 0.207 0.432 0.369 0.434 0.276 –
j-PT values are below the diagonal, with pairwise comparisons with p < 0.01 in bold. Probability values above the diagonal are based on 999 permutations.
Foster et al. BMC Plant Biology 2010, 10:13
/>Page 6 of 11
populati ons. Indeed, our assessment of gen etic variation
in Florida populations indicates that most accessions are
a mixture of genotypes. However, these p atterns are
again consistent with those observed in germplasm
accessions, suggesting multiple introductions rather than
extensive gene flow among established populations. The
fact that castor bean is capable of self-pollination,
together with the observed high coefficient of inbreeding
also suggests that selfing may be a common reproduc-
tive strategy. However, a more extensive study of levels
of inbreeding within natural populations needs to be
conducted to determine the degree to which castor bean
preferentially self-pollinates versus outcrosses.
Our study represents one of the most extensive geno-
mic studies of worldwide SNP variation in an agricul-
tural plant. With rapidly increasing capabilities in
genome sequencing, this work provides a template for
assessing population structure in non-model organisms
and applying them to plants that have escaped cultiva-
tion. Although chloroplast markers have been effectively
used in studying plant distributions, low effective popu-
lation size in chloroplast DNA and reduced genetic
diversity as c ompared with nuclear DNA makes these
markers less suitable for studying recently established
populations. Despite sequencing of eight chloroplast
genomes for castor bean, few clade-specific SNPs were
identified and only five haplotypes occurred in our
worldwide collection (Rabinowicz et al.unpublished
data). Nuclear SNPs, on the other hand, are more vari-
able, a menable to high throughput genotyping and will
likely be the marker of choice for population-level ana-
lyses of species with sequenced genomes [2]. Although
microsatel lites, which can al so be derive d from
sequenced genomes, provide better resolution with
fewer markers, high homoplasy associated with these
markers can be an issue [29]. SNPs, which typically
exhibit little to no homoplasy, can also be used for map-
ping import ant phe notypic trai ts such as adaptation, oil
production, or disease resistance by targeting and
screening mutations in important genes. Indeed, con-
necting genotypic to phenotypic variation is an impor-
tant next step in R. communis research.
The interplay among natural and artificial sel ection,
invasion success, and biotic conditions are poorly
known for most crops t hat have become naturalized.
Agro-economic and horticultural selection for particular
phenotypes has a strong potential to affect adaptation
and traits a ssociated with becoming naturalized.
Furthermore, population genetic assessment of intro-
duced populations typically involves comparison
between plants in native and introduced ranges [30-33].
Given the suggested origin of R. communis in Ethiopia
[10,11], extensive sampling of plants from wild popula-
tions throughout this region would be necessary to trace
the roots of this species and to compare population
genetic structure before and after introduction. Given its
limited dispersal ability, agronomic utility and ornamen-
tal value it is highly likely that castor bean has become
widespread due to anthropogenic activities, with plant-
ings being restricted to relatively few cultivar accessions.
Human-assisted dispersal has and will likely remain the
primary mode of range ex pansion for castor be an, but it
remains to be determined whe ther naturalized popula-
tions will maintain sufficient genetic variation for retain-
ing the viability and longevity of this agro-economically
important species.
Conclusions
Our study demonstrates the utility of a SNP-based
approach for assessing the population genetics of an
agricultural crop as well as for naturalized populations
[34]. As new sequencing technologies emerge and more
genomes become more available, our approach promises
to be particularly useful for plant population studies due
to the resolving power of SNPs and the ability to rapidly
assess diversity in a large number of samples. However,
plant species with limited genetic diversity such as R.
communis pose particular pro blems for genotyping
efforts regardless of increases in sequencing capabilities.
Furthermore, the recent and global spread of only a few
R. communis cultivars without any apparent geographi-
cal basis suggests that this species does not follow typi-
cal genetic patterns in plant distributions.
Methods
Given the low levels of genetic diversity observed among
cultivars using AFLPs a nd SSRs [8], we adopted a gen-
ome-wide approach to assess genome wide variation
using multilocus SNPs. Because c hloroplast SNPs
showed limited worldwide population differentiation
(Rabinowicz et al., and Hinckle y et al., unpublished
data), we focused on the development of nuclear SNPs.
To this end, we carried out survey sequencing of seven
diverse castor bean genotypes and compared those data
to the reference genome sequence of the common U.S.
cultivar ‘Hale’ (Chan et al. unpublished).
Sample Selection
We obtained seeds primaril y from 152 accessions in the
germplasm collection of the USDA-Agricultural
Research Center in Griffin, Georgia. Our primary goal
was to maximize geographic distribution of samples
without r egard to phenotype. The plants selected how-
ever did represent a broad range of phenotypic variation
including dwarf, common, and large sized varieties, leaf
color range from dark green to crimson , seed sizes ran-
ging from small to large, seed colors including brown,
tan, and reddish-brown, maturation from e arly to late
Foster et al. BMC Plant Biology 2010, 10:13
/>Page 7 of 11
season, and raceme size variation. Differences in oil pro-
duction and oil quality from seeds likely varied but
these were not quantified. All plants are believed to
come from either horticultural or agricultural sources
but this source distinction is not discernable fro m the
USDA Germplasm Resources Information Network
database (GRIN; ).
Tissue sampling
We germinated at least 5 seeds per accession and dried
leaf tissue from plants with successful growth after
approximately 30 da ys. We then extracted total genomic
DNA u sing Qiag en mini plant kits (Qiagen, Valencia,
CA)foreachplantindividually.DNAusedinanalyses
varied in concentration (~1-10 ng/μl), with the majority
of samples standardized to 10 ng/ μl. DNA was also
obtained from plants grown at Lawrence Livermore and
Los Alamos National L aboratori es and was extracted in a
similar manner. Analysis of this worldwide collection
included 488 samples. For samples from naturalized
populations in Florida (n = 188), leaf tissue was taken for
separate DNA extractions from 7-27 individual plants
per site from 12 counties throughout the state. Thus, a
total of 676 individual samples were included in this
study. For a full description of greenhouse and extracti on
methods, see Allan et al. [8] and Hinckley [35].
SNP discovery
The castor bean genome has been sequenced using
wholegenomeshotgunSangerreadsfromplasmidand
fosmid libraries, and the paired-end reads were
assembled using the Celera assembler, reaching a 4×
coverage (Chan et al. unpublished). Genomic reads from
different accessions were obtained by shotgun Sanger
reads from plasmid genomic libraries or methylation fil-
tration libraries [4]. Methylation filtration reduces the
proportion of repetitive DNA in the genomic libr aries
by restricting methylated DNA sequences, which typi-
cally correlate with low-copy sequences in plants.
Briefly, castor bean total D NA was purified from leaves
and was randomly sheared by nebulization, end-repaired
with consecutive BAL31 nuclease and T4 DNA poly-
merase treatments, and 1.5 to 3 kb fragments were
eluted from a 1% low-melting-point agarose gel after
electrophoresis. After ligation to BstXI adapters, DNA
was purified by three rounds of gel electrophoresis to
remove excess adapters, and t he fragments were ligat ed
into the vector pHOS2 (a modified pBR322 vector) line-
arized with BstXI. The pHOS2 plasmid contains two
BstXI cloning sites immediately flanked by sequencing-
primer binding sites. The ligation reactions were intro-
duced by electroporation into E. coli strain GC10 for
regular shotgun libraries or strain DH5a for methylation
filtration libraries.
To address issues of ascertainment bias [36,37] and
maximize our ability to ident ify high quality SNPs, we
sequenced both ends of approximately 2,500 methyla-
tion-filtered (MF) clones[4] from each of seven geneti-
cally distinct cultivars of castor bean (El Salvador,
Ethiopia,Greece,India,Mexico,PuertoRico,andUS
Virgin Islands; in addition to the Hale cultivar) based on
AFLPwork(G.Allan,unpublished).FromtheAFLP
work, genetic distance among these cultivars ranged
from 0.57-0.84 and expected heterozygosity was 0.07-
0.43 (mean = 0.14 ). Ascertainment bias could potentially
be introduc ed if all cultivars wer e closely related, which
would limit the discovery of polymorphisms to the
selected tax a. AFLP and SSR trees are the best available
and independent data for determining genetic diversity
and s electing distantly related cultivars for sequencing.
MF reduces the proportion of methylated repetitive ele-
ments, increasing the chances of finding useful (non-
repetitive) SNPs. An additional 2,500 ra ndom genomic
clones from the Ethiopia cultivar were also included.
SNPs were identified by aligning the sequences from
each cultivar against the Hale genome assemblies using
Nucmer [38]. The SNPs were derived from non-chloro-
plast reads, and represented a single 1-bp mismatch per
read located >30 nucleotides from either end of the
read. Reads that matched multiple locat ions of the Hale
genome were discarded to avoid potential repeat
regions. A total of 454 unique SNP locations were
found on the Hale assemblies. We had the following
requirements for high quality SNPs: reads of ≥500 bp
coverage was 3× or greater, the Phred score for the SNP
and mean scores of 5 base flanking regions were greater
than 30, and a SNP was present in all cultivars. T he
Phred value is a quality score determined by the shape
and resolution of base call peaks in consensus sequences
and a score of 30 indicates 99.9% base call accuracy
[39,40]. The reduce d dataset i ncluded 232 high quality
nuclear SNPs.
SNP Sequencing
Multiplex primers for the 232 nuclear SNPs were gener-
ated in Sequenom iPLEX MassARRAY Typer v3.4 soft-
ware (Sequenom, San Diego, CA). First, we selected the
best multiplex combination using all 232 SNPs. This
created a multiplex assay containing 35 SNPs. SNPs
from the Greece, India, Mexico, and Puerto Rico culti-
vars were underrepresented in this assay, so we then
created a second multiplex of 30 SNP loci using these
cultivars exclusively. Five SNPs were run in both assays,
which provided replication between runs. This provided
Sequenom assays for 60 SNPs [Additional file 2]. SNPs
that were monomorphic or failed to reach an arbitrary
70% threshold in call rate across calls fo r all of the sam-
ples were omitted from the analysis. Our final nuclear
Foster et al. BMC Plant Biology 2010, 10:13
/>Page 8 of 11
data set comprised 48 SNP loci [Additional file 3]. The
SNP markers we used were spread across the R. commu-
nis genome in 47 unique co ntigs ranging in size from
2.5 kb to 133 kb. These sequences have not yet been
genetically mapped to chromosomes but due to size and
number of unique contigs involved we treated the SNPs
as unlinked and distributed across the genome.
Brief ly, the iPLEX reactions use PCR to amplify speci-
fic regions containing a SNP. The primers are mass-
labeled so that each product has a unique mass. During
the extension reaction, a second PCR step, a mass-
labeled nucleotide is then added in the SNP position,
with each nucleotide having a characteristic mass. The
PCR product is placed on a silicon chip, with each sam-
ple affixed to a spot containing the multiplex for all
SNPs. The chip is then run in a mass spectrometer
where the primer mass plus the SNP nucleotide mass is
determine d. In our assay, nucleoti de base calls for SNPs
were exported and assessed in Sequenom Typer Analy-
zer version 3.3. Base calls were automatically determined
and then all plots were manually verified. Ambiguous
calls were given an N in the data to indicate that no
SNP was reliably determined.
To assess the accuracy and dependability of calls, we
ran 3 intraplate controls and had 2 interplate controls
on every plate for each 96-well plate. No discrepancies
occurred with any controls.
Analyses
Our worldwide data set comprised 488 samples from 45
countries, with a mean of 11 samples per country.
Fewer than five samples per country occurred when
either DNA extraction or SNP ana lysis failed. We com-
piled the samples and corresponding base calls for all
SNPs, determined standard genetic statistics such as j
ST
or j
PT
values and analyses of mole cular va riance
(AMOVA) [41] and exported formatted data for subse-
quent analyses using Genalex 6. 1 [42]. For j
PT
values in
particular, we generated pairwise comparisons of popu-
lation differences with 999 data permutations in Gena-
lex, which allows for an estimate that is analogous to
Wright’ sF
ST
combined with a probability value for
population differentiation. Samples were coded based on
country of origin, including samples with different
USDA accession numbers but originating in the same
country. We recognize that this approach may lump
samples from different populations but we are confident
in doing so because our primary analysis method
assumes no aprioriknowledge of gro upings (see pro-
gram Structure below). Samples from the United States
were coded by state. In our AMOVAs, we only consid-
ered samples from localities (countries/states, or coun-
ties; depending on the comparisons) with ≥ 5 records to
maintain confidence in this test. We grouped
populations by geographic region: North America, South
America, Africa, Asia, and Europe. To make regional
sampling more uniform, Iran, Israel, Jordan, Syria, and
Turkey were grouped with Europe; grouping them with
Asia did not affect the results. We also performed a
Mantel test [43] on samples from the wild Florida popu-
lations, in whi ch we compared the pairwise genetic dis-
tance matrix of genotypes to the geographic distance
matr ix. The correlation of the actual data matrices were
then compare d to the correlations for 1000 permuta-
tions between randomized genetic and geographic
matrices to assess significance [42].
We used the program Structure[25] to determine
population differentiation because the pattern and
source of R. communis introductions throughout the
world are unknown. This program employs a Bayesian
approach to modeling geneti c structure and assumes no
aprioriknowledge of the relationship of genotypes, or
number of populations. A series of models are co n-
structed with differen t amounts of population structure
(K) and samples are given a probability of assignment to
a particular population based on their genotype. Model-
ing parameters were as follows: 20,000 burn-in period,
50,000 repetitions per run, an admixture model for
ancestry, and allele frequencies set as independent. Use
of the correlated allele frequen cy model did not notice-
ably affect population assignment of individuals. All
assessments of parameter convergence were s atisfied
with the burn-in and repetition settings.
To increase conf idence in population assignments, we
conducted 10 runs for each value of K from 1-35.
Model log likelihood values within each run rapidly
began to asymptote but failed to reach a definitive maxi-
mum value [25]. Therefore, we determined the most
likely number of populations based on the rate of
change in the log probability of the data [44]. Difficulties
with population assignment arose when the Florida sam-
ples were included as part of the worldwid e compari-
sons. Wi th Florida included, only two clusters were seen
worldwide but with these samples excluded five clusters
were seen. We attribute this to the fact that on the
whole, the Florida samples were relatively homogeneous
when compared to t he rest of the world. Because these
samples represent roughly one quarter of the total sam-
ples, including them had a large effect.
We compiled assignment probabilities for multiple
runs in the program Clumpp, which addresses multi-
modality and/or label-switching in run comparisons
[45]. We used the Greedy algorithm to increase compu-
tational speed, set the pairwise similarity matrix to G’
and ran 1000 random repeats of th e data for th e deter-
mined valued of K. The random repeats allowed us to
assess variability within the final model. We then cre-
ated figures in the graphing program Distruct[46].
Foster et al. BMC Plant Biology 2010, 10:13
/>Page 9 of 11
Methodology was the same for analyses of the Florida
samples, except that we te sted values of K for 1-15 in
Structure and used the Full Search algorithm in
Clump p. For assessment of genotype groupings for each
country (worldwide analysis) or county (Florida analy-
sis), we set a threshold of 60% for assignment of indivi-
duals to a particular cluster as done by Twito et al. [24].
This cluste r value does not represen t the level of relat-
edness based on a genetic cross between two individuals
but rather it is the likelihood of population assignment.
Increasing this threshold led to the majority of samples
not being assigned to any population. At higher thresh-
old values, the remaining points retained the same geo-
graphic patterns, indicating that changing this thres hold
value did not affect the overall results.
Additional file 1: Pairwise population Phi-PT values from a
worldwide germplasm collection. Differentiation of populations based
on country of origin. Countries with fewer than 5 samples were removed
from comparisons. Phi-Pt values are below the diagonal, with pairwise
comparisons where p < 0.01 in bold. Probability values above the
diagonal are based on 999 permutations.
Click here for file
[ />13-S1.DOC ]
Additional file 2: Sequenom PCR primers. List of all primers used for
Sequenom reactions, given in 5’-3’ orientation. Extension primers for
mass spectrometer readings not shown but available upon request. Two
multiplexes were run; five SNPs were run in both multiplexes to allow for
an internal check on assay reliability. Not all assays worked above our
designated threshold so selected SNPs were dropped from analyses.
Click here for file
[ />13-S2.DOC ]
Additional file 3: Locations of 48 SNPs in Ricinus communis.SNP
location is based on contigs from Hale genome assemblies and contig
number matches the R. communis database at JCVI. Mean observed
heterozygosity (Ho) and mean expected heterozygosity (He) based on
dataset of 676 samples, including samples from Florida.
Click here for file
[ />13-S3.DOC ]
Abbreviations
SNP: Single nucleotide polymorphism; AFLP: Amplified fragment length
polymorphism; SSR: Simple sequence repeat; AMOVA: Analysis of molecular
variance.
Acknowledgements
We thank Amber Williams for extensive field, lab, and greenhouse work and
Aubree Hinckley for plant cultivation and sample preparation. Dave Duggan
of the Translational Genomics Research Institute (TGEN) graciously provided
access and resources for Sequenom runs. We thank the following for their
help: Northern Arizona University-Jim Schupp, Casey Donovan; TGEN-
Kathleen Kennedy, Steve Beckstrom-Sternberg, Jill Muehling, Debbie Benitez,
Leslie Marovich, Michelle Knowlton; TIGR- Admasu Melake. The Federal
Bureau of Investigation, Quantico Laboratories, funded this work, with
guidance from Jim Robertson and Mark Wilson.
Author details
1
Center for Microbial Genetics and Genomics, Northern Arizona University,
Flagstaff, AZ 86011-4073 USA.
2
Department of Biological Sciences,
Environmental Genetics and Genomics Laboratory, Northern Arizona
University, Flagstaff, AZ 86011-5640 USA.
3
J. Craig Venter Institute, 9712
Medical Center Drive, Rockville, MD 20850 USA.
4
Institute for Genome
Sciences, University of Maryland School of Medicine, 20 Penn Street,
Baltimore, MD 21201 USA.
5
Department of Biochemistry Molecular Biology,
University of Maryland School of Medicine, 20 Penn Street, Baltimore, MD
21201 USA.
6
Department of Microbiology Immunology, University of
Maryland School of Medicine, 20 Penn Street, Baltimore, MD 21201 USA.
7
Defense Biology Division, Lawrence Livermore National Laboratory,
Livermore, CA 94551 USA.
Authors’ contributions
JTF, GJA, PDR, and PK analyzed the data and wrote the manuscript. PK and
PDR designed the study. APC, PDR, and JR sequenced the cultivars,
generated the methylation-filtration libraries and performed SNP discovery.
PJJ contributed samples and helped draft the manuscript. All authors read
and approved the final manuscript.
Received: 1 June 2009
Accepted: 18 January 2010 Published: 18 January 2010
References
1. Estoup A, Angers B: Microsatellites and minisatellites for molecular
ecology: theoretical and empirical considerations. Advances in Molecular
Ecology Amsterdam: IOS PressCarvalho GR 1998, 55-86.
2. Brumfield RT, Beerli P, Nickerson DA, Edwards SV: The utility of single
nucleotide polymorphisms in inferences of population history. Trends in
Ecology & Evolution 2003, 18:249-256.
3. Tsuchihashi Z, Dracopoli NC: Progress in high-throughput SNP
genotyping methods. The Pharmacogenomics Journal 2002, 2:103-110.
4. Rabinowicz PD, Schutz K, Dedhia N, Yordan C, Parnell LD, Stein L,
McCombie WR, Martienssen RA: Differential methylation of genes and
retrotransposons facilitates shotgun sequencing of the maize genome.
Nature Genetics 1999, 23:305-308.
5. He GH, Prakash CS: Evaluation of genetic relationship among botanical
varieties of cultivated peanut (Arachis hypogaea L.) using AFLP markers.
Genetic Resources and Crop Evolution 2001, 48:347-352.
6. Levi A, Thomas CE, Keinath AP, Wehner TC: Genetic diversity among
watermelon (Citrullus lanatus and Citrullus colocynthis) accessions. Genetic
Resources and Crop Evolution 2001, 48:559-566.
7. Gepts P: Crop domestication as a long-term selection experiment. Plant
Breeding Reviews 2004, 24:1-44.
8. Allan G, Williams A, Rabinowicz PD, Chan AP, Ravel J, Keim P: Worldwide
genotyping of castor bean germplasm (Ricinus communis L.) using AFLPs
and SSRs. Genetic Resources and Crop Evolution 2008, 55 :365-378.
9. Food and Agriculture Organization of the United Nations, FAOSTAT.
.
10. Vavilov NI: The origin, variation, immunity and breeding of cultivated
plants. Waltham, MA: Chronica Botanica 1951.
11. Zeven AC, Zhukovsky PM: Dictionary of Cultivated Plants and Their
Centres of Diversity. Wageningen, Netherlands: Centre for Agricultural
Publishing and Documentation 1975.
12. Brigham R: Natural outcrossing in dwarf-internode castor. Ricinus
communis L. Crop Science 1967, 7:353-355.
13. Meinders HC, Jones MD: Pollen shedding and dispersal in the castor
plant Ricinus communis L. Agronomy Journal 1950, 42:206-209.
14. Poli MA, Roy C, Huebner KD, Franz DR, Jaax NK: Ricin, Chapter 15. Medical
Aspects of Biological Warfare Washington, DC: Borden InstituteDembek ZF
2007.
15. Weber E: Invasive plant species of the world. A reference guide to
environmental weeds.
Wallingford: CABI Publishing 2003.
16. Tenaillon MI, Sawkins MC, Long AD, Gaut RL, Doebley JF, Gaut BS: Patterns
of DNA sequence polymorphism along chromosome 1 of maize (Zea
mays ssp. mays L.). Proceedings of the National Academy of Sciences USA
2001, 98:9161-9166.
17. National Academy of Sciences: Genetic vulnerability of major crops.
Washington, D.C.: National Academy of Sciences 1972.
18. Hyten DL, Song Q, Zhu Y, Choi I-Y, Nelson RL, Costa JM, Specht JE,
Shoemaker RC, Cregan PB: Impacts of genetic bottlenecks on soybean
genome diversity. Proceedings of the National Academy of Sciences USA
2006, 103:16666-16671.
Foster et al. BMC Plant Biology 2010, 10:13
/>Page 10 of 11
19. Van Esbroeck GA, Bowman DT, Calhoun DS, May OL: Changes in the
genetic diversity of cotton in the USA from 1970 to 1995 Crop Science.
1998, 38:33-37.
20. Godt MJW, Hamrick JL: Genetic variation in Lathyrus latifolius
(Leguminosae). American Journal of Botany 1991, 78:1163-1171.
21. Pappert RA, Hamrick JL, Donovan LA: Genetic variation in Pueraria lobata
(Fabaceae), an introduced, clonal, invasive plant of the southeastern
United States. American Journal of Botany 2000, 87:1240-1245.
22. Schierenbeck KA, Hamrick JL, Mack RN: Comparison of allozyme variability
in a native and an introduced species of Lonicera. Heredity 1995, 75:1-9.
23. Wahlund S: Zusammensetzung von populationen und
korrelationserscheinungen vom standpunkt der vererbungslehre
ausbetrachtet. Hereditas 1928, 11:65-106.
24. Twito T, Weigend S, Blum S, Granevitze Z, Feldman MW, Perl-Treves R,
Lavi U, Hillel J: Biodiversity of 20 chicken breeds assessed by SNPs
located in gene regions. Cytogenetic and Genome Research 2007,
117:319-326.
25. Pritchard JK, Stephens M, Donnelly P: Inference of population structure
using multilocus genotype data. Genetics 2000, 155:945-959.
26. Turakulov R, Easteal S: Number of SNPS loci needed to detect population
structure. Human Heredity 2003, 55:37-45.
27. Davies N, Villablanca FX, Roderick GK: Determining the source of
individuals: multilocus genotyping in nonequilibrium population
genetics. Trends in Ecology & Evolution 1999, 14:17-21.
28. Espiírito-Santo MM: Secondary seed dispersal of Ricinus communis
Linnaeus (Euphorbiaceae) by ants in secondary growth vegetation in
Minas gerais. Revista Árvore 2007, 31:1013-1018.
29. Estoup A, Jarne P, Cornuet JM: Homoplasy and mutation model at
microsatellite loci and their consequences for population genetics
analysis. Molecular Ecology 2002, 11:1591-1604.
30. Meekins JF, Ballard HE, McCarthy BC: Genetics variation and molecular
biogeography of a North American invasive plant species (Alliaria
petiolata, Brassicaceae). International Journal of Plant Science 2001,
162:161-169.
31. Saltonstall K: Cryptic invasion by a non-native genotype of the common
reed, Phragmites australis, into North America. Proceedings of the National
Academy of Sciences USA 2002, 99:2445-2449.
32. Weber E, Schmid B: Latitudinal population differentiation in two species
of Solidago (Asteraceae) introduced into Europe. American Journal of
Botany 1998, 85:1110-1121.
33. Novak SJ, Mack RN:
Genetic variation in Bromus tectorum (Poaceae):
comparison between native and introduced populations. Heredity 1993,
71:167-176.
34. Bakker EG, Stahl EA, Toomajian C, Nordborg M, Kreitman M, Bergelson J:
Distribution of genetic variation within and among local populations of
Arabidopsis thaliana over its species range. Molecular Ecology 2006,
15:1405-1418.
35. Hinckley AC: Genotyping and bioforensics of Ricinus communis. Master’s
Thesis University of California, Davis, CA 2006.
36. Nielsen R: Estimation of population parameters and recombination rates
using single nucleotide polymorphisms. Genetics 2000, 154:931-942.
37. Wakeley J, Nielsen R, Liu-Cordero SN, Ardlie K: The discovery of single-
nucleotide polymorphisms and inferences about human demographic
history. American Journal of Human Genetics 2001, 69:1332-1347.
38. Delcher AL, Phillippy A, Carlton J, Salzberg SL: Fast algorithms for large-
scale genome alignment and comparision. Nucleic Acids Research 2002,
30:2478-2483.
39. Ewing B, Green P: Base-calling of automated sequencer traces using
phred. II. Error probabilities. Genome Res 1998, 8:186-194.
40. Ewing B, Hillier L, Wendl MC, Green P: Base-calling of automated
sequencer traces using phred. I. Accuracy assessment. Genome Res 1998,
8:175-185.
41. Excoffier L, Smouse PE, Quattro JM: Analysis of molecular variance
inferred from metric distances among DNA haplotypes: application to
human mitochondrial DNA restriction data. Genetics 1992, 131:479-491.
42. Peakall R, Smouse PE: GENALEX 6: genetic analysis in Excel. Population
genetic software for teaching and research. Molecular Ecology Notes 2006,
6:288-295.
43. Mantel N: The detection of disease clustering and a generalized
regression approach. Cancer Research 1967, 27:209-220.
44. Evanno G, Regnaut S, Goudet J: Detecting the number of clusters of
individuals using the software Structure: a simulation study. Molecular
Ecology 2005, 14:2611-2620.
45. Jakobsson M, Rosenberg NA: CLUMPP: a cluster matching and
permutation program for dealing with label switching and
multimodality in analysis of population structure. Bioinformatics 2007,
23:1801-1806.
46. Rosenberg NA: DISTRUCT: a program for the graphical display of
population structure. Molecular Ecology Notes 2004, 4:137-138.
doi:10.1186/1471-2229-10-13
Cite this article as: Foster et al.: Single nucleotide polymorphisms for
assessing genetic diversity in castor bean
(Ricinus communis). BMC Plant Biology 20 10 10:13.
Submit your next manuscript to BioMed Central
and take full advantage of:
• Convenient online submission
• Thorough peer review
• No space constraints or color figure charges
• Immediate publication on acceptance
• Inclusion in PubMed, CAS, Scopus and Google Scholar
• Research which is freely available for redistribution
Submit your manuscript at
www.biomedcentral.com/submit
Foster et al. BMC Plant Biology 2010, 10:13
/>Page 11 of 11