báo cáo khoa học: " Analysis of gene expression in response to water deficit of chickpea (Cicer arietinum L.) varieties differing in drought tolerance" pps
Bạn đang xem bản rút gọn của tài liệu. Xem và tải ngay bản đầy đủ của tài liệu tại đây (1.72 MB, 14 trang )
RESEA R C H ARTIC L E Open Access
Analysis of gene expression in response to water
deficit of chickpea (Cicer arietinum L.) varieties
differing in drought tolerance
Deepti Jain, Debasis Chattopadhyay
*
Abstract
Background: Chickpea (C. arietinu m L.) ranks third in food legume crop production in the world. However,
drought poses a serious threat to chickpea production, and development of drought-resistant varieties is a
necessity. Unfortunately, cultivated chickpea has a high morphological but narrow genetic diversity, and
understanding the genetic processes of this plant is hindered by the fact that the chickpea genome has not yet
been sequ enced and its EST resources are limited. In this study, two chickpea varieties having contrasting levels of
drought-tolerance were analyzed for differences in transcript profiling during drought stress treatment by
withdrawal of irrigation at different time points. Transcript profiles of ESTs derived from subtractive cDNA libraries
constructed with RNA from whole seedlings of both varieties were analyzed at different stages of stress treatment.
Results: A series of comparisons of transcript abundance between two varieties at different time points were
made. 319 unique ESTs available from different libraries were categorized into eleven clusters according to their
comparative expression profiles. Expression analysis revealed that 70% of the ESTs were more than two fold
abundant in the tolerant cultivar at any point of the stress treatment of which expression of 33% ESTs were more
than two fold high even under the control condition. 53 ESTs that displayed very high fold relative expression in
the tolerant variety were screened for further analysis. These ESTs were clustered in four groups according to their
expression patterns.
Conclusions: Annotation of the highly expressed ESTs in the tolerant cultivar predicted that most of them
encoded proteins involved in cellular org anization, protein metabolism, signal transduction, and transcription.
Results from this study may help in targeting useful genes for improving drought tolerance in chickpea.
Background
Drought continues to be one of the mo st significant
environmental stresses as a result of continuous
decrease i n soil moisture content and increase in global
temperature [1]. Rapid expansion of water-stressed areas
necessitates improvement of crops with traits such as
drought tolerance and adaptation, through conventional
breeding and/or genetic manipulation. For cultivated
crops like chickpea, where improvement through con-
ventional breeding is difficult because of a narrow
genetic base, comparative gene expression profiling is an
alternate way to identify pathways and genes regulating
the stress response [2]. Plants induce expression of a
number of genes in response to water limitation. The
early response at the cellular level results partly from
cell damage, and corresponds partly to adaptive pro-
cesses that initiate changes in the metabolism and struc-
ture of the cell that allows it to function under low
water potential [3]. A wide range of techniques and stra-
tegies are being deployed these days to identify genes
involved in stress responses [4]. But, while the advent of
microarrays and protein profil ing has generated a lot of
information on gene expression during stress response,
conventional gene-by-gene analysis is needed to validate
these claims.
Most of the data on gene expression in plants in
response to drought and other abiotic stresses has been
generated using Arabidopsis [5-7]. However, in view of
the wide genetic diversity that exists in the plant
* Correspondence:
National Institute of Plant Genome Research, Aruna Asaf Ali Marg, New
Delhi-110067, India
Jain and Chattopadhyay BMC Plant Biology 2010, 10:24
/>© 2010 Jain and Chattopadhyay; licensee BioMed Central Ltd. This is a n Open Access article distributed under the terms of the Creative
Commons Attr ibution License (http ://creativecommons.org/licenses/by/2.0), which permits unr estricted use, distribution, and
reproduction in any medium, provided the original work is properly cited.
kingdom, this data may not hold true for other species.
Therefore, individual crop-types should be studied to
understand crop-specific responses to a particular stress.
Among crop plants, cereals are the most studied with
respect to gene expression because of their economic
value and ample resources for research [8-17]. For
example, a comparative gene expression study between
a salt-tolerant and a salt-sensitive rice cultivar has
shown that expression of genes related to protein syn th-
esis and turnover were delayed in the sensitive variety
and were perhaps responsible for the differential
response [18]. However, a recent report suggested that
salt-tolerance was due to the constitutive expression of
some stress responsive genes that in the sensitive variety
were inducible [17]. Transcriptional profiling of develop-
ing maize kernels in response to water deficit indicated
that two classes of stress-responsive genes exist; one
being specific t o concurrent application of stress and
another remains affected after transient stress [19]. A
previous study from our group also indicated that the
dehydration-induced expression of some genes in chick-
pea remain unaffected even after removal of dehydration
stress and may lead to adaptation [20]. All these data
point towards a hypothesis that a plant that is well
adapted to stress has two basic mechanisms of stress-
tolerance; constitutive expression of genes required for
adaptation and quick expression of genes required to
repair cellular damage and physiological re programming
in adverse conditions. Comparative gene expression stu-
dies using cultivars with contrasting stress-tolerance fea-
tures has become a useful tool to identify these two
classes of genes.
In this study chickpea (Cicer arietinum), a pop ular
food legume crop was u sed for analysis of gene expres-
sion under drought stress. Although chickpea is gener-
ally grown in relatively less irrigated lands and some
cultivars adapt well to the water-limited environment
[21], drought poses a serious threat to chickpea produc-
tion causing 40-50% reduction of its yield potential [22].
Lack of adequate genetic and genomic resources impede
progress of crop improvement in chickpea. In one study,
a pulse microarray, containin g about 750 cDNAs from
chickpea, grass-pea and lentil, was used for the analysis
of gene expression in response to water limitation, cold
temperatures, and high salinity, in chickpea cultivars
with contrasting stress-tolerance features [23]. Similarly,
a database was generated f rom an EST library con-
structed by subtractive suppressive hybridization (SSH)
of root tissue of two chickpea cultivars [24]. Compara-
tive proteome maps of chickpea nucleus and cell wall
also revealed differentially expressed proteins during
water-deficit stre ss [25,26]. An exhaustive study on
rapid dehydration-induced 26 bp SuperSAGE tags that
were generated from root EST libraries of untreated and
6 h rapid dehydration-treated chickpea seedli ng has
been reported. In addition, over 7000 Uni Tags having
more than 2.7 fold abundance were identified in the
dehydration libraries. Microarray analysis of 3000 of
them exhibited about 80% congruency with the Super-
SAGE data [27].
We have previously reported 101 ESTs of chickpea
that were up-regulated more than 2 fold in response to
rapid dehydration as compared to control conditions in
the laboratory [20]. Ho wever, drought conditions in the
field are quite different. Furthermore, transcriptional
activation of a particular gene by drought might not b e
directly related to drought tolerance. In this study, the
gene expression of a relatively drought-tolerant and a
drought-sensitive chickpeacultivarwerecomparedin
response to progressive depletion of water. We have
constructed SSH libraries from whole seedlings of the
two cultivars at different stages of water depletion. A
number of genes that express constitutively, as well as
many that were induced quickly after application of
stress in the tolerant cultivar, were identified. Annota-
tion by homology se arch indicated that these genes are
involved in cellular organization, protein metabolism,
signal transduction and transcription.
Results and Discussion
Differential drought tolerance in two chickpea cultivars
A comparison of drought tolerance between two culti-
vated chickpea varieties (Cicer arietinum,cv.
PUSABGD72 and ICCV2) was conducted to establish
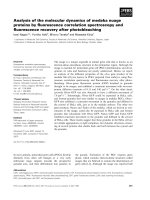
their contrasting characters. The changes in leaf relative
water content (RWC), chlorophyll content, abscisic acid
(ABA) and proline were measured in seedlings grown
for 12 d after germination before stopping irrigation
(drought, DH stress) fo r different time points. RWC is a
measure of stress-adaptation and accounts for osmotic
adjustment, which is considered to be one of the most
important mechanisms for adaptation to water-limited
environmen t in plants. During the treatment both culti-
vars showed a little increase in RWC after 3 d (Figure
1A). This could either be due to increased transport of
water from other compartments of the plant to the leaf
in orde r to maintain turgor, or ma y have resulted from
an osmotic adjustment due to increased synthesis of
osmolytes. After this initial increase, leaf RWC of both
the cultivars showed steep decrease up to the end of
treatment (12 d). However, PUSABGD72 registered
about 10% higher RWC than ICCV2 at the end-point
(Figure 1A). Although the role of proline in stress toler-
ance is debatable, its accumulation is considered to be
one of the indicators of ada ptive response [28,29]. Both
the cultivars showed greater proline content within 3 d
of treatment and maintained the increase up to 12 d.
However, proline accumulation in PUSABGD72 was
Jain and Chattopadhyay BMC Plant Biology 2010, 10:24
/>Page 2 of 14
more than two fold higher than in ICCV2 (Figure 1B).
Chlorophyll content is considered to be the measure of
rate of photosynthesis. This started decreasing with the
initiation of DH in both the cultivars, but better mainte-
nance in the rate of photosynthesis was displayed by
PUSABGD72 throughout the course of stress treatment
(Figure 1C). ABA acts as a key regulator of the dehydra-
tion response [30]. Most of the dehydration-inducible
genes respond to treatment with exogenous ABA [31].
The course of A BA accumulation in both cultivars
followed the same pattern, with PUSABGD72 showing
constitutively higher ABA content than ICCV2. There
was a sharp increase in the accumulation of ABA within
3 d indicating its involvement in early response to stress,
whereas in the later period of treatment, ABA content
was re-adjusted and maintained. Overall, ABA accumu-
lation in PUSABGD72 thro ughout the treatment was 3
fold higher than in ICCV2 (Figure 1D). Taken together
PUSABGD72 displayed a better tolerance to drought
stress than ICCV2 with respect to the above assays.
Figure 1 Comparison of drought tolerance in two chickpea cultivars. Comparative analysis of leaf relative water content (RWC) (A), proline
(B), chlorophyll content (C), and ABA accumulation (D) between two (PUSABGD72, ICCV2) varieties of chickpea in a time dependent manner
under drought stress. All experiments were done in triplicates, and average mean values were plotted against drought stress duration.
Jain and Chattopadhyay BMC Plant Biology 2010, 10:24
/>Page 3 of 14
Cloning and sequencing of chickpea ESTs differentially
expressed during drought stress
Plants perceive and respond to stress. Upon perception
of stress, a signal is communicated to downstream com-
ponents resulting in change of gene expression and
thereby of proteins required for the initial damage-repair
and physiological re-programming for better adaptati on.
Since physiological parameters studied under drought
stress conditions indicated that PUSABGD72 was more
drought-tolerant compared to ICCV2, we intended to
identify the transcripts that were more abundant in the
former. We used subtractive cDNA suppression hybridi-
zation (SSH) technology to clone these transcripts. SSH
is widely used to screen differentially expressed gene s
because of its high efficiency in enriching low expressing
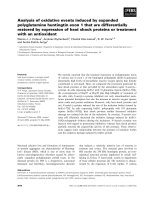
genes and normalization of targeted fragments, Four
subtracted cDNA libraries were const ructed with poly
(A
+
) RNA as described in Me thods (Figure 2). 2700 ran-
domly selected clones from all the libraries were single-
pass sequenced and 319 high-quality unique ESTs were
generated, which were deposited to GenBank. These
were analyzed for putative functional classification by
similarity search in the current GenBan k database using
the BLASTX algorithm. Of these, 312 ESTs showed sig-
nificant similarity to known sequences, while the
remaining 7 ESTs were deemed novel (Additional File
1). Further, 277 could be functionally categorized
according to their BLASTX match and the remaining 35
ESTs of u nknown function along with the 7 novel ESTs
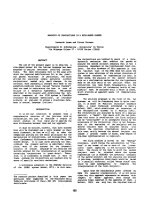
were kept under ‘unclassified’ category. The 277 func-
tionally categorized ESTs represented genes involved i n
metabolism (24%), cellular organization (19%), protein
metabolism (degradation and synthesis) (16%) and signal
transduction (11%) cell defense (7 %), cell transport (2%),
energy metabolism (7%), hormone biosynthesis (3%),
and transcription (5%). The ‘unclassified’ EST clones (as
described above) accounted for 12% (Figure 3). A num-
ber o f ESTs representing known stress-responsive pro-
teins were present in abundance in the librari es,
indicating their high expression in drought stressed
seedlings. Among the most notable are the genes encod-
ing b-amylase (6 clones), MIPS (11 clones), albumin (19
clones), polygalacturonase inhibiting protein (13 clones),
9-cis-e poxycarotenoid dioxygenase (7 clones), chaperons
(like HSPs; 21clones), dehydrins (33 clones), proteases
(35 clones), translation factors (43 clones) and transpor-
ters (29 clones).
Comparative transcript profile of PUSABGD72 with
respect to ICCV2
The expression of 319 unique ESTs obtained from the
SSH l ibraries was analyzed by reverse-northern experi-
ment as described previously [20]. PCR amplified ESTs
were spotted in duplicate on nylon membranes in a 96-
spot format. Chickpea A ctin gene was spotted as a con-
trol for normalization and the kanamycin resistance
gene, NPTII wasusedasthenegativecontrolforback-
ground subtraction. Radio-labeled first strand cDNA
probes prepared using poly (A
+
) RNA isolated from
control/stressed samples of PUSABGD72 or ICCV2
were used for hybridization a nd ESTs expressed differ-
entially in the two cultivars were identified by the
obtained differential hybridization intensities. Expression
of each clone was tested in at lea st three independent
drought stress e xperiments to confirm reproducibility.
Expression ratio was calculated following the methods
described in previous studies [5,20]. Sig nal intensity o f
each spot was normalized by subtracting the intensity of
the negative control (NPTII). Fold expression was pre-
sented as the expression ratio (control/stressed) of
PUSABGD72 to ICCV2 relative t o the ratio of intensity
of Actin . Genes showing ≥ 2 fold higher expression in
PUSABGD72 at any time point in comparison to ICCV2
were considered as differentially expressed and studied
further. Approximately 23%, 42.5%, 55.62% and 53.5% of
theESTsshowedmorethantwo-foldabundancein
PUSABGD72 at control, 3 d, 6 d and 12 d DH condi-
tions respectively. Relatively higher number of ESTs
expressed differentially during DH treatment in
PUSABGD72. 19.5% of all the ESTs showed ≥ 2fold
higher abundance in PUSABGD72 relative to that in
ICCV2 at all the time points. ESTs expressing more in
PUSABG D72 in comparison to ICCV2 at control condi-
tion naturally include drou ght-responsive and non-
responsive genes.
To achieve a comprehensive overview of relative
expression profiles, 319 ESTs were clustered according
to their relative expression patterns in PUSABGD72 in
comparison to ICCV2 by the hierarch ical clustering
method using the correlation coefficient of average link-
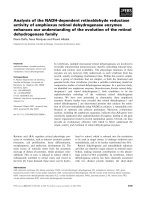
age of the log-transformed ratio [32,33]. SOTA cluster-
ing classified all the ESTs into 11 groups according to
the distance of correlation (Figure 4). The data was
taken in terms of fold expression of ESTs at control or
DH stress in PUSABGD72 relative to that in ICCV2.
The data sets were log-transformed to the base 2 to
normalizethescaleofexpressionandtoreducethe
noise. The clusters with n>6 were used to study t he co-
expression patterns of the genes. Detailed information
on ESTs within each cluster is presented in Additional
File 2 and 3. The ESTs belonging to cluster 1, 10 and
11 particu larly were never found to be exp ressed less in
PUSABGD72 as compared to ICCV2. ESTs of cluster 1
showed equivalent expressions in both the cultivars at
control condition, however, expresse d relatively higher
in PUSABGD72 during DH treatment. Apart from the
ESTs in t he unclassified group, these ESTs are mainly
involved in cellular organization, metaboli sm and
Jain and Chattopadhyay BMC Plant Biology 2010, 10:24
/>Page 4 of 14
Figure 2 Schematic representation of SSH libraries. Schematic representation of five (four from this and one from another study [20])
subtractive cDNA libraries (SSH) prepared with chickpea seedlings.
Jain and Chattopadhyay BMC Plant Biology 2010, 10:24
/>Page 5 of 14
protein translation category. Cluster 10 ESTs exhibited
higher expression i n PUSABGD72 at all the time points
during the DH treatment. Genes related to cellular orga-
nization, metabolism and signal transduction mostly
constitute this cluster. Seven transcription-related and
eighteen protein metabolism-related ESTs are also
included in this cluster that comprises nearly 36% of the
total ESTs. Cluster 11 genes represented those that had
higher expression in PUSABGD72 only at 3 d and at 6
d DH conditions, but were similar to ICCV2 at the later
phase of stress. Important genes to mention in this clus-
ter are several defense related genes such as polygalac-
touronase inhi bitor proteins, MRP like ABC transporter
and genes involved in sugar metabolism and photo-
synthesis. Interestingly, these three clusters included a
lot of genes that showed homology with those encodi ng
ribosomal proteins and translation elongation. This is in
keeping with a previous study that also reported an
early expression of genes involved in protein synthesis
in a salt-tolerant rice variety in response to salt stress
[8]. Genes involved in signal transduction showed a sim-
ple pattern of relative expression. Most of them, present
in cluster 10 (16 ESTs) showed a steady higher
abundance in PUSABGD72 at all time points. Interest-
ingly, three ESTs representing a CBL-interacting protein
kinase, a receptor-like k inase and a phosphoglycerate
kinase showed higher relative expression in
PUSABGD72 only at 6 d DH (cluster 3). Most of the
ESTs that were more abundant in PUSABGD72 repre-
sented functions for cellular organization and metabo-
lism. They displayed complex relative expression
patterns probably because theywereinvolvedindiffer-
ent pathways. The ESTs that belong to the unclassified
groupshowednodistinctclusteringpatterns,which
may be due to their heterologous composition. Com-
parative transcriptome profiling suggested that
PUSABGD72 p ossesses a different g ene expression pat-
tern from ICCV2 under drought stress.
It is already mentioned that about 23% of the ESTs (77
ESTs) showed ≥ 2 fold higher abundance in
PUSABGD72 relative to that in ICCV2 at unstressed
condition. Comparative transcript profiling re vealed that
84% (65 ESTs) of these ESTs expressed more during the
course of DH stress in PUSABGD72 in comparison to
ICCV2. This result indicated that expression of most of
the ESTs in this category is regulated by DH stress.
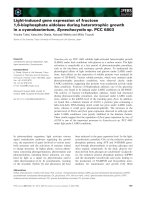
Figure 3 Functional categorization of differentially expressed ESTs. The identified ESTs were assigned with a putative f unction using
BLASTX algorithm and were categorized with known or putative functional annotation. Detail information of each category is given in
Additional File 1.
Jain and Chattopadhyay BMC Plant Biology 2010, 10:24
/>Page 6 of 14
Monitoring expression profiles of selected high
expressing genes
More stringent criteria were applied to shortlist the
genes t hat were s howing drastic expression differences
in the two cultivars. The genes showing ≥ 2foldhigher
relative expression at the unstressed condition and ≥ 3
fold higher relative expression at any point of DH stress
treatment in PUSABGD72 in comparison to ICCV2
were considered. This stringent parameter screened 49
genes (Additional File 4) from the 77 described above.
Eight of these belonged to signal transduction category
e.g. CBL-interacting protein kinase (CIPK) [FL512440],
putative protein kinases [CD051343, CD051317], protein
phosphatase 2C [CD051312], G-protein coupled recep-
tor [CD051322], 14-3-3 protein homolog [ FL512351].
Implication of SOS2-like protein kinases (CIPKs) in pro-
viding abiotic stress tolerance by activating the mem-
brane-b ound transporters is well documented [7,34-36].
Protein phosphatase 2C was shown to interact with
SOS2 and mediate ABA-responsive signals [36,37,48].
Seven genes of transcription factor category mostly
represented AP2-domain containing proteins. Members
of the AP2/EREBP family of transcription factors,
especially those that recognizedrought-responsiveele-
ment (DRE) in target promoters mediate distinct
responses to abiotic stresses such as drought, s alt and
cold [38,39]. Another gene in this group p utatively
encoded a a-NAC transcription factor. NAC belongs to
a family of proteins specific to plants and are found to
play a role i n a diverse set of developmental processes
including formation and maintenance of shoot apical
meristem and floral morphogenesis [40,41]. Overexpres-
sion of a NAC transcription factor in Arabidopsi s up-
regulated several stress-responsive genes in the trans-
genic plants, and thereby conferred drought tolerance
[42]. Zinc finger p roteins [FL512439] are ubiquitous;
some o f them were shown to provide tolerance against
abiotic stresses [43,44]. Six ESTs represented well-
known stress responsive genes encoding ABA-responsive
protein [FL512397], stress activated prot ein [FL512411],
salt tole ranc e proteins [FL512396, FL518936], deh ydra-
tion-induced protein [FL512471]. High expression of ten
genes under cellular organization category was well
understood as they putatively encoded LEAs and dehy-
drins. Higher accumulation of dehydrin mRNA tran-
script in drought tolerant sunflower was associated with
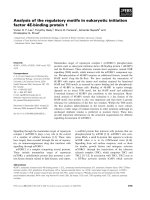
Figure 4 Hierarchical clustering analysis of 319 unique genes based on their gen e expression patterns in PUSABGD72 in comparison
to ICCV2. The 319 differentially expressed chickpea genes were distributed into 11 clusters based on their expression profiles. (A), the SOTA
clustering tree. (B), expression profiles of SOTA clusters. The expression profile of each individual gene in the cluster is denoted by grey line and
the mean expression profile is depicted by pink line. The number of genes in each cluster is given in the left upper corner and the cluster
number is given in the right lower corner. (C), functional characterization of genes in each cluster. Detail information of genes within each
cluster is elaborated in Additional File 2 and 3.
Jain and Chattopadhyay BMC Plant Biology 2010, 10:24
/>Page 7 of 14
cellular turgor maintenance under drought stress [45].
Dehydrin, LEA and proline rich pro teins are thought to
provide stability to other proteins in osmotic stress [3].
High relative expression of six genes related to protein
metabolism corroborates the results of a previous study
with rice cultivars [8].
Overexpression of superoxide dismutase has been
implicated in free radical detoxification and suggested to
have a major ro le in defending the mangrove species
against severe abiotic stresses [46]. Four ESTs were
identified on the basis of early expression upon DH
treatment in PUSABGD72. One of them was a CBL-
interacting protein kinase [FL512472], two represented
ribosomal proteins [FL518931, FL518954] and one was a
leucine rich repeat protein [FL512357] (Additional File
4). Absolute expression of all these 53 ESTs in the two
contrasting cultivars was compared and presented in
Figure 5. These 53 ESTs can be clustered in four groups
according to their expression in the tolerant cultivar
PUSABGD72 (Additional File 5 and 6). 44 out of 53
hig h expressing ESTs belonged to clusters 1 and 4. The
mean curves of these two clusters registered a steady
increase in gene expression from unstressed condition
to the end of DH stress treatment, although, there was a
basic difference between these two clusters. Average
expression intensity of the cluster 4 genes was much
higher than that of the cluster 1 genes and there was
uniformi ty in the expression of the cluster 4 genes. Two
ESTs [FL512394 and FL518992] of the cluster 1 dis-
played a rapid induction at 3 d DH; but their expression
went down bellow their basal expression level at 6 d DH
time point, however, upregulated a gain at 12 d. Their
expression was checked in three different biological
samples i n triplicates by qReal Time-PCR to avoid any
error (Additional File 7). One of these two ESTs
encoded PR-10 protein. Although, the PR proteins are
implicated in cellular defense as they express under
pathogen attack abiotic stresses like drought and salinity
also induce their expression. Stable expression of a pea
PR-10 in Brassica enhanced its germination and growth
in presence of sodium chloride [47]. The other EST
coded for a NAC transcription factor. Interestingly,
most of the ESTs belonging to signal transduction cate-
gory exhibited a steady increase in expression under DH
stress condition from their basal level. Only two of
them, one encoding a protein phosphatase 2C
(CD051312) and the othe r, CBL-interacting protein
kinase (FL5 12472) showed sudde n high expression at 6
d DH and then reduced at 12 d DH. NAF doma ins of
CIPKs were shown to interact with phosphatase 2C
(ABI1 and AB I2) [36,48]. Similar expression pattern of
these ESTs correlates with their mutual interaction.
Except NAC, the other ESTs encoding transcription fac-
tors in this cluster expressed steadily higher t han their
basal level. Five genes of cluster 3 that showed sudden
high expression at 6 d DH condition mostly represent
proteins of unknown function. Another EST of this clus-
ter encoded a putative RNA binding protein and sud-
denly expressed 20 fold high at 6 d DH in PUSABGD72.
Expression of this EST in ICCV2 also followed a similar
pattern, but with a much lower absolute value (Figure
5). Role of a specific glycine-rich RNA binding protein
in regulation of stomata and thereby in abiotic stress
response is already reported [49]. The cluster 2 genes,
that showed a rapid high fold of expression at 3 d DH
and maintained that up to 6 d DH belong to protein
metabolism category. Three of them were related to
protein synthesis (elongation factor, ribosomal proteins),
and exhibited 15-fold high expression early in the DH
treatment. Another represented a factor involved in pro-
tein degradation and expressed about 4 fold higher than
its b asal expression level at 3 d DH. Fold expression of
these genes in the sensitive cultivar ICCV2 at the same
time point was comparatively much lower. Interestingly,
two ESTs representin g elongation factor 1 alpha
(FL518919) and ribosomal protein L18a (FL518931) also
showed early induction in ICCV2, but their absolute
levels of expression were much lower than that in
PUSABGD72 (Figure 5). To validate the results obtained
by reverse northern analysis, RNA accumulation of ten
ESTs (FL512354, FL512338, FL512352, CD051280,
FL512397, CD051326, CD051266, FL512439, FL512463
and FL518919) was monitored in both the cultivars by
northern analysis (Figure 6). Overall, the result of north-
ern blot analysis was in agreement with the expression
data obtained by reverse-northern analysis.
We recently repo rted the funct ional validation of two
chickpea genes corresponding to two differentially
expressed ESTs described in this study; one (FL512440)
codes for a CBL-interacting proteins kinase (CaCIPK6;
GenBank: DQ239702) and anothe r (FL512348) for a
zinc finger protein (CaZF; GenBank: EU513298). Expres-
sion of CaCIPK6 in tobacco and Arabidopsis conferred
improved tol erance against high concen tration of
sodium chloride and mannitol [50]. Ectopic expression
of CaZF improved germination efficiency of transgenic
tobacco in presence of high salinity [51].
Conclusions
To date, a limited number of studies on drought stress-
mediated gene expression in chickpea have been
reported. In this study we described an analysis of gene
expression in chickpea in response to drought stress and
intended to carry out a comparative transcript profiling
between the contrasting chickpea varieties. We focused
on a set of transcripts that exhibited higher abundance
in a drought-tolerant cultivar in comparison to a
drought-sensitive one. We took suppressive subtractive
Jain and Chattopadhyay BMC Plant Biology 2010, 10:24
/>Page 8 of 14
hybridization (SSH) approach to construct the EST
libraries because chickpea EST resources are limited.
We applied water-deficit stress by withdrawal of irriga-
tion for three different periods. This allowed us to per-
form a series o f comparison of transcript abundance
between and within the chickpea varieties at different
time points of stress treatment. Comparative expression
profiles categorized the ESTs in 11 clusters according to
their relative expression patterns. 53 ESTs were identi-
fied on the b asis of their very high fold of relative
expression in the tolerant variety. High fold of abun-
dance of th ese transcripts in the tolerant variety might
be just correlative and establishment of any relation
between this transcript abundance and drought-
tolerance in chickpea is beyond the scope of t he experi-
ments performed in this study. We also do not intend
to comment that the mechanism of drought-tolerance
in chickpea is limited to only transcriptional upregula-
tion of some genes. The purpose of this study was to
compare two contrasting c hickpea varieties and to gen-
erate a resource to i nitiate gene-by-gene analysis for
drought-tolerance mechanism.
The differential expression pattern of the transcripts
observed might be applicable only to these two particu-
lar chickpea varieties used in this study, although the
genes identified on the basis of differential e xpression
patterns corroborate with results from some of the simi-
lar stu dies on other plants [8,52]. In this study, a stress
Figure 5 Hierarchical clustering analysis of 53 selected genes based on their gene expression patterns. Analysis of expression profiles of
53 ESTs (Additional File 4) in PUSABGD72 and ICCV2 with and without water-deficit stress. (A), ESTs were grouped into four clusters based on
their expression profiles in PUSABGD72. The expression profile of individual gene in the cluster is denoted by grey line and the mean expression
profile is depicted by pink line. The number of genes in each cluster is given in the left upper corner and the cluster number is given in the
right lower corner. Detail information of genes within each cluster is elaborated in Additional File 5 and 6. (B), the comparative expression
profiles of 53 ESTs in PUSABGD72 and ICCV2.
Jain and Chattopadhyay BMC Plant Biology 2010, 10:24
/>Page 9 of 14
condition close to field drought was applied. Field
drought is a slow process and the plants go through an
adaptive process in c ontrast to the drastic condition of
rapid dehydration. Furthermore, due to narrow genetic
diversity among the cultivated legume varieties the
genes that express co-incidentally due to DH stress may
be common in both the varieties and, t herefore, might
not have been highlighted in a comparative gene expres-
sion analysis. These might be the reasons for less num-
ber of differentially expressed transcripts detected in our
study in comparison to that in the SAGE analysis [27].
Temperate grain legumes such as pea, fava bean and
lentil share similar gene arrangement with chickpea
[53]. It is, therefore, expected that this data will benefit
the study of the similar grain legume crops. Since the
genes that experience subtle changes in expression in
DH stress might not have been detected due to the
stringent method of construction of SSH cDNA library,
much robust experimentation involving oligonucleotide-
based microarrays supported by enough EST resources
is required for clear understanding.
Methods
Plant materials and stress treatments
Chickpea (Cicer arietinum L. cv PUSABGD72 and
ICCV2) seeds (provided by IARI, New Delhi, India and
ICRISAT, Hyderabad, India respectively) were grown in
3 L pots with composite soil (peat compost to vermicu-
lite,1:1)for12daftergerminationat22±2°Cand50
± 5% relative humidity with a photoperiod of 12 h. Both
the cultivars were grown in the same pot so that they
were exposed to t he same soil mois ture content. The
pots were irrigat ed with 200 ml water everyday . For
drought treatment, soil-grown 12 day-old plants were
subjected to progressive drought by withholding water
for 3, 6, and 12 d respectively. In this period the soil
moisture content decreased from approximately 50% to
approximately 15% at the end of 12 d. As a control,
Figure 6 Northern analysis of selected stress responsive genes . Northern analysis showing expression of ten selected stress responsive
genes [Aquaporin like water channel protein; GenBank: FL512354, Metallothionein; GenBank: FL512338, Proline rich protein; GenBank: FL512352,
P type H
+
ATPase; GenBank: CD051280, Putative ABA response protein; GenBank: FL512397, LEA protein 2; GenBank: CD051326, b-amylase;
GenBank: CD051266, Zn finger protein; GenBank: FL512439, Dehydration responsive element bp3; GenBank: FL512463 and Elongation factor 1
alpha; GenBank: FL518919] in PUSABGD72 and ICCV2. 20 μg of total RNA isolated from control/stressed seedlings of PUSABGD72/ICCV2 were
separated in formaldehyde denaturing gel, transferred to nylon membrane and probed with a
32
P-dCTP labeled amplified cDNA fragments
corresponding to indicated EST clones. An amplified product of chickpea Actin cDNA was used as an internal control and 28S ribosomal RNA
was shown as loading control. Time points in days (d) are indicated.
Jain and Chattopadhyay BMC Plant Biology 2010, 10:24
/>Page 10 of 14
some plants were kept under the same condition for the
same period with watering. Drought stressed plants
were harvested at the same time of the day to avo id
diurnal changes; immediately frozen in liquid nitrogen
and stored at -80°C before RNA isolation. Relative water
contents of the leaves were measured at the correspond-
ing time points following standard method [26].
RNA isolation and construction of subtracted cDNA
library
Total RNA was isolated from the ha rvested seedlings by
using TRIzol Reagent (Life Technologies, Rockville,
MD), and poly (A
+
)RNAwaspurifiedbymRNAisola-
tion kit (Roche Applied Science, Manheim, Germany).
Subtracted cDNA library was constructed by using
CLONTECH PCR-Select cDNA subtraction kit (CLON-
TECH Laboratories, Palo Alto, CA) following the
method provided by the manufacturer. In brief, tester
(C/3 d/6 d/12 d drought PUSABGD72) and driver (C/3
d/6 d/12 d drought ICCV2) double stranded cDNAs
were prepared from poly (A
+
) RNA (2 μg each) sample s.
The cDNAs were digested with RsaI and then ligated to
different adaptors present in the kit. Two rounds of
hybridization and PCR amplification (Advantage 2 PCR
kit, CLONTECH) were performed to normalize and
enrich the differentially expressed c DNAs. The forward
subtracted and enriched DNA fragments were directly
cloned into T/A cloning vector (pGEM-T Easy Vector
Systems, Promega, USA). Competent cells of E. coli
DH5a were prepared by CaCl
2
method and transformed
with the ligation mix and plated on Luria-Bertani (LB)
agar plates containing ampicillin (selection marker),
IPTG, and X-gal for blue-white selection [54]. All the
recombinant clones were pooled to establish the sub-
tracted cDNA library.
Amplification of cDNA inserts
The cDNA insert of individual clones of the subtracted
cDNA library were amplified by polymerase c hain reac-
tion (PCR) (Perkin-Elmer GeneAmp PCR System 9600)
using M13 forward and M13 reverse primers in a 50 μL
reaction with thermo-cycling condition: an initial dena-
turation at 94°C for 10 min, followed by 30 cycle s of 94°
C for 30 s, 60°C for 1 min, 72°C for 2 min and a final
extension at 72°C for 10 min. The PCR products were
analyzed by agarose gel electrophoresis for insert size,
amplification quality and quantity. The positive clones
were then selected for sequencing.
Sequence analysis
The selected positive clones were all single-pass
sequenced using Big Dye Terminator kit version 3.0
(Applied Biosystems, Foster City, CA) and analyzed with
the ABI Prizm 3700 DNA analyzer. The base-calling of
the chromatogram files was performed automatically by
PHRED processing [55] with sequence quality value of
20. Vector sequences were removed by CROSS_-
MATCH , and the
polyA tails were trimmed off by Trimest of EMBOSS
application . Finally, high quality
sequences were selected with base-calling error of ≤ 1%
and reads of ≥ 200 bp. Each edited E ST was searched
against non-redundant protein database o f NCBI http://
www.ncbi.nlm.nih.gov using BLASTX. The default
BLAST parameters were used. Putative functions t o the
ESTs were assigned based on the results of BLASTX
searches. All cDNA fragments are registered in NCBI
EST database. Unique ESTs were selected for further
analysis.
cDNA Macroarray preparation
Purified PCR products were denatured by adding an
equal volume of 0.6 M NaOH. Equal v olume of each
denatured PCR product (≈ 100 ng) of ≥ 200 bp o f size
was spotted on two Hybond N membranes (Amersham
Pharmacia Biotech, Uppsala) using dot-blot apparatus in
96 format to make two identical arrays. In addition,
PCR p roducts of chickpea Actin cDNA [GenBank:
AJ012685] and N eomycin phophotransferase (NPTII)
gene from the vector pCAMBIA 1305.1 [GenBank:
AF354045] were spotted as internal and negative con-
trols respectively to normalize the signals of two repli-
cate blots corresponding to stressed/unstressed chickpea
cultivars and to subtract the background intensity
respectively. The membranes were neutralized with neu-
tralization buffer (0.5 M Tris-HCl , pH 7.4; 1.5 M NaCl)
for 3 min, washed with 2× SSC, and cross-linked by UV
cross linker (Stratagene, La Jolla, CA).
Probe preparation and reverse northern hybridization
cDNAs were labeled with a
32
P-dCTP in the first-strand
reverse transcription o f mRNA. One microgram of
mRNA was labeled in a 20 μL reaction volume contain-
ing 1× reaction buffe r, 2 μgof5’-(dT)
30
VN-3’ (V = A/
G/C and N = A/G/C/T) primer, 2.5 mM dATP, dTTP,
dGTP, 0.02 mM dCTP, 5 μLofa
32
P-dCTP (10 μCi/μL;
3000 μCi/mmol), and 200 units o f reverse transcriptas e
(Superscript II, Life Technologies, Grand Islands, NY).
After incubation at 42°C f or 1 h, mRNA was removed
by incubating with RNaseH (Life Technologies, Grand
Islands, NY) at 37°C for 20 min. Radiolabeled cDNAs
were cleaned by Sephadex G-25 (Amersham-Pharmacia
Biotech) and suspended in hybridization buffer (7% SDS,
0.3 M Sod-phosphate pH 7 .4, 1 mM EDTA, 10 μgof
sonicated salmon sperm DNA). Nylon membranes were
pre-hybridized with the same buffer for 3 h at 65°C and
hybridized with denatured cDNA probes at the same
condition for 24 h. The membranes were washed three
Jain and Chattopadhyay BMC Plant Biology 2010, 10:24
/>Page 11 of 14
times (10 min each) with washing buffer (2XSSC, 0.1%
SDS, 65°C). The replicate membranes were then
exposed t o same storage phosphor screen (Amersham
Biosciences, Piscataway, NJ) for 2 d. Images of the mem-
branes were acquired by scanning with a Typhoon 9210
scanner (Amersham Biosciences).
Data analysis for DNA-array
Data analysis was performed using ImageQuant software
(Molecular Dynamics, Sunnyvale, CA). The radioactive
intensity of each spot was quantified as volume value.
The local background value was subtracted resulting in
the subtracted volume values (sVol). Actin cDNA was
used as the internal control and its subtracted volume
value was designated as sRef. Normalization among all
images w as performed by dividing sVol of each spot by
the sRef value within the same image resulting in a nor-
malized volume value (nVol) for each spot. nVol values
of each EST spot in two identical arrays were compared.
Three independent experiments were conducted to
assess the reproducibility o f the macroarray analysis.
Data presented for the expression profile analysis is an
average of three independent experiments. Expression
profiles of the stress inducible genes were analyzed by
the hierarchical SOTA (Self-organizing tree algorithm)
clustering on the log-transformed-fold induction expres-
sion values across four time points by using MultiEx-
periment Viewer (MEV) Software (The Institute for
Genome Research; />htm) [32].
Northern analysis
TotalRNAwasisolatedfromseedlingsatdifferent
stress time points, separated b y electrophoresis in dena-
turing formaldehyde 1.2% (w/v) agarose gels and trans-
ferred to Hybond-N
+
nylon membrane (GE Healthcare,
Buckinghamshire, UK) following the method mentioned
in Sambr ook et al. (2001) [54]. PCR-amplified individual
cDNA fragment (with primers corresponding to adaptor
1 and 2R used for preparing SSH library) was purified
from agarose gel and used as a probe. Probes were
labeled with a
32
P-dCTP using Megaprime DNA labeling
system (GE Healthcare) and purified through Sephadex
G-25. Northern hybridization, washing and scanning
were performed and band-intensity was calculated by
following the procedure described above for nylon
membrane array.
Determination of relative water content (RWC)
Chickpea leaf tissues were collected and immediately
weighed [fresh weight, FW]. The tissues were rehydrated
in water for 24 h until fully turgid, surface-dried,
reweighed [turgi d weight, TW] followed by oven drying
at 80°C for 48 h, and reweighed [dry weight, DW]. The
RWC was calculated by the following formula: RWC (%)
= (FW-DW/TW-DW) ×100 [56]. The experiment was
carried out in triplicates.
Estimation of abscisic acid, proline, and chlorophyll
ABA content of chickpea seedlings with or without
stress was measured according to Setter et al. (2001)
[57]. Lyophilized seedlings were crushed in c hilled 80%
methanol. The extr acts were fractionated by C18
reverse-phase chromatography, and the ABA-content
was assayed by enzyme linked immunosorbant assay
(ELISA). The ABA-content is expressed as m icrogram
of ABA per gram of dry weight. Free Proline content
was measured as described by Bates et al. (1973) [58].
The tissues were homogenized in 3% aqueous sulfosa-
licylic acid. The homogenate was centrifuged at 9000× g
and the supernatant was collected. The reaction mixture
consisted of 2 ml of supernatant, 2 ml of acid-ninhydrin,
and 2 ml of glacial acetic acid, which was boiled at 100°
C for 1 h. After termination of the reaction on ice, the
reaction mixture was extracted with 4 ml of toluene,
and the absorbance was read at 520 nm. The assays
were done in triplicates usin g corrected weight calcu-
lated for the actual moisture content of tissue at each
time point. For chlorophyll estimation, tissues harvested
at different time points were ground in 80% chilled acet-
one. The supernatant was taken and absorbance was
read at 663 nm, 645 nm and 480 nm and calculated
according to Lichtenthaler et al. (2001) [59]. The experi-
ments were done in triplicates using corrected tissue
weights calculated for actual moisture content of the tis-
sue at the respective time points.
Additional file 1: Functional categorization of ESTs generated by
subtracted cDNA libraries.
Click here for file
[ />24-S1.DOC ]
Additional file 2: Figure showing detail expression profiles of ESTs
within each cluster made by SOTA clustering of fold expression of
319 unique ESTs in PUSABGD72 in comparison to ICCV2.
Click here for file
[ />24-S2.PPT ]
Additional file 3: Table showing detail cluster information made by
SOTA clustering of fold expression of ESTs in PUSABGD72 in
comparison to ICCV2.
Click here for file
[ />24-S3.DOC ]
Additional file 4: Transcript expression profiles of selected 53 genes
in PUSABGD72 seedlings. Transcript expression analysis in response to
drought stress at different time points with the fold-expression values.
[Standard deviations (SD ±) are calculated from three different
experiments. The transcripts are listed according to their putative
functions].
Click here for file
[ />24-S4.DOC ]
Jain and Chattopadhyay BMC Plant Biology 2010, 10:24
/>Page 12 of 14
Additional file 5: Figure showing detail expression profiles of ESTs
within each cluster made by SOTA clustering of fold expression of
53 high expressing ESTs in PUSABGD72.
Click here for file
[ />24-S5.PPT ]
Additional file 6: Table showing detail clustering of 53 high
expressing ESTs according to their expression pattern in
PUSABGD72.
Click here for file
[ />24-S6.DOC ]
Additional file 7: Quantitative Real time-PCR analysis in different
biological samples of PUSABGD72 and ICCV2 showing normalized
fold induction of two ESTs (FL12394, FL518992) upon drought
treatment. The experiment was done in triplicates by taking Actin as an
internal control.
Click here for file
[ />24-S7.PPT ]
Acknowledgements
This work was supported by a research grant received from Council for
Scientific and Industrial Research (CSIR), Government of India. Author s thank
Dr AK Sinha, Dr. Sabhyata Bhatia, NIPGR, India and Dr Indrani Bose, WCU,
USA for editorial support. DJ acknowledges CSIR for research fellowship.
Authors’ contributions
DJ carried out the experimental studies, data acquisition, analysis and
interpretation of data. DC has designed the work and drafted the
manuscript and revised it critically. All authors read and approved the final
manuscript.
Received: 19 March 2009
Accepted: 9 February 2010 Published: 9 February 2010
References
1. Graham PH, Vance CP: Legumes: importance and constraints to greater
use. Plant Physiol 2003, 131(3):872-877.
2. Udupa SM, Robertson LD, Weigand F, Baum M, Kahl G: Allelic variation at
(TAA)n microsatellite loci in a world collection of chickpea (Cicer
arietinum L.) germplasm. Mol Gen Genet 1999, 261(2):354-363.
3. Ingram J, Bartels D: The Molecular Basis of Dehydration Tolerance in
Plants. Annu Rev Plant Physiol Plant Mol Biol 1996, 47:377-403.
4. Cushman JC, Bohnert HJ: Genomic approaches to plant stress tolerance.
Curr Opin Plant Biol 2000, 3(2):117-124.
5. Seki M, Narusaka M, Abe H, Kasuga M, Yamaguchi-Shinozaki K, Carninci P,
Hayashizaki Y, Shinozaki K: Monitoring the expression pattern of 1300
Arabidopsis genes under drought and cold stresses by using a full-
length cDNA microarray. Plant Cell 2001, 13(1):61-72.
6. Thomashow MF: PLANT COLD ACCLIMATION: Freezing Tolerance Genes
and Regulatory Mechanisms. Annu Rev Plant Physiol Plant Mol Biol 1999,
50:571-599.
7. Cheong YH, Chang HS, Gupta R, Wang X, Zhu T, Luan S: Transcriptional
profiling reveals novel interactions between wounding, pathogen,
abiotic stress, and hormonal responses in Arabidopsis. Plant Physiol 2002,
129(2):661-677.
8. Kawasaki S, Borchert C, Deyholos M, Wang H, Brazille S, Kawai K,
Galbraith D, Bohnert HJ: Gene expression profiles during the initial phase
of salt stress in rice. Plant Cell 2001, 13(4):889-905.
9. Ueda A, Shi W, Nakamura T, Takabe T: Analysis of salt-inducible genes in
barley roots by differential display. J Plant Res 2002, 115(1118):119-130.
10. Rabbani MA, Maruyama K, Abe H, Khan MA, Katsura K, Ito Y, Yoshiwara K,
Seki M, Shinozaki K, Yamaguchi-Shinozaki K: Monitoring expression profiles
of rice genes under cold, drought, and high-salinity stresses and abscisic
acid application using cDNA microarray and RNA gel-blot analyses. Plant
Physiol 2003, 133(4):1755-1767.
11. Shiozaki N, Yamada M, Yoshiba Y: Analysis of salt-stress-inducible ESTs
isolated by PCR-subtraction in salt-tolerant rice. Theor Appl Genet 2005,
110(7):1177-1186.
12. Sahi C, Agarwal M, Reddy MK, Sopory SK, Grover A: Isolation and
expression analysis of salt stress-associated ESTs from contrasting rice
cultivars using a PCR-based subtraction method. Theor Appl Genet 2003,
106(4):620-628.
13. Chao DY, Luo YH, Shi M, Luo D, Lin HX: Salt-responsive genes in rice
revealed by cDNA microarray analysis. Cell Res 2005, 15(10):796-810.
14. Walia H, Wilson C, Condamine P, Liu X, Ismail AM, Zeng L, Wanamaker SI,
Mandal J, Xu J, Cui X, et al:
Comparative transcriptional profiling of two
contrasting rice genotypes under salinity stress during the vegetative
growth stage. Plant Physiol 2005, 139(2):822-835.
15. Walia H, Wilson C, Zeng L, Ismail AM, Condamine P, Close TJ: Genome-
wide transcriptional analysis of salinity stressed japonica and indica rice
genotypes during panicle initiation stage. Plant Mol Biol 2007,
63(5):609-623.
16. Zhou J, Wang X, Jiao Y, Qin Y, Liu X, He K, Chen C, Ma L, Wang J, Xiong L,
et al: Global genome expression analysis of rice in response to drought
and high-salinity stresses in shoot, flag leaf, and panicle. Plant Mol Biol
2007, 63(5):591-608.
17. Kumari S, Panjabi Nee Sabharwal V, Kushwaha HR, Sopory SK, Singla-
Pareek SL, Pareek A: Transcriptome map for seedling stage specific
salinity stress response indicates a specific set of genes as candidate for
saline tolerance in Oryza sativa L. Funct Integr Genomics 2009,
9(1):109-123.
18. Yamane K, Kawasaki M, Taniguchi M, Miyake H: Differential effect of NaCl
and polyethylene glycol on the ultrastructure of chloroplasts in rice
seedlings. J Plant Physiol 2003, 160(5):573-575.
19. Yu LX, Setter TL: Comparative transcriptional profiling of placenta and
endosperm in developing maize kernels in response to water deficit.
Plant Physiol 2003, 131(2):568-582.
20. Boominathan P, Shukla R, Kumar A, Manna D, Negi D, Verma PK,
Chattopadhyay D: Long term transcript accumulation during the
development of dehydration adaptation in Cicer arietinum. Plant Physiol
2004, 135(3):1608-1620.
21. Ma Q, Behboudian MH, Turner NC, Palta JA: Gas exchange by pods and
subtending leaves and internal recycling of CO(2) by pods of chickpea
(Cicer arietinum L.) subjected to water deficits. J Exp Bot 2001,
52(354):123-131.
22. Ahmad F, Gaur P, Crosser J: Chickpea (Cicer arietinum L.). Genetic Resources,
Chromosome Engineering and Crop Improvement - Grain Legumes 2005,
1:185-214.
23. Mantri NL, Ford R, Coram TE, Pang EC: Transcriptional profiling of
chickpea genes differentially regulated in response to high-salinity, cold
and drought. BMC Genomics 2007, 8:303.
24. Jayashree B: A legume genomics resource: The Chickpea Root Expressed
Sequence Tag Database. Electronic Journal of Biotechnology 2005, 8.
25. Pandey A, Chakraborty S, Datta A, Chakraborty N: Proteomics approach to
identify dehydration responsive nuclear proteins from chickpea (Cicer
arietinum L.). Mol Cell Proteomics 2008, 7(1):88-107.
26. Bhushan D, Pandey A, Choudhary MK, Datta A, Chakraborty S,
Chakraborty N: Comparative proteomics analysis of differentially
expressed proteins in chickpea extracellular matrix during dehydration
stress. Mol Cell Proteomics 2007, 6(11):1868-1884.
27. Molina C, Rotter B, Horres R, Udupa SM, Besser B, Bellarmino L, Baum M,
Matsumura H, Terauchi R, Kahl G, et al: SuperSAGE: the drought stress-
responsive transcriptome of chickpea roots. BMC Genomics 2008, 9:553.
28. Delauney AJ, Hu CA, Kishor PB, Verma DP: Cloning of ornithine delta-
aminotransferase cDNA from Vigna aconitifolia by trans-
complementation in Escherichia coli and regulation of proline
biosynthesis. J Biol Chem 1993, 268(25):18673-18678.
29. Yoshiba Y, Kiyosue T, Nakashima K, Yamaguchi-Shinozaki K, Shinozaki K:
Regulation of levels of proline as an osmolyte in plants under water
stress. Plant Cell Physiol 1997, 38(10):1095-1102.
30. Skriver K, Mundy J: Gene expression in response to abscisic acid and
osmotic stress. Plant Cell 1990, 2(6):503-512.
31. Shinozaki K, Yamaguchi-Shinozaki K: Molecular responses to drought and
cold stress. Curr Opin Biotechnol 1996, 7(2):161-167.
Jain and Chattopadhyay BMC Plant Biology 2010, 10:24
/>Page 13 of 14
32. Eisen MB, Spellman PT, Brown PO, Botstein D: Cluster analysis and display
of genome-wide expression patterns. Proc Natl Acad Sci USA 1998,
95(25):14863-14868.
33. Mehta PA, Sivaprakash K, Parani M, Venkataraman G, Parida AK: Generation
and analysis of expressed sequence tags from the salt-tolerant
mangrove species Avicennia marina (Forsk) Vierh. Theor Appl Genet 2005,
110(3):416-424.
34. Qiu QS, Guo Y, Quintero FJ, Pardo JM, Schumaker KS, Zhu JK: Regulation of
vacuolar Na+/H+ exchange in Arabidopsis thaliana by the salt-overly-
sensitive (SOS) pathway. J Biol Chem 2004, 279(1):207-215.
35. Gong Z, Koiwa H, Cushman MA, Ray A, Bufford D, Kore-eda S,
Matsumoto TK, Zhu J, Cushman JC, Bressan RA, et al: Genes that are
uniquely stress regulated in salt overly sensitive (sos) mutants. Plant
Physiol 2001, 126(1):363-375.
36. Batelli G, Verslues PE, Agius F, Qiu Q, Fujii H, Pan S, Schumaker KS, Grillo S,
Zhu JK: SOS2 promotes salt tolerance in part by interacting with the
vacuolar H+-ATPase and upregulating its transport activity. Mol Cell Biol
2007, 27(22):7781-7790.
37. Gosti F, Beaudoin N, Serizet C, Webb AA, Vartanian N, Giraudat J: ABI1
protein phosphatase 2C is a negative regulator of abscisic acid
signaling. Plant Cell 1999, 11(10):1897-1910.
38. Yamaguchi-Shinozaki K, Shinozaki K: A novel cis-acting element in an
Arabidopsis gene is involved in responsiveness to drought, low-
temperature, or high-salt stress. Plant Cell 1994, 6(2):251-264.
39. Liu Q, Kasuga M, Sakuma Y, Abe H, Miura S, Yamaguchi-Shinozaki K,
Shinozaki K: Two transcription factors, DREB1 and DREB2, with an EREBP/
AP2 DNA binding domain separate two cellular signal transduction
pathways in drought- and low-temperature-responsive gene expression,
respectively, in Arabidopsis. Plant Cell 1998, 10(8):1391-1406.
40. Kikuchi K, Ueguchi-Tanaka M, Yoshida KT, Nagato Y, Matsusoka M,
Hirano HY: Molecular analysis of the NAC gene family in rice. Mol Gen
Genet 2000, 262(6):1047-1051.
41. Xie Q, Frugis G, Colgan D, Chua NH: Arabidopsis NAC1 transduces auxin
signal downstream of TIR1 to promote lateral root development. Genes
Dev 2000, 14(23):3024-3036.
42. Tran LS, Nakashima K, Sakuma Y, Simpson SD, Fujita Y, Maruyama K,
Fujita M, Seki M, Shinozaki K, Yamaguchi-Shinozaki K: Isolation and
functional analysis of Arabidopsis stress-inducible NAC transcription
factors that bind to a drought-responsive cis-element in the early
responsive to dehydration stress 1 promoter. Plant Cell 2004,
16(9):2481-2498.
43. Davletova S, Schlauch K, Coutu J, Mittler R: The Zinc-Finger Protein Zat12
Plays a Central Role in Reactive Oxygen and Abiotic Stress Signaling in
Arabidopsis. Plant Physiol 2005, 139(2):847-856.
44. Mukhopadhyay A, Vij S, Tyagi AK: Overexpression of a zinc-finger protein
gene from rice confers tolerance to cold, dehydration, and salt stress in
transgenic tobacco. Proc Natl Acad Sci USA 2004,
101(16):6309-6314.
45. Cellier F, Conejero G, Breitler J-C, Casse F: Molecular and Physiological
Responses to Water Deficit in Drought-Tolerant and Drought-Sensitive
Lines of Sunflower. Accumulation of Dehydrin Transcripts Correlates
with Tolerance. Plant Physiol 1998, 116(1):319-328.
46. Yan L, Guizhu C: Physiological adaptability of three mangrove species to
salt stress. Acta Ecologica Sinica 2007, 27(6):2208-2214.
47. Srivastava S, Fristensky B, Kav NN: Constitutive expression of a PR10
protein enhances the germination of Brassica napus under saline
conditions. Plant Cell Physiol 2004, 45(9):1320-1324.
48. Chakraborty N, Ohta M, Zhu JK: Recognition of a PP2C interaction motif
in several plant protein kinases. Methods Mol Biol 2007, 365:287-298.
49. Kim JS, Jung HJ, Lee HJ, Kim KA, Goh CH, Woo Y, Oh SH, Han YS, Kang H:
Glycine-rich RNA-binding protein 7 affects abiotic stress responses by
regulating stomata opening and closing in Arabidopsis thaliana. Plant J
2008, 55(3):455-466.
50. Tripathi V, Parasuraman B, Laxmi A, Chattopadhyay D: CIPK6, a CBL-
interacting protein kinase is required for development and salt
tolerance in plant. Plant J 2009, 58(5):778-90.
51. Jain D, Roy N, Chattopadhyay D: CaZF, a plant transcription factor
functions through and parallel to HOG and calcineurin pathways in
Saccharomyces cerevisiae to provide osmotolerance. PLoS ONE 2009,
4(4):e5154.
52. Kathiresana A, Lafittea HR, Chena J, Mansuetoa L, Bruskiewich R, Bennett J:
Gene expression microarrays and their application in drought stress
research. Field Crops Research 2006, 97(1):101-110.
53. VandenBosch K, Stacey G: Advances in Legume Biology. Plant Physiol 2003,
131(3):839.
54. Sambrook J, Russell D, Sambrook J: Molecular Cloning: A Laboratory
Manual (3-Volume Set). Cold Spring Harbor Laboratory Press 2001.
55. Ewing B, Green P: Base-calling of automated sequencer traces using
phred. II. Error probabilities. Genome Res 1998, 8(3):186-194.
56. de Silva M, Purcell LC, King CA: Soybean Petiole Ureide Response to
Water Deficits and Decreased Transpiration. Crop Sci 1996, 36(3):611-616.
57. Setter TL, Flannigan BA: Water deficit inhibits cell division and expression
of transcripts involved in cell proliferation and endoreduplication in
maize endosperm. J Exp Bot 2001, 52(360):1401-1408.
58. Bates LS, Waldren RP, Teare ID: Rapid determination of free proline for
water-stress studies. Plant and Soil 1973, 39(1):205-207.
59. Lichtenthaler HKBC: Current Protocols in Food Analytical Chemistry John
Wiley & Sons: New York 2001, F4.2.1-F4.2.6.
doi:10.1186/1471-2229-10-24
Cite this article as: Jain and Chattopadhyay: Analysis of gene expression
in response to water deficit of chickpea (Cicer arietinum L.) varieties
differing in drought tolerance. BMC Plant Biology 2010 10:24.
Submit your next manuscript to BioMed Central
and take full advantage of:
• Convenient online submission
• Thorough peer review
• No space constraints or color figure charges
• Immediate publication on acceptance
• Inclusion in PubMed, CAS, Scopus and Google Scholar
• Research which is freely available for redistribution
Submit your manuscript at
www.biomedcentral.com/submit
Jain and Chattopadhyay BMC Plant Biology 2010, 10:24
/>Page 14 of 14