báo cáo khoa học: " Potential chromosomal introgression barriers revealed by linkage analysis in a hybrid of Pinus massoniana and P. hwangshanensis" ppsx
Bạn đang xem bản rút gọn của tài liệu. Xem và tải ngay bản đầy đủ của tài liệu tại đây (294.89 KB, 7 trang )
RESEARC H ARTIC LE Open Access
Potential chromosomal introgression barriers
revealed by linkage analysis in a hybrid of Pinus
massoniana and P. hwangshanensis
Shuxian Li, Ying Chen, Handong Gao, Tongming Yin
*
Abstract
Background: Exploring the genetic mechanisms underlyi ng speciation is a hot topic in modern genetics and
evolutionary studies. Distortion of marker transmission ratio is frequently ascribed to selection against alleles that
cause hybrid incompatibility. The natural introgression between P. massoniana and P. hwangshanensis and their
distribution ranges lead to the emergence of the two speci es as desirable organisms to study the genetic
mechanisms for speciation.
Results: Using seeds sampled from trees at different elevations, we consistently detected sharp decreases in seed
germination rates of trees in the hybrid zone, which might be due largely to the hybrid incompatibility. A genetic
map was established using 192 megagametophytes from a single tree in the hybrid zone of the two species.
Segregation distortion analysis revealed that the percentage of significant-segregation-distortion (SSD) markers was
extremely high, acco unting for more than 25% of the segregating markers. The extension range, the distortion
direction, and the distortion intensity of SSD markers also varied dramatically on different linkage groups.
Conclusions: In this study, we display the potential chromosomal introgression barriers between P. massoniana
and P. hwangshanensis. Our study provides a valuable platform for conducting genome-wide association of hybrid
incompatible QTLs and/or candidate genes with marker transmission ratio distortion in the hybrid.
Background
A biological species is defined as a group of natural
populations that mate and produce offspring with one
another, but do not breed with other populations. Yet
biologists have argued over the details of the definition
since around 1900[1]. Inter-specific hybridization is a
common natural scenario observed both in plants and
animals, which roughly occur s in 10% of animal species
and 2 5% of plant species [2]. Inter-specific mating may
lead to introgression [3]. Introgression can have various
consequences [4]. At one extreme, introgression may
cause merging of the hybridization species; at the other
extreme, introgressio n may lead to selection for conspe-
cific mating, and consequently enlarge the reproductive
isolation [5]. Early studies suggested that hybrids acted
as introgression filters, allowing beneficial genes to filter
through and preven ting introgression of negative genes
[6-8]. Based on these observations, the beneficial genes
would have a higher transmission ratio than the negative
genes in the offspring of the hybrids. Genetic mapping
offers us a powerful tool to display the chromosomal
segments that unevenly transmit to the offspring based
on marker segregation distortion [9].
P. hwangshanensis and P. massoniana are desirable
organisms to study the genetic mechanism triggering
speciation. P. hwangshanensis is a native representative
conifer that distrib utes in the subtropical mountainous
area s in southeast of China, and it is found at hi gher ele-
vation than P. massoniana. The ranges of the two species
are frequently found to be immediately adjacent to each
other,andoverlappedwithanarrowhybridzone.The
two species are different in morphological, cytological
and timber anatomical characteristics, and show clear
environmental and spatial separation [10-13]. Trees in
hybrid zone possess intermediate characteristics. Natural
hybridization between the two species has been verified
* Correspondence:
Jiangsu Key Laboratory for Poplar Germplasm Enhancement and Variety
Improvement, the Key Lab of Forest Genetics and Biotechnology, Nanjing
Forestry University, Nanjing, China
Li et al. BMC Plant Biology 2010, 10:37
/>© 2010 Li et al; licensee BioMed Central Ltd. This is an Open Access article distr ibuted under the terms of the Creative Commons
Attribution License ( which permits unrestricted use, distribution, and reproduction in
any medium, provided the original work is properly cite d.
by molecular markers [14]. The major difference in the
ecological niches of the two species is elevation. With an
increase in elevation, environme ntal factors, such as oxy-
gen partial pressure, air temperature and moisture
regime, soil temperature and w ater regime, sunray and
ultraviolet light intensity, will change [15]. T hese envir-
onmental factors are closely related to plant growth and
fitness. They are environmental stresses to cause differ-
entiation in plant phenology and fitness, subsequently, to
maintain the species-specific characteristics of the alter-
nate speices. For example, with the change in flowering
time, plants will become self-pollinating. Besides diver-
gence in phenology, genetic and cytoplasmic incompat-
ibilities are also important introgression barriers. Genetic
incompatibility between species arises in several ways [3].
For instance, pollen and stigma may possess surface pro-
teins that either prevent fusion of the egg and sperm into
a zygote, or inhibit pollen tube growth to hamper the fer-
tilization of the plant ovum. Alternatively, once a hybrid
zygote is formed, it may have low viability or be sterile
[3]. Genetic barriers may also arise through changes
in the number of chromosomes in new species [3].
P. massoniana and P. hwangshanensis are closely related
species and they both possess 12 haploid chromosomes.
However, there might be some other chrom osomal
changes between the two species, including chromosomal
rearrangement, genome expansion, differential gene
expression and gene silencing. These changes may lead
to selection for fertility and ecological traits that alter the
genome structures of the alternate species, in return act-
ing as introgression barriers [1]. Cytoplasmic incompat-
ibility occurs if the male has an infection that is not
pres ent in his mate, resulting in embryonic mortality [2].
All above mechanisms drive conspecies mating. Both
conspecies mating and selection of beneficial/negative
genes will consequently cause uneven transmission of
geneticmaterialstotheprogenyfromahybridparent
both in intercross (between hybrid siblings) and
backcross (between hybrid and the parental species)
situations. Base on marker segregation distortion and
linkage analysis in the progeny of a hybrid, we can track
the genomic regions that act as intro gression barriers. In
this paper, we aim to reveal the potential chromosomal
introgression barriers between P. massoniana and
P. hwangshanensis by building a genetic map using mega-
gametophytes from a single tree sampled in the hybrid
zone and to identify regions of the map displaying
extreme segregation distortion.
Results
Seed germination test
The germ ination rates of seeds collected from trees along
the transaction lines at different elevations of two differ-
ent locations were listed in table 1. Early empirical
observations revealed that the elevation range of
P. hwangshanensis was generally above 900 m, and that
of P. Massoniana was generally below 700 m in the south
of the Yangzi River in China, the hybrid zone roughly
spanned a vertical range from 700 to 900 m [10-12]. Ger-
mination tests showed t hat seed germination rates of
trees in the range of hybrid zone were signific antly lower
than those of trees sampled outside the hybrid zone.
Although we can not tell whether a tree is a hybrid o r
not merely based on seed germination rate, the consis-
tent low germina tion rates for many trees in hybrid zone
across different locations can not be interpreted by
chance alone. We proposed that low seed germination
rates for trees in hybrid zone should relate to the hybrid
incompatibility. In table 1, there is one tree at 525 m
from Wuyi Mountain that also displays a relatively low
germination rate. In that sampling area, pines dominate
the landscape above 600 m. Below this elevation, pines
mix with abundant broad-leave trees, which will affect
the pine pollination. We propose the drop in this value
might be mainly due to environmental factors. In Table
1, the tree at 795 m in Wuyi Mountain possesses the low-
est seed germination rate in the tested samples. However,
we did not obtain enough seeds that generated normal
seedlings from this tree for it to be used as the mapping
parent. Alternatively, we used megagametophytes of
seeds from the tree at 784 m as our mapping population.
Marker analysis and segregation test
Twenty-one AFLP primer combinations were selected
for this study according to Li et al. [16]. Segregating loci
were recorded based on presence/absence of the visible
alleles. In total, 321 segregating loci were collected from
Table 1 The germination rates of seeds from trees
sampled at different elevations of two locations.
Location 1(Wuyi) Location 2(Qimen)
Elevation
(m)
Germination rate (%) Elevation
(m)
Germination rate (%)
525 25.0 396 75.0
646 64.25 451 73.25
758 14.75 700 32.25
784 13.25 753 30.0
795 2.75 824 35.75
1150 75.0 826 34.25
1205 88.25 830 24.0
1235 85.0 870 24.0
883 33.25
896 42.75
1044 75.25
1081 81.0
Parameters in this table were determined by 400 randomly selected seeds
from each tree at the corresponding elevations.
Li et al. BMC Plant Biology 2010, 10:37
/>Page 2 of 7
these primer combinations, an average of 15.3 loci per
primer pair. Since pines possess gigantic genomes [17],
more selective oligonucleotides are needed to reduce the
amplified loci in AFLP genotyping. The numbers of
selective oligonucleotides used in this study mainly were
E+3/M+4 and E+4/M+3(E: EcoRI;M;MseI;thedigital
numbers were the number of selective nucleotides).
There was considerable variation in the number of seg-
regating loci generated by different primer combina-
tions, ranging from 11 to 33. Based on the Chi-square
test, 82 (25.5%) markers were significantly distorted
from the expected 1:1 segregation ratio at a =0.05sig-
nificance level (corresponding to Chi-square of 3.84).
Among them, 37 skewed to more presence and 45
skewed to more absence. The highest Chi-square value
of SSD markers is 26.39. Since segregation distortion
demonstrates the uneven transmission ratio of alleles on
the alternate chromosomes in the mapping parent and
is related to hybrid incompatibility [18], once these SSD
markers are mapped onto linkage gro ups, the chromo-
somal regions acting as potential introgression barriers
will be revealed.
Linkage Map Construction
Linkage analysis with 192 megagametophytes from the
hybrid pine was performed with all the obtained 321
segregating AFLP markers. In this paper, all markers
that significantly departured from Mendelian segregation
ratio were included because these markers were
hypothesized to reveal sites of hybrid incompatibility.
Using LOD thresholds of 10.0, 7.0, 6.0, 5.0, 4.0, 3.0, 2.0,
321 markers were initially assigned to 19, 18, 16, 16, 16,
9, 3 groups respectively, each run left some ungrouped
markers. When LOD≤ 3.0, there were less linkage
groups than the haploid chromosome numbers of pine;
at LOD = 4.0, 5.0 or 6.0, the same grouping results were
derived. Therefore LOD = 6.0 was used to assign mar-
kers into linkage groups. Under this criterion, markers
were assigned to 14 major linkage groups, 1 triplet, 1
doublet, and 4 unlinked markers. The major linkage
groups ranged from 26.9 to 177.9 cM in size (Additional
file 1). We did not achieve complete coverage of the
pine genome with this map. By gradually decreasing the
LOD to 2.0, no strong linkage was detected between the
markers that mapped at linkage group ends. Although
some loose linkage was observed between markers at
the ends of different linkage groups, we did not merge
these linkage groups because the loose linkage between
markers might have occurred by chance alone. In con-
clusion, the established map consisted of 14 major link-
age groups with a total observed genetic length of
1615.6 cM. Genetic length derived from this study was
very close to that of P. sylvestris [19] and P. taeda [20],
both of which were estimated by nearly complete
genetic maps. Based on the functio n (Formula 1 in
Methods) given by Lange and Boehnke [21], if we esti-
mated the genetic length of pine ranging from
1500~2000 cM, the estimated coverage of our map
would be 95.83~98.62% of the total pine genome, at 10
cM a mar ker. Therefore, our map achieved nearly com-
plete coverage of the pine genome. The unfilled gaps of
this map might be d ue to presence of recombination
hotspots or EcoRI/MseI restriction deserts in the corre-
sponding genomic regions. Tremendous effort might be
needed to fill such gaps with randomly generated mar-
kers. The 14 major linkage groups consisted of 312 mar-
kers with an average distance of 5.18 cM betwe en the
adjacent markers. The established map provides a useful
platform for demonstrating the potential chromosomal
introgression barriers, and for exploring their expansion
ranges on different chromosomes.
Potential Chromosomal introgression barriers
Early mapping studies in pine and poplar revealed that
the percentage of SSD markers commonly accounted for
less than 10% of the segregating markers [19,22,23]. In
this study, percentage of SSD markers was found to be
extremely high, accounting for more than 25% of the
segregating loci, which implied extensive hybrid i ncom-
patibilities between the alternate species. The genomic
regions, the expansion range, and the distorted direction
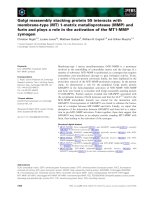
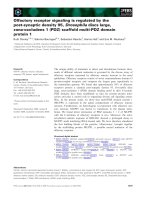
of these markers were displayed in Figure 1. In this fig-
ure, 82 SSD markers were mapped onto 12 linkage
groups, including 11 major linkage groups and a triplet.
Only one SSD marker remained unlinked. Furthermore,
SSD markers were found to be clustered (regions con-
tained three or more SSD markers in a row) on six of
the major linkage groups. These SSD marker clusters
totally covered 206.7 cM, accounting for 12.8% of the
total observed genetic length. Some of these clusters
were found to extend to large regions on the corre-
spondi ng linkage groups, for example, on linkage group
2, it at least covered a genetic length of 59 cM (more
than 30% of the genetic length of this linkage group); on
linkage group 12, it extended to a genetic length about
46 cM (about 65% of the observed length of this linkage
group). Recombination will relax the segregation distor-
tion of a marker caused by its linkage with deleterious
genes. Under the observed highest sel ection intensity,
the expansion range of each segregation distortion clus-
ter was estimated by using algorit hm 6 in the Methods.
It was notewor thy that t he observed expansion ranges
were much larger than the estimated expansion ranges
on mo st of the linkage groups (Table 2). Since the
expansion range was estimated by having the prior that
only one locus caused segregation distortion in each
SSD cluster, these inconsistencies implied the expansion
ranges of most SSD cluste rs might be triggered by more
Li et al. BMC Plant Biology 2010, 10:37
/>Page 3 of 7
than one genetic locus, besides, inter-chromosomal epi-
static effect might also play a role in the observed
inconsistencies.
Discussion
Speciation of P. massoniana and P. hwangshanensis
might be the result of parapatric speciation process.
Parapatric speciation is one of the evolutionary pro-
cesses underlying speciation. Then grass species
Anthoxanthum has been known to undergo parapatric
speci ation as mine contamination of an area, wh ich cre-
ates a selection pressure for tolerance to metals [24].
The main difference between parapatric speciation and
sympatric speciation is that, in the former case, two spe-
cies occupy separate ecological niches and overlap with
a narrow hybrid zone. However, during evolutionary
time, P. massoniana and P. hwangshanensis might distri-
bute in separate ranges, thus we can not e xclude the
Figure 1 The distribution, the distortion direction, and the distortion intensity of SSD markers on the established linkage groups. The
vertical rulers at the left indicate the genetic lengths of the linkage groups in cM. The horizontal rulers at the bottom of each linkage group are
the chi-square rulers indicating the distortion intensity. In the chart of each linkage group, the left and the right vertical bars corresponding to
the Chi-square value of 3.84, which is the statistical criterion to indicate that the segregation distortion does not occur by chance alone; the
middle vertical bar corresponding to Chi-square value of 0.00; horizontal bars on each linkage group are used to indicate the position, the
distortion direction, and the distortion intensity of the mapped markers; horizontal bars at the left of each middle vertical bar indicate more
absence of the visible alleles; horizontal bars at the right of each middle vertical bar indicate more presence of the visible alleles.
Li et al. BMC Plant Biology 2010, 10:37
/>Page 4 of 7
hypothesis that their speciation could be due to histori-
cal geographic barriers. Although the speciation process
of P. m assoniana and P. hwangshanensis is debatable,
their ranges and their natural gene introgression ma ke
them valuable organisms t o exploring the genetic
mechanism underlying speciation. Natural recombinants
found in hybrid zones will permit genetic mapping of
species differences and reproductive barriers in non-
model organisms [1] . Pines possess gigantic genomes,
which are a bout 10 fold that of the human genome and
about40foldthatofthepoplargenome.Although
sequence capacity has increased dramatically with the
advent of the next generation sequencing technology,
whole genome sequencing for organisms with such huge
genomes is not feasible in the near future. In contrast to
their huge physical length, genetic lengths of pine gen-
omes were found to be modest which ranged approxi-
mately from 1500~2000 cM [19,20]. Thus, it is easy to
fast build a genetic map with a good coverage of the
pine genome with only a relatively small amount of
experimental effort. Linkage analysis, combined with
marker segregation distortion analysis, will enable us to
dis play the chromosomal segments that unevenly trans-
mit to the offspring from the mapping parent. Linkage
analysis has been appli ed in studies of many organisms
to help our understanding of the genetic mechanisms
underlying speciation [9,18,25].
Pine megagametophytes are developed from the mega-
spore of the maternal tree. I n gymnosperms, a diploid
precursor cell (megasporocyte or megaspore mother
cell) undergoes meiosis to produce four haploid cells,
then three of those cells degenerate, results in one
functional megaspore per ovule. The megaspore then
undergoes megagametogenesis to give rise to the mega-
gametophyte and to produce the female gamete. Thus,
the megagametophyte is haploid tissue and has the same
DNA as the female gamete that is fertilized by pollen to
form embryo in each seed. As a result, marker distortion
revealed by megagametophyte genotyping is closely
related to selection of alleles on the alternate chromo-
somes in the maternal parent. Since megagametophytes
are haploid, in mapping studies, they possess the simil ar
characteristics as recombination inbreeding lines
obtained by the single seed descent method that widely
used in the establishment of mapping pedigree for
crops.
Seed germination rates reflect the reproductive abil-
ity of trees sampled at differe nt elevations. In order to
make seed germination rates comparable, seeds from
each tree were randomly selected in the test. We did
not cull out the empty seeds or seeds with congenital
dysplasia embryos. Thus, the low germination rates of
trees in hybrid zone could be the result of both pre-
and post-zygotic barriers. Pre-zygotic barriers mainly
include factors associated with pollination and flower-
ing time, and also include factors affecting process of
gamete union to form a zygote. Once a hybrid zygote
is formed, it may have low viability or be sterile, and
the underlying factors are known as post-zygotic bar-
riers [3]. To resolve the segregation distortion barriers
to individual genes will be extremely difficult in pine.
First, pines possess gigantic genomes. Early linkage
analyses indicated that the expectation numbers of
crossovers were only about 15~20 per meiosis in pines
[19,20]. One centiMorgan pine genome contains about
500~1000 Mb of nucleotides on average. Second, genes
may have the same or opposite directional effect on
segregation distortion. Third, besides the underlying
genes, segregation distortion can be arisen by epistatic
effect, such as linkage disequilibrium (LD) among
unlinked markers. Finally, segregation distortion
observed in hybrids can also be arisen by chromosomal
rearrangements in the parental species. Therefore, the
underlying mechanisms vary greatly for each observed
SSD clusters. Nevertheless, SSD clusters on a genetic
map revealed the genomic regions we should focus on
to explore the genetic mechanisms underlying specia-
tion. Although the gigantic genome size of pine ham-
pers resolving the underlying genes, its modest genetic
length enables us to detect linkage and map QTL
easily. To explore the genetic loci underlying segrega-
tion distortion, genome-wide associations between
Table 2 The estimated and the observed expansion ranges of the major SSD clusters.
Linkage group c
h
2
oe r The estimated expansion range (cM) The observed expansion range (cM)
1 17.89 65 94 0.082763 16.7 35.9
2 26.39 131 95.5 0.114944 23.4 59.2
3 6.08 78 95 0.018353 3.7 9.2
4 6.48 112 94.5 0.021309 4.3 29.6
10 19.48 126 95.5 0.088775 17.9 14.9
11 9.68 117 95.5 0.041664 8.4 4.9
12 20.67 62 93 0.094856 19.2 46.1
Parameters of c
h
2
, o, e,andr are described in Methods.
Li et al. BMC Plant Biology 2010, 10:37
/>Page 5 of 7
hybrid sterility QTL and marker transmission ratio dis-
tortion is a desirable approach [18], and candidate
gene approach is a good option to help resolve the
underlying genes.
Conclusions
In this paper, we consistently detected low germination
rates of seeds collected from trees in the hybrid zone of
P. massoniana and P. hwangshanensis. We proposed that
germination rate reflected the hybrid incompatibility of
the alternate species. By using megagametophytes from a
single tree in the hybrid zone, we built a nearly complete
genetic map for pine genome. Based on the SSD mark ers
on this map, we discovered the potential chromosomal
introgression barriers between P. massoniana and P.
hwangshanensis. This study provided the basis for asso-
ciating S SD markers with their introgression behavior in
natural stands, and established a useful platform for con-
ducting genome-wide associations of hybrid sterility QTL
and/or candidate genes with marker transmission ratio
distortion in the progeny of a hybrid pine.
Methods
Cone collection and seed germination
One set of samples use d in this study were collected
from Huang-gang Chimney in Wuyi Mountain of Fujian
province. The elevation range was from 445~1250 m.
The other set of samples were collected from Kulong-
jiang Chimney at Qimen in A nhui province. The eleva-
tion range was from 350~1100 m. Linear transect s were
set up from the foot to the top of the mountains at
both locations. To avoid significant geographic changes
in horizontal direction, from foot to top, cones were col-
lected from trees within 10 m from the transaction lines.
Altogether, cones from 8 trees at 8 elevations were col-
lected in Fujian, and cone from 12 trees at 12 elevations
were collected in Anhui. Elevation of each tree was
recorded by its GPS reading.
Seed germination was conducted according to “Woody
plant seeds inspection standard” in the Chinese South-
ern Forest Seed Inspection Center [26]. For each tree,
400 seeds were randomly selected to test the germina-
tion rate. The germinati on rate was calculated by
n
N
%
;
n was the number of germinating seeds within certain
amount days (days were determined based on observa-
tion that germinating seeds were less than 1% of the
total test seeds in 3 continuous days); and N was the
total number of seeds tested for each tree.
DNA extraction, AFLP genotyping, marker segregation
test, and linkage analysis
We selected a tree at 784 m in Wuyi Mountain and har-
vested the megagametophyte tissues from seeds of this
tree that germinated into normal seedlings. DNAs from
192 megagametophytes w ere extracted a s described by
Yin et al [27]. AFLP primer combinations were selected
based on the results in Li et al [16]. AFLP genotyping
protocol was described by Yin et al [19]. AFLP marke r
nomenclature was designated by using the abbreviation
of the restriction enzyme (E: EcorI,M:MseI), in addition
to the number of selective oligonucleotides, following
the approxi mate allele size of the segregating marker. In
the name of each primer combination, E primer was
before the “/”, and M primer was after the “/”.
The C hi-square test was performed to check w hether
a marker segregated in 1:1 ratio. The linkage analysis
was conducted by MapMaker version 3.0 [28], and map
construction was described as in Yin et al [19]. Map
charts were drawn with the program of MapChart 2.1
[29]. Genome coverage was estimated by the function
given by Lange and Boehnke [21], assuming a random
marker distribution,
ce
md L
=−
−
1
2/
(1), where c was the
proportion of the genome w ithin d cM of a marker,
ˆ
L
was the estimated genome length and m was the num-
ber of markers.
Estimate expansion of segregation distortion
If we define the selection intensity (S) that causes marker
segregation distortion as S =|o - e|, then the Chi-square
value of each marker in this study is
2
4
2
=
S
N
(2),
where, o is the observed number of individuals with a
visible allele, e is the expect number of individuals with
the corresponding visible allele, and N is the number of
megagametophytes genotyped by the corresponding pri-
mer combination. If we assume there is only one locus
that causes marker segregation distortion in each cluster,
the Chi-sq uare value of a marker that has recombination
rate r with the driven locus would be
r
SNr
N
2
4
2
=
−()
(3). Recombination rate can be derived based on the dif-
ference of Chi-square value (c
d
2
)ofthetwoloci,and
rS
S
NN
N
d
=+ −
1
4
22
(4). Then recombination rate
can be transferred into genetic distance by Kosambi’s for-
mula [30] as,
M
r
r
=
+
−
(/)ln14
12
12
(5), where M is the
genetic distance in Kosambi centiMorgan. Under single
driven locus assumption, the two-directional distortion
range under the observed highest selection intensity
(related to the observed highest Chi-square value, c
h
2
)
would be
2
1
2
12 2
2
4
2
12 2
2
4
2
M
SN N S N
d
SN N S N
d
=
++ −
−− −
ln
(/)(/) (/)
(/)(/) (/)
(6),
where c
d
2
= c
h
2
-3.84.
Li et al. BMC Plant Biology 2010, 10:37
/>Page 6 of 7
Additional file 1: Genetic map for a natural hybrid of P. massoniana
and P. hwangshanensis. This genetic map is determined by using
megagametophytes of 192 normally germinated seeds from the
mapping parent. Marker with name ending with ‘r’ was in repulsion
linkage phase.
Click here for file
[ />37-S1.PDF ]
Acknowledgements
We thank Fenghou Shi and Fengmao Chen at Nanjing Forestry University
for their help in seeds collection, Dr. J. Armento in Oak Ridge, Tennessee, U.
S.A. for his comments and editing for this manuscript. Special thanks go to
the editor and anonymous reviewers for their help in formulating the
revision. Funds for this research were provided by Natural Science
Foundation of China (30971609, 30200224) and Forestry Nonprofit Project
(200904002).
Authors’ contributions
LSX, CY and GHD conducted most of the molecular work and data analyses.
LSX drafted the manuscript. YTM conceived the work and edited the
manuscript critically. All authors have read and approved the final
manuscript.
Received: 14 May 2009
Accepted: 25 February 2010 Published: 25 February 2010
References
1. Baack EJ, Rieseberg LH: A genomic view of introgression and hybrid
speciation. Curr Opin Genet & Devlop 2007, 17:513-518.
2. Mallet J: Hybridization as an invasion of the genome. Trends Ecol Evol
2005, 20:229-237.
3. Howard DJ, Berlocher SH: Endless forms: species and speciation New York:
Oxford University Press 1998.
4. O’Brien SJ, Mayr E: Bureaucratic mischief: recognizing endangered species
and subspecies. Science 1991, 251:1187-1188.
5. Howard DJ: A zone of overlap and hybridization between two ground
cricket species. Evol 1986, 40:34-43.
6. Key KHL: The concept of stasipatric speciation. Syst Zool 1968, 17:14-22.
7. Harrison RG: Pattern and process in a narrow hybrid zone. Heredity 1986,
56:337-349.
8. Martinsen GD, Whitham TG, Turek RJ, Keim P: Hybrid populations
selectively filter gene introgression between species. Evol 2001,
55:1325-1335.
9. Yin TM, DiFazio SP, Gunter LE, Riemenschneider D, Tuskan GA: Large-scale
heterospecific segregation distortion in Populus revealed by a dense
genetic map. Theor Appl Genet 2004, 109:451-463.
10. Wu ZY: Vegetation in China Beijing: Science Press 1980.
11. Ke BF, Li SC, Wei GY: The secondary discussion on the nomenclature for
Pinus Hwangshanensis. J Anhui Agri Uni 1983, 2:1-7.
12. Xing YH, Fang YX, Wu GR: The preliminary study on natural hybridization
between Pinus hwangshanensis and P. massoniana in Dabie Mountian of
Anhui province. J Anhui For Sci Tech 1992, 4:5-9.
13. Qi CJ, Lin QZ: A new variant of Pinus massoniana. Botanical Res 1988,
3:143-145.
14. Luo SJ, Zou HY: Study on the introgressive hybridization between Pinus
hwangshanensis and P. massoniana. Scientia Silvae Sinicae
2001,
37:118-122.
15. Zou LD: Plant growth and environments Beijing: Advanced Educational Press
2004.
16. Li SX, Chen ZY, Shen YB, Yin TM, Shi JS: AFLP protocol optimization in
plants with gigantic genome size. J Nanjing For Uni 2003, 27:1-6.
17. Rake AV, Miksche JP, Hall RB, Hansen KM: DNA reassociation kinetics of
four conifers. Can J Genet Cytol 1980, 22:69-79.
18. Moyle LC, Graham EB: Genome-wide associations between hybrid sterility
QTL and marker transmission ratio distortion. Mol Biol Evol 2006,
23:973-980.
19. Yin TM, Wang XR, Andersson B, Lerceteau E: Nearly complete genetic
maps of Pinus sylvestris L. (Scots pine) constructed by AFLP marker
analysis in a full-sib family. Theor Appl Genet 2003, 106:1075-1083.
20. Remington DL, Wheten RW, Liu BH, O’Malley DM: Construction of an AFLP
genetic map with nearly complete genome coverage in Pinus taeda.
Theor Appl Genet 1999, 98:1279-1292.
21. Lange K, Boehnke M: How many polymorphic genes will it take to span
the human genome?. Am J Hum Genet 1982, 24:842-845.
22. Yin TM, Zhang XY, Huang MR, Wang MX, Zeng ZB, Wu RL: Molecular
linkage maps of the Populus genome. Genome 2002, 45:541-555.
23. Yin TM, Huang MR, Wang MX, Zhu LH, Zeng ZB, Wu RL: Preliminary
interspecific genetic maps of the Populus genome constructed from
RAPD markers. Genome 2001, 44:602-609.
24. Antonovics J: Evolution in closely adjacent plant populations X: long-
term persistence of prereproductive isolation at a mine boundary.
Heredity 2006, 97:33-37.
25. Rieseberg LH, Linder CR, Seiler GJ: Chromosomal and genic barriers to
introgression in Helianthus. Genetics 1995, 141:1163-1171.
26. Standards in P.R China-Woody plant seeds inspection standard (GB2772)
Beijing: Standard Press 1999.
27. Yin TM, Huang MR, Wang MX, Zhu LH, Zhai WX: Construction a genetic
map in Masson pine by RAPD and the megagametophytes from a
single tree. Acta Bot Sin 1997, 39:607-612.
28. Lander E, Green P, Abrahamson J, Barlow A, Daly M, Lincoln S, Newburg L:
MAPMAKER: an interactive computer package for constructing primary
genetic linkage maps of experimental and natural populations. Genomics
1987, 1:174-181.
29. Voorrips RE: MapChart: software for the graphical presentation of linkage
maps and QTLs. J Hered 2002, 93:77-78.
30. Kosambi DD: The estimation of map distances from recombination
values. Ann Eugen 1944, 12:172-175.
doi:10.1186/1471-2229-10-37
Cite this article as: Li et al.: Potential chromosomal introgression
barriers revealed by linkage analysis in a hybrid of Pinus massoniana
and P. hwangshanensis. BMC Plant Biology 2010 10:37.
Submit your next manuscript to BioMed Central
and take full advantage of:
• Convenient online submission
• Thorough peer review
• No space constraints or color figure charges
• Immediate publication on acceptance
• Inclusion in PubMed, CAS, Scopus and Google Scholar
• Research which is freely available for redistribution
Submit your manuscript at
www.biomedcentral.com/submit
Li et al. BMC Plant Biology 2010, 10:37
/>Page 7 of 7