báo cáo khoa học: " Dissecting grain yield pathways and their interactions with grain dry matter content by a two-step correlation approach with maize seedling transcriptome" pps
Bạn đang xem bản rút gọn của tài liệu. Xem và tải ngay bản đầy đủ của tài liệu tại đây (1.04 MB, 15 trang )
Fu et al. BMC Plant Biology 2010, 10:63
/>Open Access
RESEARCH ARTICLE
BioMed Central
© 2010 Fu et al; licensee BioMed Central Ltd. This is an Open Access article distributed under the terms of the Creative Commons Attri-
bution License ( which permits unrestricted use, distribution, and reproduction in any
medium, provided the original work is properly cited.
Research article
Dissecting grain yield pathways and their
interactions with grain dry matter content by a
two-step correlation approach with maize seedling
transcriptome
Junjie Fu
†1
, Alexander Thiemann
†2
, Tobias A Schrag
1
, Albrecht E Melchinger*
1
, Stefan Scholten
2
and Matthias Frisch
3
Abstract
Background: The importance of maize for human and animal nutrition, but also as a source for bio-energy is rapidly
increasing. Maize yield is a quantitative trait controlled by many genes with small effects, spread throughout the
genome. The precise location of the genes and the identity of the gene networks underlying maize grain yield is
unknown. The objective of our study was to contribute to the knowledge of these genes and gene networks by
transcription profiling with microarrays.
Results: We assessed the grain yield and grain dry matter content (an indicator for early maturity) of 98 maize hybrids
in multi-environment field trials. The gene expression in seedlings of the parental inbred lines, which have four
different genetic backgrounds, was assessed with genome-scale oligonucleotide arrays. We identified genes
associated with grain yield and grain dry matter content using a newly developed two-step correlation approach and
found overlapping gene networks for both traits. The underlying metabolic pathways and biological processes were
elucidated. Genes involved in sucrose degradation and glycolysis, as well as genes involved in cell expansion and
endocycle were found to be associated with grain yield.
Conclusions: Our results indicate that the capability of providing energy and substrates, as well as expanding the cell
at the seedling stage, highly influences the grain yield of hybrids. Knowledge of these genes underlying grain yield in
maize can contribute to the development of new high yielding varieties.
Background
Maize production in 2007 was about 800 million tonnes -
more than rice or wheat
, and it is
likely to become the most important source for human
nutrition by 2020 [1]. Conventional breeding approaches
employing direct phenotypic selection with limited or no
knowledge of the underlying morpho-physiological
determinants have successfully improved yield [2]. Maize
grain yield and its major components - kernel weight,
kernel number per ear, ear number per plant - have been
studied by quantitative trait locus (QTL) mapping
approaches [3]. The identified chromosome regions pro-
vide a starting point for further decoding the mechanisms
affecting maize production. In European maize breeding,
early maturity of high yielding varieties is an important
breeding goal, since the short growing season limits pro-
ductivity. Therefore, grain dry matter content, as an indi-
cator for early maturity, is a major factor determining
maize productivity.
Genes directly involved in grain yield, including those
associated with grain number (e.g., OsCKX2), grain
weight (e.g., GS3 and GW2) and grain filling were identi-
fied in rice ([4] for review). Further, genes indirectly asso-
ciated with grain yield via plant height (e.g., Rht1, sd1,
and BRI1) and tillering (e.g., TB1, FC1, and MOC1) were
also identified. These findings underline the important
roles of cell cycle, phytohormone signaling, carbohydrate
supply, and the ubiquitin pathway and have increased our
* Correspondence:
1
Institute of Plant Breeding, Seed Science and Population Genetics, University
of Hohenheim, 70599 Stuttgart, Germany
†
Contributed equally
Full list of author information is available at the end of the article
Fu et al. BMC Plant Biology 2010, 10:63
/>Page 2 of 15
understanding of grain yield. However, the mechanisms
and pathways controlling yield and yield-related traits
still remain largely unknown.
Genome-scale oligonucleotide arrays have become a
powerful tool in detecting the pathways and pathway
interactions underlying biological processes. In maize,
results on ear and kernel development have been
reported [5,6]. However, no results focusing on maize
yield or early maturity are available.
Our objectives were to investigate the genes and gene
networks underlying grain yield in maize, and their inter-
action with genes underlying grain dry matter content, by
employing a newly developed two-step correlation analy-
sis that combines multi-environment field data and tran-
scription profiles.
Results
Grain yield-involved genes
The modified F-test with a false discovery rate (FDR) of
0.01 [7] revealed that 12,288 out of the 43,381 gene-ori-
ented probes representing complementary maize genes
were differentially expressed in the parental inbred lines
of the 98 hybrids. For 10,810 among them, the fold
change was greater 1.3 and the log-2 expression intensity
was greater 8.0. This set of significant differentially
expressed genes was subjected to further analyses. The
average number of genes differentially expressed between
the parents of a hybrid was 3350, which equals 7.7% of the
genes on the array (see Additional file 1).
The mid-parent expression level of 2511 differentially
expressed genes was significantly (p < 0.01) correlated
with hybrid performance (PY) or heterosis (HY) for grain
yield. In Step 1 of the two-step selection approach (Figure
1), 540 genes were found to be highly significantly (p <
0.0001) correlated with PY or HY. In Step 2, additional
205 genes were added to the set of grain yield associated
genes S. The gene expression of 468 genes (62.8% of 745
genes) was positively and that of 277 (37%) negatively
correlated with PY (see Additional file 2). Note however,
that these percentages are based on probes and may over-
estimate the actual number of differentially regulated
genes, because there may not always be a one-to-one
relationship between probes and genes.
With information from the Swissprot Knowledgebase,
we found that 18 of the grain yield associated genes were
identical to known maize genes, including IVR1 encoding
invertase (MZ00005490), GLU1 (MZ00035426), PHI1
(MZ00014260), RBCS (MZ00014822), and HDT3 encod-
ing histone deacetylase (MZ00023941). Furthermore, a
high correlation (r > 0.6) was observed for genes encod-
ing hexokinase (MZ00042300) and phosphofructokinase/
PFK (MZ00013816), a dynamin-related gene
(MZ00014057), and MZ00026127 (OsNAC4 homologue)
well-known as a transcription factor gene involved in the
regulation of developmental processes [8].
In a cross validation procedure, three of the seven flint
lines and five of the fourteen dent lines were randomly
sampled with 100 repetitions. On average 190 of the 200
genes showing the strongest correlation with PY in the
estimation set were among the set of the 200 genes with
the strongest correlation in the complete data set. For HY
the average number of agreeing genes was 185. This
result confirms that the different genetic backgrounds of
the inbred lines only marginally contributed to the ran-
dom error in the correlation analysis.
Interaction between grain yield and grain dry matter
content associated genes
The negative correlation r(PY, PD) = -0.410 between
hybrid performance for grain yield and grain dry matter
content was significant (p = 0.002). This suggests that the
gene networks involved in grain yield and grain dry mat-
ter content might be overlapping and negatively interact-
ing with each other. Employing the two-step selection
approach (Figure 1) we detected 622 genes associated
with grain dry matter content. A total of 103 genes had an
influence on both traits and had correlations of opposite
sign with regard to grain dry matter content and grain
yield (see Additional file 2). Some of these genes were
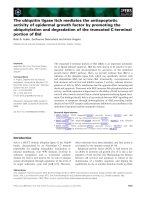
Figure 1 Schematic representation of a two-step correlation ap-
proach. L, average expression level of a gene in the parents of a hybrid;
g*, gene not included in set S in a previous repetition of Step 2; r, cor-
relation coefficient; p, p-value for statistical significance; PY, hybrid per-
formance for grain yield; HY, mid-parent heterosis for grain yield.
r(L,PY) for gene g:
(p < 0.0001) ?
r(L,HY) for gene g:
(p < 0.0001) ?
Add gene g to the set S of genes involved in grain yield
yes
yes
Step 1
For all g in S and
all g* not in S:
r(L
g*
,L
g
) > 0.9 ?
Step 2
no
Set S is complete
yes
Add gene g*
to set S
repeat
Fu et al. BMC Plant Biology 2010, 10:63
/>Page 3 of 15
located in the phytohormone signaling pathways (e.g.,
auxin-responsive factor, beta-glucosidase) and the fla-
vonoid metabolism (e.g., isoflavone reductase, 2-
hydroxyisoflavanone dehydratase; Table 1).
Among the interacting genes, only 39 genes were iden-
tified in Step 1. However, 64 more genes were included in
Step 2. About half of these additional genes were associ-
ated with only one trait (grain yield or grain dry matter
content) at the 0.0001 level, but were highly correlated
with a significant gene concerning the second trait.
Functional classification of trait-involved genes
To examine the functions of grain yield and grain dry
matter content associated genes, these were grouped into
functional categories based on the MIPS Functional Cat-
alogue (Table 2, Additional file 2). The functional cate-
gory METABOLISM contained most of the genes for
both traits. For grain yield, it was followed by PROTEIN
WITH BINDING FUNCTION OR COFACTOR
REQUIREMENT and for grain dry matter content by
CELL RESCUE, DEFENSE AND VIRULENCE. Further-
more a large number of genes were related to processes
involved in ENERGY. In Step 2 of the selection approach,
the additional genes in categories CELL CYCLE AND
DNA PROCESSING and CELL FATE were included in
the set of grain yield associated genes, resulting in an
enrichment of these two categories. The category CELL
RESCUE, DEFENSE AND VIRULENCE included the
largest number of genes, which were associated with both
traits.
Significantly regulated metabolic pathways
In an enrichment analysis of the grain yield associated
genes with RiceCyc, we determined overrepresented
pathways. These included sucrose degradation, cyclopro-
pane and cyclopropene fatty acid biosynthesis, and plant
respiration (Table 3, Additional file 2). Many grain yield
associated genes were classified to the pathways of glycol-
ysis, fructose degradation to pyruvate and lactate, glucose
fermentation to lactate, and the Calvin cycle. Two genes
were involved in the biosynthesis of the growth hormone
IAA, one of these two genes was associated with both
grain yield and grain dry matter content. One gene
(MZ00042300) coding for a hexokinase involved in the
degradation of sugars (e.g. sucrose), was associated with
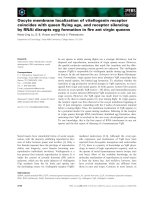
both traits (Figure 2).
Discussion
Maize transcriptome at seedling stage
Gene expression of the parental inbred lines was profiled
at the seedling stage. This strategy largely reduced the
variance during plant collection, since seedlings can be
grown in large quantities under highly controlled condi-
tions [9]. Maize seedling transcriptome employed in our
study did not take into account important trait-involved
genes, which were regulated by developmental and envi-
ronmental conditions. However, from previous research
[5,6,10] it is known that grain yield associated genes
(Table 1) were also regulated in ear or kernel develop-
ment or stress response. This supports the hypothesis
that the relative expression patterns of grain yield associ-
ated genes have already been established in early develop-
ment stages [11]. Therefore the latent efficiency of these
genes as determined at the seedling stage is expected to
have a direct influence on grain yield.
Two-step selection of trait-involved genes
Our newly developed two-step correlation approach tar-
gets at identifying all genes associated with grain yield
and grain dry matter content using our expression and
field data. On the one hand, it detects the most relevant
genes in Step 1 using the stringent significance level of p
< 0.0001. On the other hand, it also includes further
important genes with the less stringent significance level
of p < 0.01 on the basis of co-expression (r > 0.9). Employ-
ing co-expression reduced the number of about 2500
genes, which were significant at the 0.01 level, to 640. In
conclusion, the two-step approach allows a more focused
detection of relevant genes with a possibly important bio-
logical significance than solely a low statistical signifi-
cance level. In Step 1, only 39 genes associated with both
traits were detected. This number would have been too
small to examine the interaction between the pathways
involved in both traits. However, the additional genes
identified in Step 2 enabled us to decode major interac-
tion networks of grain yield and grain dry matter content
(Table 1).
Plant metabolism - sucrose degradation and glycolysis
Hexose phosphates derived from sucrose degradation are
used to meet the energy and substrate requirements for
plant growth. The finding that sucrose degradation was
overrepresented in grain yield-involved genes (Table 3)
suggests its significant role in maize production. Three
genes encoding three types of invertases (MZ00005490,
vacuolar invertase; MZ00026683, cytosolic invertase;
MZ00033179, cell wall invertase) and one gene encoding
a hexokinase (MZ00042300) were found to be positively
associated with grain yield (Figure 2 and Table 1). This
implies that sucrose degradation is up-regulated in high
yielding hybrids, resulting in an increased hexose phos-
phate pool during the seedling stage (Figure 2). These
results coincide with the fact that the strong relationship
between invertase activity and growth rate was largely
explained by common chromosomal regions co-located
with genes encoding invertase and other related enzymes
[12].
Fu et al. BMC Plant Biology 2010, 10:63
/>Page 4 of 15
Table 1: The list of selected genes involved in grain yield.
Probe ID Annotation Mean FD Association Step
Ref§
Figure
grain
yield
GDMC
MZ00013618 CIPK9-like protein 9.0 1.7 P - F [3]
MZ00014057 Dynamin-related protein 1A,
putative
9.8 2.0 P N F Fig. 3
MZ00014612 ARID/BRIGHT DNA-binding
domain-containing protein,
putative
7.8 1.6 N P F
MZ00014822 Ribulosebisphosphate
carboxylase. {Zea mays;}
9.7 3.7 N - F
MZ00015132 O-methyltransferase ZRP4 (EC
2.1.1 ) (OMT) {Zea mays}
8.9 2.1 P - F [1]
MZ00016342 SEUSS transcriptional co-
regulator, homologue
9.3 1.4 N P F
MZ00017365 Serine/threonine-protein
kinase SAPK3, putative
10.3 1.5 P - F
MZ00018334 High light protein {Hordeum
vulgare}
8.8 1.5 P - F
MZ00018444 2-Hydroxyisoflavanone
dehydratase, putative
8.4 1.6 P N F
MZ00018517 2-Hydroxyisoflavanone
dehydratase, putative
10.7 2.8 P N F
MZ00020198 Thioredoxin M-type,
chloroplast precursor (TRX-M)
{Zea mays}
13.3 2.1 N - S
MZ00021090 DNA-3-methyladenine
glycosylase (MAG), homologue
8.4 1.4 P - F
MZ00022903 Leucine-rich repeat
transmembrane protein kinase,
putative
8.6 2.7 N - F
MZ00023941 Histone deacetylase 2c (Zm-
HD2c) {Zea mays}
8.2 3.4 P - S
MZ00024407 Agamous-like MADS box
protein AGL9 homolog,
putative
7.5 1.4 P N F
MZ00026127 Development regulation gene
OsNAC4, homologue
9.2 1.8 P - F
MZ00026879 Putative receptor-mediated
endocytosis 1 isoform I/
calcium-binding EF hand family
protein
10.5 1.3 N - F
MZ00029320 Isoflavone reductase homolog,
putative
9.5 6.2 P N S
MZ00033058 Plasma membrane ATPase 1,
putative
8.2 1.7 N - F
MZ00044236 Putative calcium-dependent
protein kinase
8.9 1.5 P - F
MZ00046983 Glycosyl transferase family 17
protein, putative
8.3 1.3 N - F
Fu et al. BMC Plant Biology 2010, 10:63
/>Page 5 of 15
MZ00056596 24-methylenesterol C-
methyltransferase 2(SMT2),
homologue
8.8 2.1 N - F Fig. 3
MZ00057130 Dof-type zinc finger domain-
containing/OBP1-like protein,
orthologue
8.0 1.9 P - F
MZ00057320 Putative ribulose-5-phosphate-
3-epimerase
9.0 1.6 P - F [3]
Carbohydrates and energy
MZ00005490 Beta-fructofuranosidase/
vacuolar invertase {Zea mays}
8.2 1.9 P - F [1] Fig. 2
MZ00013514 UDP-glucose
pyrophosphorylase, homolgue
8.2 1.5 P - F Fig. 2
MZ00013816 Adenosine kinase/
phosphofructokinase (PFK)
{Zea mays}
9.9 3.3 P - F Fig. 2
MZ00014260 Glucose-6-phosphate
isomerase, cytosolic {Zea mays}
11.2 1.6 N - F Fig. 2
MZ00015645 Pyrophosphate-fructose 6-
phosphate 1-
phosphotransferase (PFP)
alpha subunit, putative
8.7 1.6 N - F [1] Fig. 2
MZ00017454 Putative GDP-mannose
pyrophosphorylase
10.1 1.5 N - F Fig. 2
MZ00024012 Pyrophosphate-fructose 6-
phosphate 1-
phosphotransferase (PFP) beta
subunit, putative
10.7 2.7 P - F [3] Fig. 2
MZ00024213 Pyrophosphate-fructose 6-
phosphate 1-
phosphotransferase (PFP)
alpha subunit, putative
12.0 1.6 P - F Fig. 2
MZ00026683 Putative beta-
fructofuranosidase/cytosolic
invertase
10.3 1.4 P - F Fig. 2
MZ00033179 Beta-fructofuranosidase/cell
wall invertase {Zea mays}
8.8 2.0 P - F [2] Fig. 2
MZ00036953 Triosephosphate isomerase,
cytosolic, putative
9.7 3.1 N P S [3] Fig. 2
MZ00039244 Phosphoglycerate kinase,
putative
10.4 1.7 P - F Fig. 2
MZ00042300 Putative hexokinase (HXK) 8.9 1.4 P N F Fig. 2
Cell cycle, DNA processing, and cell fate
MZ00004156 Endo-1,3-beta-D-glucosidase,
putative
9.0 1.9 P - F Fig. 3
MZ00013343 Histone H4, similarity 12.3 1.8 P - F [2,3] Fig. 3
MZ00013961 V-type H+ATPase, putative 7.7 1.4 P - F Fig. 3
MZ00017273 CDK regulatory subunit 9.2 2.1 P - S
MZ00017440 CDC2/B-type CDK, homologue 8.5 2.9 N - S Fig. 3
MZ00017840 DNA ligase, putative 9.0 1.6 P - F Fig. 3
MZ00017975 CDK-activating kinase
assembly factor-related
9.2 1.3 P N F
Table 1: The list of selected genes involved in grain yield. (Continued)
Fu et al. BMC Plant Biology 2010, 10:63
/>Page 6 of 15
MZ00021340 Putative beta-expansin 8.1 1.4 P - F [2] Fig. 3
MZ00021442 Cyclin-dependent kinase
inhibitor 7 (ICK7), homologue
8.9 1.5 P - F Fig. 3
MZ00022872 Putative beta-expansin 8.3 1.7 P - F [3] Fig. 3
MZ00026530 Enhancer of rudimentary,
putative
9.7 3.0 P - F Fig. 3
MZ00027266 Putative cell division protein
FtsZ (CH)
10.1 1.5 P - S Fig. 3
MZ00027598 Putative replication factor
subunit
9.5 1.8 P - F Fig. 3
MZ00030457 Putative alpha-expansin 8.3 1.3 P - F Fig. 3
MZ00030567 Putative alpha-expansin 1
precursor
8.5 2.1 N - F [1,3] Fig. 3
MZ00041750 Prolifera protein (PRL)/DNA
replication licensing factor
Mcm7 (MCM7)
8.7 2.4 P - F [3] Fig. 3
MZ00043527 Aquaporins/tonoplast
membrane integral protein
ZmTIP3-1 {Zea mays}
8.2 2.8 P - F [3] Fig. 3
MZ00044246 Putative CDC48-like protein 8.6 1.5 P - F
Ubiquitin pathway
MZ00000787 F-box/tubby family protein,
putative
8.7 2.0 P - F [1] Fig. 3
MZ00012603 RWD domain containing 1-like
protein, putative
8.9 1.8 P N F
MZ00012765 RING finger subunit, putative 7.6 1.9 P N F Fig. 3
MZ00020431 E3 ubiquitin ligase APC1,
putative
8.1 1.5 P - F Fig. 3
MZ00026276 Ubiquitin-conjugating enzyme
E2-17 kDa, putative
9.2 2.4 P N S [3]
MZ00030283* CCS52A class, homologue 8.5 1.2 P - Fig. 3
MZ00036978 SKP1 family, putative 11.0 1.9 N - F
MZ00039271 F-box/LRR protein, putative 8.9 1.6 P - F Fig. 3
MZ00056403 Ubiquitin-conjugating enzyme
E2-17 kDa, putative
9.7 2.0 P - S [3]
Phytohormone pathway
MZ00003819 Putative ethylene-responsive
transcriptional coactivator
(MBF1)
8.7 2.7 P - F [1] Fig. 3
MZ00012636 Glutathione S-transferase GST
29 (auxin-induced) {Zea mays}
8.4 2.0 N - F
MZ00013540 14-3-3-like protein, putative 10.5 3.1 P - F
MZ00013608 Beta-glucosidase aggregating
factor {Zea mays}
12.1 2.8 P - F [2,3]
MZ00014891 Contains similarity to
gibberellin-stimulated
transcript 1 like protein,
putative
8.7 1.5 P - F [3]
MZ00018299 Ethylene-responsive protein,
putative
8.7 1.5 P - F
Table 1: The list of selected genes involved in grain yield. (Continued)
Fu et al. BMC Plant Biology 2010, 10:63
/>Page 7 of 15
MZ00021497 Auxin-responsive family
protein, putative
8.7 1.3 P - F
MZ00024781 Putative auxin-responsive
factor (ARF1)
8.5 1.4 P - S [2]
MZ00025819 BRI1-associated receptor,
homologue
10.0 1.8 P - F
MZ00026772 bHLH/IAA-LEUCINE
RESISTANT3, homologue
10.4 1.5 N P S
MZ00028517 Abscisic acid-insensitive 4
(ABI4)-like protein, putative
7.6 1.3 P - F
MZ00030444 Glutathione S-transferase,
putative
9.1 1.3 P N F
MZ00031351 Two-component responsive
regulator 2/response regulator
4 (ARR4)-like protein {Zea
mays}
9.4 1.7 P - F
MZ00034947 Glycosyl hydrolase family 1/
Beta-glucosidase-like protein,
putative
8.6 1.2 N P F
MZ00035426 Beta-glucosidase {Zea mays} 8.0 2.6 P N F [2]
MZ00038300 Auxin response factor 2,
putative
7.9 3.2 P - S
MZ00040986 IAA-alanine resistance protein,
putative
8.1 1.2 N - F
MZ00044325 Auxin-responsive protein -
related, similarity
10.4 2.2 P N S
Stress
MZ00001535 Heat shock protein, putative 8.0 1.6 N P F
MZ00004615 Pathogenesis-related protein,
putative
10.1 3.3 P - F
MZ00013860 DNAJ heat shock protein,
putative
10.5 2.3 P - F
MZ00017699 Putative drought-induced
protein, related
10.5 2.0 P - F
MZ00022225 AN1-like protein/ZmAN18 {Zea
mays}
9.9 3.1 P - F
MZ00036400 LEA3 family protein, putative 10.6 2.2 P N F
MZ00056817 Cold-shock DNA-binding
family protein, homologue
8.2 1.6 P - F
Transporter
MZ00017748 Putative peptide transporter 12.2 1.7 P - F
MZ00018481 Putative Potassium channel
protein
9.3 1.7 P - F [1]
MZ00026499 Glucose-6-phosphate/
phosphate-translocator
precursor, homolog
10.0 1.6 P - F
MZ00043904 ABC transporter family protein 9.0 1.8 P - F
The grain yield-involved genes are collected in Step 1 (F) and Step 2 (S). For each gene, mean and fold-change (FD) of mid-parent expression are
calculated; the positive (P) and negative (N) association to grain yield and grain dry matter content (GDMC) are also provided.
§1, Fernandes et al., 2008 [10]; 2, Zhu et al., 2009 [6]; 3, Liu et al., 2008 [5].
* Probes (genes) with marginal significance included for discussion.
Table 1: The list of selected genes involved in grain yield. (Continued)
Fu et al. BMC Plant Biology 2010, 10:63
/>Page 8 of 15
A considerable number of grain yield associated genes
were found to be involved in glycolysis, an integrated
(whole) plant metabolism using hexose phosphates
(Table 3). PFK (MZ00013816, adenosine kinase/phospho-
fructokinase) is the principle enzyme regulating the entry
of metabolites into glycolysis [13] through conversion of
fructose-6-phosphate to fructose-1,6-bisphosphate. Its
encoding gene was positively correlated with grain yield,
indicating the up-regulation of glycolysis in high yielding
hybrids. This result is supported by the fact that genes
encoding alpha and beta subunits of PFP (Pyrophos-
phate-fructose 6-phosphate 1-phosphotransferase;
MZ00024213 and MZ00024012, respectively), involved in
interconversion of fructose-6-phosphate and fructose-
1,6-bisphosphate, were both positively correlated with
grain yield. These findings suggest that glycolysis is
involved in grain yield, and the up-regulation of glycolysis
seems to be a downstream effect of sucrose degradation
up-regulation. This results in an increase of hexose phos-
phate, supplying more energy and more substrates, which
are necessary for a strong seedling development. This
deduction is supported by the fact that hexoses as well as
sucrose have been recognized as important signal mole-
cules in source-sink regulation and balance [14].
The relationship between carbohydrate metabolism
and phytohormone signaling is illustrated by the fact that
cytokinins enhance the gene expression of cell wall
invertase and hexose uptake carriers [15]. One gene
encoding a beta-glucosidase (MZ00035426) providing
active cytokinins [16], one gene encoding a beta-glucosi-
dase aggregating factor (MZ00013608) and a direct
downstream gene of cytokinin (MZ00031351) encoding
A-type response regulator [17] were positively associated
with grain yield (Table 1). This suggests that up-regulated
carbohydrate metabolism could partially be the result of
cytokinin signaling regulation.
Plant growth - cell expansion and endocycle
The growth of plant tissue generally proceeds in two
stages. The first stage is cell division followed by cell
expansion until differentiation is completed [18]. In an
early developmental phase during endosperm develop-
ment, cell division takes place and then organelle prolifer-
ation and cell expansion occur. In a later developmental
phase, starch and proteins are deposited into the
endosperm tissue. The early developmental phase
decides over the final volume of the grain filling and con-
sequently partly over the amount of final grain yield, due
to the total cell number and the size of the cells [19]. In
our results, the marker genes of cell expansion encoding
V-type H
+
ATPase (MZ00013961) and aquaporins
(MZ00043527) for water up-take [20] together with
expansins (e.g. MZ00022872) and endo-1,3-beta-D-glu-
cosidase (MZ00004156) for cell wall loosening [21], were
positively associated with grain yield (Figure 3 and Table
1). This indicates that probably a high cell expansion rate
in the seedling stage and maybe also later in the early
phase of endosperm development is associated with high
grain yield in hybrids. Larger cells, due to an increased
cell expansion, have also been observed in maize roots of
hybrids compared to their parental inbred lines [22]. The
high expression of a gene (MZ00027266) encoding an
FtsZ-like protein, which stimulates chloroplast division
[23], indicates that hybrids with high grain yield may pro-
liferate more chloroplasts along with cell expansion dur-
ing seedling development and possibly also during
endosperm development. This coincided with the regula-
tion of genes located in the calvin cycle and chlorophyl-
lide a biosynthesis (Table 3).
DNA synthesis, persisting after transition to cell expan-
sion without subsequent cell division (M-phase), leads to
endocycle, which significantly contributes to cell expan-
sion in higher plants ([24] for review). The finding that
the functional category CELL CYCLE AND DNA PRO-
CESSING was overrepresented in grain yield associated
genes (Table 2) suggests that this set of genes may play a
significant role in grain yield regulation through their
influence on endocycle, because most cells used for tran-
scription profiling had already completed the cell division
stage. For example, a gene (MZ00041750) encoding a
DNA replication licensing factor and a gene
(MZ00027598) encoding a subunit of a replication factor
were positively associated with grain yield, which sug-
gests that changes in the replication rate lead to altera-
tions in the cell cycle of the hybrids. This deduction is
also supported by the fact that several genes encoding
enzymes involved in DNA repair were positively associ-
ated with grain yield. The ploidy level affects the cell size
by increasing the metabolic output [25]. This supports
the hypothesis that up-regulation of sucrose degradation
and glycolysis in high yielding hybrids could be the result
of a high ploidy level during cell expansion.
The endocycle is mediated by a down-regulation of
cyclin-dependent kinase (CDK) activity in cells [25]. A
gene (MZ00017440) encoding a B-type cyclin-dependent
kinase (CDBK) was negatively associated with grain yield,
implying that down-regulation of this CDKB could affect
endocycle. Such a down-regulation could also be realized
through less phosphorylation of CDK-inhibitors (ICK/
KPRs) by CDKBs [26]. Another gene (MZ00021442)
encoding ICK/KPR was also positively associated with
grain yield, which stimulates the endocycle by decreasing
the CDK activity. The activation of the ubiquitin-protea-
some pathway [25] is a further mechanism to decrease
CDK activity. The genes (e.g. MZ00020431) encoding the
anaphase-promoting complex (APC) and another gene
(MZ00030283) which encodes an APC-activating protein
Fu et al. BMC Plant Biology 2010, 10:63
/>Page 9 of 15
Table 2: The distribution of trait-involved genes in the MIPS Functional Catalogue.
Functional
category
Background (DG) grain yield- involved GDMC-interacted GDMC-involved
Step 1 Step 2 Step 2 Step 2
n% n%n%n% n%
METABOLISM 858 31.1% 39 29.5% 52 29.2% 4 19.0% 54 37.2%
ENERGY 281 10.2% 17 12.9% 21 11.8% 2 9.5% 21 14.5%
CELL CYCLE AND
DNA
PROCESSING
153 5.5% 7 5.3% 14 7.9% 2 9.5% 13 9.0%
TRANSCRIPTION 266 9.6% 14 10.6% 20 11.2% 2 9.5% 15 10.3%
PROTEIN
SYNTHESIS
336 12.2% 15 11.4% 21 11.8% 1 4.8% 13 9.0%
PROTEIN FATE 324 11.7% 10 7.6% 18 10.1% 3 14.3% 18 12.4%
PROTEIN WITH
BINDING
FUNCTION OR
COFACTOR
REQUIREMENT
376 13.6% 22 16.7% 29 16.3% 1 4.8% 17 11.7%
CELLULAR
TRANSPORT,
TRANSPORT
FACILITATION
AND TRANSPORT
ROUTES
360 13.0% 22 16.7% 27 15.2% 3 14.3% 15 10.3%
CELLULAR
COMMUNICATIO
N/SIGNAL
TRANSDUCTION
MECHANISM
322 11.7% 16 12.1% 20 11.2% 1 4.8% 11 7.6%
CELL RESCUE,
DEFENSE AND
VIRULENCE
307 11.1% 10 7.6% 14 7.9% 5 23.8% 27 18.6%
INTERACTION
WITH THE
CELLULAR
ENVIRONMENT
86 3.1% 6 4.5% 6 3.4% - - 3 2.1%
INTERACTION
WITH THE
ENVIRONMENT
83 3.0% 3 2.3% 3 1.7% - - 3 2.1%
CELL FATE 159 5.8% 10 7.6% 15 8.4% 1 4.8% 8 5.5%
DEVELOPMENT 160 5.8% 9 6.8% 10 5.6% - - 9 6.2%
BIOGENESIS OF
CELLULAR
COMPONENTS
289 10.5% 11 8.3% 20 11.2% 3 14.3% 15 10.3%
DG, differentially expressed genes; grain yield-involved, genes involved in grain yield; GDMC-interaction, the grain yield-involved genes which
negatively interacted with grain dry matter content; GDMC-involved, genes involved in grain dry matter content; n, number of genes; p, p-value
for statistical significance. The symbol "-" represents data unavailable. The numbers in boldface represent significance at p < 0.05. The
percentages in italics represent the first two largest categories in each set of genes.
Fu et al. BMC Plant Biology 2010, 10:63
/>Page 10 of 15
Table 3: Statistical enrichment analyses of metabolic pathways.
Metabolic
pathway
Back-
ground
grain yield- involved GDMC-interacted GDMC-involved
Step 1 Step 2 Step 2 Step 2
nnpnpnpnp
Acyl-CoA
thioesterase
pathway
712.6E-113.2E-11 4.5E-2 1 2.7E-1
Aerobic respiration
electron donor II
36 3 1.7E-1 7 7.4E-3 - - 2 2.8E-1
Aerobic respiration
electron donor III
18 3 4.8E-2 7 9.6E-5
Betanidin
degradation
70 5 1.4E-1 6 1.5E-1 1 3.1E-1 5 1.5E-1
Calvin cycle (CO2
fixation)
35 4 6.9E-2 5 6.0E-2 1 1.9E-1 2 2.8E-1
Chlorophyllide a
biosynthesis
24 3 8.9E-2 5 1.7E-2 1 1.4E-1 3 9.6E-2
Cyanate
degradation
13 2 1.1E-1 3 4.6E-2 - - 1 3.6E-1
Cyclopropane and
cyclopropene fatty
acid biosynthesis
12 1 3.5E-1 3 3.8E-2
DIMBOA-glucoside
degradation
311.4E-111.8E-11 2.0E-2 1 1.4E-1
Fructose
degradation to
pyruvate and
lactate (anaerobic)
72 5 1.5E-1 6 1.6E-1 1 3.1E-1 8 2.1E-2
Glucose
fermentation to
lactate II
56 5 9.1E-2 5 1.6E-1 1 2.7E-1 6 4.6E-2
Glutathione redox
reactions I
7 - - 1 3.2E-1 1 4.5E-2 1 2.7E-1
Glycolysis I 69 6 7.7E-2 7 9.8E-2 1 3.1E-1 7 4.2E-2
Glycolysis IV (plant
cytosol)
63 5 1.2E-1 6 1.3E-1 1 2.9E-1 7 2.9E-2
IAA biosynthesis VI
(via indole-3-
acetamide)
6 - - 2 5.4E-2 1 3.9E-2 1 2.4E-1
Mannose
degradation
115.1E-217.0E-21 6.7E-3 1 5.3E-2
Btarch degradation 36 3 1.7E-1 4 1.4E-1 1 2.0E-1 1 2.8E-1
Sucrose
degradation III
35 6 5.6E-3 6 2.2E-2 1 1.9E-1 1 2.9E-1
Xylose degradation 5 1 2.1E-1 2 3.9E-2 1 3.3E-2 1 2.1E-1
Grain yield-involved, genes involved in grain yield; GDMC-interaction, the grain yield-involved genes which negatively interacted with grain dry matter
content; GDMC-involved, genes involved in grain dry matter content; n, number of genes; p, p-value for statistical significance. The symbol "-" represents
data unavailable. The data in boldface represent significance at p < 0.05.
Fu et al. BMC Plant Biology 2010, 10:63
/>Page 11 of 15
and belongs to the CCS52A class [27], were positively
associated with grain yield. This suggests that the APC-
dependent proteasome pathway may influence the endo-
cycle through the proteolysis of cyclins and regulation of
cyclin/CDK complexes. This deduction is consistent with
previous results, where higher expression levels of
CCS52A coincided with higher levels of endocycle in
Medicago nodules [27].
Cell expansion and endocycle are also controlled by
further mechanisms. The orthologue of ZmDRP1A
(MZ00014057) is a positive factor for cell expansion in
Arabidopsis [28,29]. In our study, it was positively associ-
ated with grain yield. In contrast, the orthologue of
ZmSMT2 (MZ00056596) in Arabidopsis impedes endo-
cycle [30]. In our study it was negatively associated with
grain yield. This suggests the regulatory role of both
genes in cell expansion during the maize seedling stage.
Recently, a study demonstrated that transcriptional co-
activators (AtMBF1s) play a significant role in controlling
leaf cell expansion and the ploidy level [31]. From our
results, a gene (MZ00003819; ZmMBF1c) encoding an
orthologue of AtMBF1c was highly positively associated
with grain yield and had a high fold-change across
hybrids. This suggests that ZmMBF1c could significantly
contribute to grain yield by controlling cell expansion
along with regulating endocycle in the maize seedling.
Auxin is a phytohormone that regulates cell expansion
and has been studied the most among all phytohormones
[32]. Four genes (MZ00038300, MZ00021497,
MZ00024781 and MZ00044325) encoding auxin-respon-
sive factors were associated with grain yield, and also two
genes (MZ00040986 and MZ00026772) encoding pro-
teins for IAA modification. Furthermore, two genes pos-
sibly involved in IAA synthesis were associated with grain
yield, indicating that the auxin signaling pathway could
directly contribute to grain yield of maize hybrids
throughout cell expansion.
Overlap of pathways involved in grain yield and grain
drymatter content
The fact that some metabolic genes were positively asso-
ciated with grain yield but negatively associated with
grain dry matter content suggests that overlaps exist at
the metabolic level. A part of the grain yield associated
genes located on regulatory or signaling pathways, such
as the ubiquitin pathway or phytohormone pathways
(Table 1 and Figure 3), were also associated with grain dry
matter content, suggesting that regulatory genes involved
in both traits are overlapping. When higher grain yield is
achieved in breeding programs by accumulating genes
positively associated with grain yield, these overlaps
could lead to a decrease in grain dry matter content,
resulting in higher post-harvest production costs due to
artificial grain drying [3]. The selection of lines with a
high expression of genes positively associated with one
trait but at the same time not negatively with the second
trait could result in a simultaneous increase of grain yield
and grain dry matter content.
Conclusions
We found that a high expression of genes involved in cell
expansion, assessed at the parental lines of hybrids, was
positively correlated with high grain yield of the hybrids.
Therefore we hypothesize that hybrids with a high cell
expansion rate have an advantage in growth and in grain
development. At the same time, they probably can also
provide more energy and substrates for growth, along
with cell expansion. However, due to a negative correla-
tion between grain yield and grain dry matter content,
this latent ability of high yielding hybrids has a negative
effect on grain dry matter content after harvest. Our
study greatly extended the understanding of the mecha-
nisms underlying grain yield at the molecular level. The
results suggest that selection of inbred lines after tran-
script profiling at the seedling stage can help increase
selection efficiency in maize breeding.
Methods
Field data
Seven flint and 14 dent elite inbreds developed in the
maize breeding program of the University of Hohenheim
were used as parental inbreds for 98 = 7 × 14 factorial
crosses between both groups of inbreds. The inbreds
comprised of eight dent lines with Iowa Stiff Stalk Syn-
thetic background (S028, S036, S044, S046, S049, S050,
S058, S067) and six with Iodent background (P033, P040,
P046, P048, P063, P066). Four flint lines (F037, F039,
F043, F047) had a European Flint background and three
(L024, L035, L043) a Flint/Lancaster background.
The factorial crosses were evaluated in 2002 at six agro-
ecologically diverse locations in Germany (Bad Krozin-
gen, Eckartsweier, Hohenheim, Landau, Sünching,
Vechta). The 21 inbred parents were evaluated for their
per se performance in 2003 at four locations (Eckarts-
weier, Hohenheim, Sünching, Pocking) and in 2004 at
three locations (Eckartsweier, Hohenheim, Bad Krozin-
gen). The trials were evaluated in two-row plots using
adjacent α designs with two to three replications. Hybrid
performance for grain yield (PY) was assessed in Mg ha
-1
adjusted to 155 g kg
-1
grain moisture and hybrid perfor-
mance for grain dry matter content (PD) in percent. The
mid-parent heterosis of the hybrids for grain yield (HY)
and grain dry matter content (HD) was determined. The
field data were analyzed with a mixed linear model, which
was described in detail in a previous study [33], where it
was referred to as Experiment 1. The correlation between
PY and PD was tested using a permutation test [34]. The
Fu et al. BMC Plant Biology 2010, 10:63
/>Page 12 of 15
distribution of the test statistic was approximated with
Monte Carlo sampling using 9,999 samples.
Microarray data
Seedlings of the 21 maize inbred lines were grown in a
climate chamber under regulated growth conditions.
RNA was isolated from a mixture of five seedlings of each
line, which were 7 days old. The 46 k array from the maize
oligonucleotide array project />, University of Arizona, USA) was used for transcription
profiling [7]. For the microarray experiment an interwo-
ven loop design [35] was applied. It resulted in 63 hybrid-
izations of dent and flint lines by sampling each dent line
five times and each flint line eight times. Blank and nega-
tive controls, which were located in all blocks of the array,
were used to confirm the stability of the experiment.
Because no Spike-in RNA was mixed into the isolated
RNA, all Spike-in probes, were used as blank or negative
controls. For experimental validation of the microarray
experiment, two genes in eight different lines were evalu-
ated by Quantitative RT-PCR, essentially in accordance
with the microarray data. The microarray data were
deposited in Gene Expression Omnibus (GEO) under the
series accession GSE17754.
The gene-oriented probes with intensities (on a log2
scale) greater than the average intensity plus three times
the standard deviation of all Spike-in probes were consid-
ered to be reliably expressed. Genes were further ana-
lyzed for differential expression, if their expression fold-
changes between at least one pair of parental lines were
greater than 1.3. The gene-oriented probes together with
Spike-in probes were tested for statistically significant dif-
ferential expression across all comparisons with a moder-
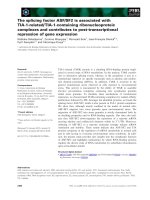
Figure 2 Representation of grain yield-involved genes in sucrose
degradation and glycolysis pathways. The rectangular boxes with
the colored scales show the fold-changes (FD) of mid-parent expres-
sion for each gene. The mean mid-parent expression (log2 scale) is rep-
resented by the numbers in the boxes. Positively (P) and negatively (N)
associated genes are shown in brown and blue, respectively. The box-
es with two frames show genes with interactions to grain dry matter
content (GDMC).
glucose-1-P
UDP-glucose
glucose-6-P
fructose-6-P
glucose
fructose
fructose-1,6-bis-P
PPi
Pi
ATP
ADP
glycerinaldehyde-3-P
dihydroxyacetone-P
glycerate-1,3-bis-P
glycerate-3-P
glycerate-2-P
PEP
pyruvate
8.8
10.3
8.2
8.2
10.1
11.2
9.9
10.7
12.0
8.7
8.9
9.7
10.4
starch
SUCROSE
Invertase
HXK
PFK
PFP
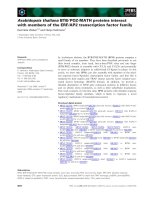
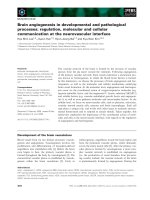
Figure 3 Schematic representation of grain yield-involved genes
in cell expansion and endocycle processes. The rectangular boxes
with the colored scales show the fold-changes (FD) of mid-parent ex-
pression for each gene. The mean mid-parent expression (log2 scale)
is represented by the numbers in the boxes. Positively (P) and nega-
tively (N) associated genes are shown in brown and blue, respectively.
The boxes with two frames show genes with interactions to grain dry
matter content (GDMC). The representation of the cell cycle genes reg-
ulating endocycle were taken from a previous review [25].
8.8
chloroplast division
10.1
7.7 8.2
8.1
8.3
8.5
8.3 9.0
8.7
9.0
9.5
8.4
12.3
9.7
9.8
8.5
CCS52A
8.5
8.9
8.1
8.7 8.9
7.6
8.7
Fu et al. BMC Plant Biology 2010, 10:63
/>Page 13 of 15
ated F-test and subsequently with a nested F-test for each
comparison of parental lines. The LIMMA package [36]
was applied for the tests. According to the most signifi-
cant Spike-in probe with an adjusted p-value of 0.049, a
false discovery rate (FDR) of 0.01 was chosen as a more
conservative cutoff in order to detect significant differen-
tial expression between inbred lines. For each differen-
tially expressed gene, we calculated the average L of the
expression level (log2 scale) in the parents of each hybrid.
Correlation analysis
The correlations r(L, PY), r(L, PD) r(L, HY), and r(L, HD)
between the average expression level of a gene in the
parental lines and the hybrid performance and heterosis
for grain yield and grain dry matter content, respectively,
were determined. Significance of the correlations was
tested with a t-test with n - 2 degrees of freedom, where n
= 98 is the number of hybrids in the factorial. A type I
error rate of 0.01 adjusted for multiple testing using a
false discovery rate [37] was employed and the p-value of
each gene was adjusted accordingly. Confidence intervals
for the correlations were determined based on Bca (bias-
corrected accelerated) bootstrap (α = 95%, 10,000 resam-
ples) [38].
We employed a newly developed two-step correlation
approach to identify genes associated with grain yield
(Figure 1). In Step 1, all genes for which the correlations
r(L, PY) or r(L, HY) were highly significant (p < 0.0001)
were assigned to the set S. In Step 2, such genes that were
not included in set S in the previous step but were highly
correlated (r > 0.9) with genes included in set S in the pre-
vious step, were then added to S. Step 2 was iteratively
repeated until no new genes were added to set S.
To determine a set of genes T associated with grain dry
matter content we carried out a similar approach, but
here only the correlations for hybrid performance r(L,
PD) were considered in Step 1, because heterosis for grain
dry matter content is low in maize [39].
The stability of the correlations was investigated with a
cross validation procedure. In the cross validation, five
dent and three flint lines were selected from the 7 × 14
factorial to compile the estimation set [40]. The set of
trait associated genes was determined in the estimation
sets generated by 100 rounds of cross validation. For each
gene, it was determined how often it was assigned to the
set of the trait associated genes in the 100 estimation sets.
The genes were arranged according to this frequency and
the sequence of the first 200 genes was compared to the
sequence of the 200 genes with the smallest p-value
determined from the complete data set. The difference
between these two sets of genes was used as a measure
for the instability of the correlations which were intro-
duced by the genetic background.
Pathway annotation
Comprehensive pathway annotation is the first step in
mining the pathways underlying biological processes.
The representative consensus sequences of all gene-ori-
ented probes were searched using BLAST against the
TIGR rice protein database />, the
TAIR Arabidopsis protein database bidop-
sis.org/, and the Uniprot Knowledgebase http://
www.ebi.ac.uk/, which includes the Swissprot Knowl-
edgebase and the Trembl database. The functional anno-
tations were assigned based on sequence similarity (e-
value < 1e-5) with manual adjustment when necessary.
Transcription factors, one of the most important compo-
nents of regulatory networks, were organized into differ-
ent gene families or sub-families based on the
classification of the most similar rice transcription factors
/>. Applying the same
approach, protein kinases, located in signaling transduc-
tion pathways, were classified through the rice protein
kinase database />. Genes involved
in phytohormone signaling pathways were annotated by
searching curated annotations (keyword item) of similar
proteins in the Swissprot Knowledgebase. Cell cycle
genes were re-annotated following the classification in
Arabidopsis [41]. All gene-oriented probes were grouped
into functional categories based on the MIPS Functional
Catalogue of Arabidopsis, which is efficient for grouping
cereal genes
[42], and metabolic path-
ways based on RiceCyc />way/. We identified the statistically enriched MIPS
category or metabolic pathway of the trait-involved genes
based on a background distribution employing the hyper-
geometric distribution [43].
Additional material
Abbreviations
HD: mid-parent heterosis for grain dry matter content; HY: mid-parent heterosis
for grain yield; PD: hybrid performance for grain dry matter content; PY: hybrid
performance for grain yield; r: correlation coefficient.
Authors' contributions
JF conducted the statistical analysis, interpreted the results and wrote the
paper; AT grew the plants, performed all microarray hybridizations and helped
to write the paper; TAS gathered and analyzed the field data; AEM, SS, and MF
Additional file 1 Number of genes, which were differentially
expressed in the parents of each hybrid of the factorial mating
scheme. A moderated F-test with a significance level of 0.01 and a fold
change of at least 1.3 was used to detect the differentially expressed genes.
Additional file 2 List of trait-involved genes including comprehensive
annotation. The genes involved in grain yield and grain dry matter content
(GDMC) were collected through Step 1 (F) and Step 2 (S). For each gene, the
mean and the fold-change (FD) of mid-parent expression were calculated;
positive (P) or negative (N) association to grain yield and GDMC is also pro-
vided. The correlation (r) of each gene with hybrid performance for grain
yield (PY), mid-parent heterosis for grain yield (HY), hybrid performance for
GDMC (PD) and the respective p-values (p) were listed.
Fu et al. BMC Plant Biology 2010, 10:63
/>Page 14 of 15
devised and planned the study, contributed to the lab analysis, and contrib-
uted to the writing of the paper. All authors read and approved the final manu-
script.
Acknowledgements
The authors thank Lixing Yuan and Riliang Gu (China Agricultural University) for
their helpful comments on this manuscript. This work was funded by the
Deutsche Forschungsgemeinschaft (DFG, German Research Foundation)
within the priority program SPP 1149 "Heterosis in Plants" (grant no. FR 1615/4-
1).
Author Details
1
Institute of Plant Breeding, Seed Science and Population Genetics, University
of Hohenheim, 70599 Stuttgart, Germany,
2
Biocenter Klein Flottbek, University
of Hamburg, 22609 Hamburg, Germany and
3
Institute of Agronomy and Plant
Breeding II, Justus Liebig University, 35392 Giessen, Germany
References
1. Rosegrant MW, Paisner MS, Meijer S, Witcover J: Global food projections
to 2020: Emerging trends and alternative futures. Washington, D. C:
International Food Policy Research Institute; 2001.
2. Duvick DN: The contribution of breeding to yield advances in maize
(Zea mays L.). In Advances in Agronomy Volume 86. Edited by: Sparks DL.
New York: Elsevier Inc; 2005:83-145.
3. Tuberosa R, Salvi S: QTL for Agronomic Traits in Maize Production. In
Handbook of Maize: Its Biology Edited by: Bennetzen JL, Hake SC. New York:
Springer; 2009:501-541.
4. Sakamoto T, Matsuoka M: Identifying and exploiting grain yield genes
in rice. Curr Opin Plant Biol 2008, 11:209-214.
5. Liu X, Fu J, Gu D, Liu W, Liu T, Peng Y, Wang J, Wang G: Genome-wide
analysis of gene expression profiles during the kernel development of
maize (Zea mays L.). Genomics 2008, 91:378-387.
6. Zhu Y, Fu J, Zhang J, Liu T, Jia Z, Wang J, Jin Y, Lian Y, Wang M, Zheng J,
Hou W, Wang G: Genome-wide analysis of gene expression profiles
during ear development of maize. Plant Mol Biol 2009, 70:63-77.
7. Thiemann A, Fu J, Schrag TA, Melchinger AE, Frisch M, Scholten S:
Correlation between parental transcriptome and field data for the
characterization of heterosis in Zea mays L. Theor Appl Genet 2010,
120:401-413.
8. Olsen AN, Ernst HA, Leggio LL, Skriver K: NAC transcription factors:
structurally distinct, functionally diverse. Trends Plant Sci 2005, 10:79-87.
9. Stupar RM, Gardiner JM, Oldre AG, Haun WJ, Chandler VL, Springer NM:
Gene expression analyses in maize inbreds and hybrids with varying
levels of heterosis. BMC Plant Biol 2008, 8:33.
10. Fernandes J, Morrow DJ, Casati P, Walbot V: Distinctive transcriptome
responses to adverse environmental conditions in Zea mays L. Plant
Biotechnol J 2008, 6:782-798.
11. Meyer S, Pospisil H, Scholten S: Heterosis associated gene expression in
maize embryos 6 days after fertilization exhibits additive, dominant
and overdominant pattern. Plant Mol Biol 2007, 63:381-391.
12. Causse M, Rocher JP, Henry AM, Charcosset A, Prioul JL, De Vienne D:
Genetic dissection of the relationship between carbon metabolism
and early growth in maize, with emphasis on key-enzyme loci. Mol
Breeding 1995, 1:259-272.
13. Dennis DT, Blakeley SD: Carbohydrate Metabolism. In Biochemistry &
molecular biology of plants Edited by: Buchanan BB, Gruissem W, Jones RL.
Rockville: American Society of PlantPhysiologists; 2000:630-675.
14. Roitsch T: Source-sink regulation by sugar and stress. Curr Opin Plant
Biol 1999, 2:198-206.
15. Balibrea Lara ME, Gonzalez Garcia M, Fatima T, Ehness R, Lee TK, Proels R,
Tanner W, Roitsch T: Extracellular invertase is an essential component of
cytokinin-mediated delay of senescence. Plant Cell 2004, 16:1276-1287.
16. Brzobohatý B, Moore I, Kristoffersen P, Bako L, Campos N, Schell J, Palme K:
Release of active cytokinin by a beta-glucosidase localized to the
maize root meristem. Science 1993, 262:1051-1054.
17. D'Agostino IB, Deruère J, Kieber JJ: Characterization of the response of
the Arabidopsis response regulator gene family to cytokinin. Plant
Physiol 2000, 124:1706-1717.
18. Doerner P: Signals and Mechanisms in the Control of Plant Growth. In
Plant Growth Signaling Edited by: Bögre L, Beemster G. Heidelberg:
Springer; 2008:1-23.
19. Spillane C, Vielle-Calzada J, Grossniklaus U: Parent-of-origin effects and
seed development: Genetics and epigenetics. In Transgenic Plants and
Crops Edited by: Hui TH, Khachatourians GG, McHughen A, Nip WK, Scorza
R. New York: Marcel-Dekker Inc; 2000:109-135.
20. Maeshima M: Tonoplast transporters: Organization and function. Annu
Rev Plant Physiol Plant Mol Biol 2001, 52:469-497.
21. Cosgrove DJ: Growth of the plant cell wall. Nat Rev Mol Cell Biol 2005,
6:850-861.
22. Hoecker N, Keller B, Piepho H, Hochholdinger F: Manifestation of
heterosis during early maize (Zea mays L.) root development. Theor
Appl Genet 2006, 112:421-429.
23. Mori T, Kuroiwa H, Takahara M, Miyagishima SY, Kuroiwa T: Visualization
of an FtsZ ring in chloroplasts of Lilium longiflorum leaves. Plant Cell
Physiol 2001, 42:555-559.
24. Yoshizumi T, Breuer C, Matsui M, Sugimoto-Shirasu K: Plant Cell Growth
Signalling and Its Link to Ploidy. In Plant Growth Signaling Edited by:
Bögre L, Beemster G. Heidelberg: Springer; 2008:107-125.
25. Vlieghe K, Inzé D, Veylder LD: Physiological Relevance and Molecular
Control of the Endocycle in Plants. In Cell Cycle Control and Plant
Development Edited by: Dirk Inzé. Oxford: Blackwell Publishing Ltd;
2007:227-248.
26. Verkest A, Manes CDO, Vercruysse S, Maes S, Schueren E Van Der,
Beeckman T, Genschik P, Kuiper M, Inzé D, De Veylder L: The cyclin-
dependent kinase inhibitor KRP2 controls the onset of the
endoreduplication cycle during Arabidopsis leaf development
through inhibition of mitotic CDKA;1 kinase complexes. Plant Cell 2005,
17:1723-1736.
27. Tarayre S, Vinardell JM, Cebolla A, Kondorosi A, Kondorosi E: Two classes
of the CDh1-type activators of the anaphase-promoting complex in
plants: novel functional domains and distinct regulation. Plant Cell
2004, 16:422-434.
28. Kang B, Busse JS, Bednarek SY: Members of the Arabidopsis dynamin-
like gene family, ADL1, are essential for plant cytokinesis and polarized
cell growth. Plant Cell 2003, 15:899-913.
29. Konopka CA, Bednarek SY: Comparison of the dynamics and functional
redundancy of the Arabidopsis dynamin-related isoforms DRP1A and
DRP1C during plant development. Plant Physiol 2008, 147:1590-1602.
30. Hase Y, Fujioka S, Yoshida S, Sun G, Umeda M, Tanaka A: Ectopic
endoreduplication caused by sterol alteration results in serrated petals
in Arabidopsis. J Exp Bot 2005, 56:1263-1268.
31. Tojo T, Tsuda K, Yoshizumi T, Ikeda A, Yamaguchi J, Matsui M, Yamazaki K:
Arabidopsis MBF1s Control Leaf Cell Cycle and its Expansion. Plant Cell
Physiol 2009, 50:254-264.
32. Öpik H, Rolfe SA: The Physiology of Flowering Plants 4th edition. Cambridge:
Cambridge University Press; 2005.
33. Schrag TA, Melchinger AE, Sørensen AP, Frisch M: Prediction of single-
cross hybrid performance for grain yield and grain dry matter content
in maize using AFLP markers associated with QTL. Theor Appl Genet
2006, 113:1037-1047.
34. Davison AC, Hinkley DV: Bootstrap Methods and Their Application
Cambridge: Cambridge University Press; 1997.
35. Kerr MK, Churchill GA: Experimental design for gene expression
microarrays. Biostatistics 2001, 2:183-201.
36. Smyth GK: Linear models and empirical bayes methods for assessing
differential expression in microarray experiments. Stat Appl Genet Mol
Biol 2004, 3:. Article3
37. Benjamini Y, Hochberg Y: Controlling the false discovery rate: a practical
and powerful approach to multiple testing. J R Stat Soc, Ser B
1995:289-300.
38. Efron B, Tibshirani R: An introduction to the bootstrap New York: Chapman
& Hall, Inc; 1993.
39. Schrag TA, Möhring J, Maurer HP, Dhillon BS, Melchinger AE, Piepho H,
Sørensen AP, Frisch M: Molecular marker-based prediction of hybrid
performance in maize using unbalanced data from multiple
experiments with factorial crosses. Theor Appl Genet 2009, 118:741-751.
40. Schrag TA, Maurer HP, Melchinger AE, Piepho H, Peleman J, Frisch M:
Prediction of single-cross hybrid performance in maize using
Received: 26 August 2009 Accepted: 12 April 2010
Published: 12 April 2010
This article is available from: 2010 Fu et al; licensee BioMed Central Ltd . This is an Open Access article distributed under the terms of the Creative Commons Attribution License ( ), which permits unrestricted use, distribution, and reproduction in any medium, provided the original work is properly cited.BMC Plant Biology 201 0, 10:63
Fu et al. BMC Plant Biology 2010, 10:63
/>Page 15 of 15
haplotype blocks associated with QTL for grain yield. Theor Appl Genet
2007, 114:1345-55.
41. Vandepoele K, Raes J, De Veylder L, Rouzé P, Rombauts S, Inzé D:
Genome-wide analysis of core cell cycle genes in Arabidopsis. Plant
Cell 2002, 14:903-916.
42. Ruepp A, Zollner A, Maier D, Albermann K, Hani J, Mokrejs M, Tetko I,
Güldener U, Mannhaupt G, Münsterkötter M, Mewes HW: The FunCat, a
functional annotation scheme for systematic classification of proteins
from whole genomes. Nucleic Acids Res 2004, 32:5539-5545.
43. Mao X, Cai T, Olyarchuk JG, Wei L: Automated genome annotation and
pathway identification using the KEGG Orthology (KO) as a controlled
vocabulary. Bioinformatics 2005, 21:3787-3793.
doi: 10.1186/1471-2229-10-63
Cite this article as: Fu et al., Dissecting grain yield pathways and their inter-
actions with grain dry matter content by a two-step correlation approach
with maize seedling transcriptome BMC Plant Biology 2010, 10:63