ECG in the Child and Adolescent - part 3 pptx
Bạn đang xem bản rút gọn của tài liệu. Xem và tải ngay bản đầy đủ của tài liệu tại đây (93.1 KB, 10 trang )
P1: FAW/SPH P2: FAW/SPH QC: FAW/SPH T1: FAW
BLUK054-Lue June 19, 2006 13:40
2
P1: FAW/SPH P2: FAW/SPH QC: FAW/SPH T1: FAW
BLUK054-Lue June 19, 2006 13:40
CHAPTER 1.1
Heart rate by age
50
60
70
80
90
100
110
120
130
140
150
160
170
180
190
0-1 1-3 3-7 7-30 1-3 3-6 6-12 1-3 3-6 6-9 9-13 13-18
Heart Rate per Minute
95%
75%
50%
25%
5%
Age, days Age, months Age, years
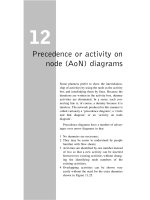
Figure 1.1 Heart rate by age, each curve corresponding to the indicated percentile level
(• = mean). Striking changes in heart rate are noted from newborn to adolescence. The heart rate
increases from birth to ages 7–30, days and 1–3 months. From that age forward, the heart rate
decreases with increasing age, most rapidly from age 6–12 months to 1–3 years.
Days Months Years
Age 0–1 1–3 3–7 7–30 1–3 3–6 6–12 1–3 3–6 6–9 9–13 13–18
95% 150 152 163 169 169 154 161 126 117 119 119 105
Mean 131 132 137 148 148 135 130 105 94 94 91 80
(±SD) 12.86 13.07 15.91 15.58 14.66 11.70 18.67 13.09 11.96 14.68 14.08 14.50
5% 109 111 111 124 126 120 103 85 75 74 70 58
(N) 109 128 95 100 113 91 97 113 107 99 289 510
3
P1: FAW/SPH P2: FAW/SPH QC: FAW/SPH T1: FAW
BLUK054-Lue June 19, 2006 13:40
CHAPTER 1.2
PR interval by age
70
80
90
100
110
120
130
140
150
160
170
180
0-1 1-3 3-7 7-30 1-3 3-6 6-12 1-3 3-6 6-9 9-13 13-18
PR Interval in Milliseconds
95%
75%
50%
25%
5%
Age, days Age, months Age, years
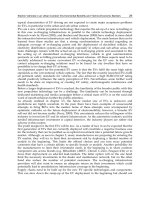
Figure 1.2 PR interval by age, each curve corresponding to the indicated percentile level
(• = mean). The PR interval remains little changed after birth and during early infancy. It
increases with increasing age, from age 6 months through to adolescence.
Days Months Years
Age 0–1 1–3 3–7 7–30 1–3 3–6 6–12 1–3 3–6 6–9 9–13 13–18
95% 127 130 131 131 128 131 140 152 152 152 158 170
Mean 112 112 111 111 108 111 118 126 129 131 134 140
(±SD) 10.65 11.54 12.65 13.48 11.81 11.36 12.93 10.85 10.56 14.52 17.35 17.94
5% 94 96 93 92 92 96 100 108 112 110 112 116
(N) 109 128 95 100 113 91 97 113 107 99 289 510
4
P1: FAW/SPH P2: FAW/SPH QC: FAW/SPH T1: FAW
BLUK054-Lue June 19, 2006 13:40
CHAPTER 1.3
PR interval by heart rate
0
20
40
60
80
100
120
140
160
180
200
1-69 70-79 80-89 90-99 100-109 110-119 120-129 130-139 140-149 150-
Heart Rate per Minute
PR Interval in Milliseconds
95%
75%
50%
25%
5%
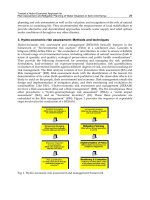
Figure 1.3 PR Interval by heart rate, each curve corresponding to the indicated percentile
level (• = mean). The PR interval decreases slightly along with increasing heart rate during the
entire pediatric ages.
Heart
rate 1–69 70–79 80–89 90–99 100–109 110–119 120–129 130–139 140–149 150–
95% 179 166 163 154 153 154 140 131 127 134
Mean 142 137 137 133 129 124 116 113 109 111
(±SD) 21.54 18.53 15.96 13.71 14.91 17.48 14.94 0.00 0.00 0.00
5% 114 111 112 112 104 98 99 95 93 92
(N) 143 206 274 247 178 127 174 200 158 177
5
P1: FAW/SPH P2: FAW/SPH QC: FAW/SPH T1: FAW
BLUK054-Lue June 19, 2006 13:40
CHAPTER 1.4
QT interval by age
0
50
100
150
200
250
300
350
400
450
0-1 1-3 3-7 7-30 1-3 3-6 6-12 1-3 3-6 6-9 9-13 13-18
QT Interval in Milliseconds
95%
75%
50%
25%
5%
Age, yearsAge, days Age, months
Figure 1.4 QT interval by age, each curve corresponding to the indicated percentile level
(• = mean). The QT interval decreases slightly after birth, reaching the lowest at age 7–30 days.
From that age forward, the QT interval increases along with increasing age up to adolescence.
Days Months Years
Age 0–1 1–3 3–7 7–30 1–3 3–6 6–12 1–3 3–6 6–9 9–13 13–18
95% 333 320 296 289 293 311 321 350 363 373 372 400
Mean 291 277 265 259 269 281 285 318 331 336 337 352
(±SD) 26.63 23.09 17.92 17.85 18.90 15.95 23.81 21.69 21.11 23.41 26.02 27.00
5% 251 244 239 237 240 258 249 287 298 300 298 309
(N) 109 128 95 100 113 91 97 113 107 99 289 510
6
P1: FAW/SPH P2: FAW/SPH QC: FAW/SPH T1: FAW
BLUK054-Lue June 19, 2006 13:40
CHAPTER 1.5
QT interval by heart rate
200
215
230
245
260
275
290
305
320
335
350
365
380
395
410
425
440
455
470
485
500
1-69 70-79 80-89 90-99 100-109 110-119 120-129 130-139 140-149 150-
Heart Rate per Minute
QT Interval in Milliseconds
95%
75%
50%
25%
5%
Figure 1.5 QT interval by heart rate, each curve corresponding to the indicated percentile
level (• = mean). The QT interval decreases in striking accordance with the increasing heart rate.
Heart
rate 1–69 70–79 80–89 90–99 100–109 110–119 120–129 130–139 140–149 150–
95% 413 392 371 356 339 328 313 303 295 280
Mean 378 359 345 331 319 305 287 278 271 254
(±SD) 21.54 17.50 15.46 14.51 15.18 16.39 15.61 0.00 0.00 0.00
5% 344 332 319 308 293 277 261 255 245 229
(N) 143 206 274 247 178 127 174 200 158 177
7
P1: FAW/SPH P2: FAW/SPH QC: FAW/SPH T1: FAW
BLUK054-Lue June 19, 2006 13:40
CHAPTER 1.6
QTc interval by age
0
100
200
300
400
500
600
0-1 1-3 3-7 7-30 1-3 3-6 6-12 1-3 3-6 6-9 9-13 13-18
QTc in Milliseconds
95%
75%
50%
25%
5%
Age, days Age, yearsAge, months
Figure 1.6 QTc interval by age, each curve corresponding to the indicated percentile level
(• = mean). The corrected QT interval decreases slightly after birth, and returns to the previous
level by age 1–3 months, then remains unchanged until adolescence.
Days Months Years
Age 0–1 1–3 3–7 7–30 1–3 3–6 6–12 1–3 3–6 6–9 9–13 13–18
95% 478 451 434 459 452 455 453 449 442 450 445 446
Mean 431 412 402 408 423 424 419 421 415 420 415 407
(±SD) 26.44 23.09 19.15 25.15 20.56 17.50 20.17 16.27 15.83 18.09 17.35 23.52
5% 392 380 372 375 391 395 386 388 389 390 384 367
(N) 109 128 95 100 113 91 97 113 107 99 289 510
8
P1: FAW/SPH P2: FAW/SPH QC: FAW/SPH T1: FAW
BLUK054-Lue June 19, 2006 13:40
CHAPTER 1.7
QTc interval by heart rate
300
320
340
360
380
400
420
440
460
480
1-69 70-79 80-89 90-99 100-109 110-119 120-129 130-139 140-149 150-
Heart Rate per Minute
QTc Interval in Milliseconds
95%
75%
50%
25%
5%
Figure 1.7 QTc interval by heart rate, each curve corresponding to the indicated percentile
level (• = mean). The corrected QT interval increases slightly and steadily with increasing heart
rate up to a rate of 110–119 per minute, then remains little or unchanged.
Heart
rate 1–69 70–79 80–89 90–99 100–109 110–119 120–129 130–139 140–149 150–
95% 430 440 445 448 451 456 453 459 459 458
Mean 391 404 413 418 422 424 416 419 422 416
(±SD) 22.76 19.70 17.90 18.44 19.74 22.19 21.81 0.00 0.00 0.00
5% 354 371 384 385 392 388 379 383 383 383
(N) 143 206 274 247 178 127 174 200 158 177
9
P1: FAW/SPH P2: FAW/SPH QC: FAW/SPH T1: FAW
BLUK054-Lue June 19, 2006 13:40
CHAPTER 1.8
QRS duration by age
0
20
40
60
80
100
120
0-1 1-3 3-7 7-30 1-3 3-6 6-12 1-3 3-6 6-9 9-13 13-18
QRS Duration in Milliseconds
95%
75%
50%
25%
5%
Age, days Age, months Age, years
Figure 1.8 QRS duration by age, each curve corresponding to the indicated percentile level
(• = mean). QRS duration steadily and gradually increases with increasing age, from birth to
adolescence.
Days Months Years
Age 0–1 1–3 3–7 7–30 1–3 3–6 6–12 1–3 3–6 6–9 9–13 13–18
95% 91 89 87 82 91 92 94 99 99 97 102 112
Mean 70 71 72 71 74 78 79 84 86 86 89 96
(±SD) 10.65 11.54 9.44 8.06 10.55 8.31 9.04 10.85 10.56 7.53 8.67 9.85
5% 56 57 58 59 58 65 65 71 71 74 76 80
(N) 109 128 95 100 113 91 97 113 107 99 289 510
10
P1: FAW/SPH P2: FAW/SPH QC: FAW/SPH T1: FAW
BLUK054-Lue June 19, 2006 13:40
CHAPTER 1.9
RR interval by age
0
200
400
600
800
1000
1200
0-1 1-3 3-7 7-30 1-3 3-6 6-12 1-3 3-6 6-9 9-13 13-18
RR Interval in Milliseconds
95%
75%
50%
25%
5%
Age, yearsAge, days Age, months
Figure 1.9 RR interval by age, each curve corresponding to the indicated percentile level
(• = mean). The RR interval decreases slightly from birth to ages 7–30 days and 1–3 months.
From that age forward, the RR interval increases with a wider range along with increasing age
until adolescence.
Days Months Years
Age 0–1 1–3 3–7 7–30 1–3 3–6 6–12 1–3 3–6 6–9 9–13 13–18
95% 547 541 537 483 472 500 583 705 795 805 849 1023
Mean 460 458 441 410 407 445 471 580 646 650 672 767
(±SD) 47.94 46.18 53.46 48.33 40.57 37.92 71.09 75.93 79.16 96.94 95.41 138.81
5% 391 391 368 354 354 390 372 473 507 494 501 568
(N) 109 128 95 100 120 92 97 113 107 100 289 514
11