Báo cáo y học: " Bioelectrical impedance analysis in clinical practice: implications for hepatitis C therapy BIA and hepatitis C" pptx
Bạn đang xem bản rút gọn của tài liệu. Xem và tải ngay bản đầy đủ của tài liệu tại đây (1.15 MB, 8 trang )
RESEARC H Open Access
Bioelectrical impedance analysis in clinical
practice: implications for hepatitis C therapy BIA
and hepatitis C
Alisan Kahraman
1
, Johannes Hilsenbeck
1,2
, Monika Nyga
1
, Judith Ertle
1
, Alexander Wree
1
, Mathias Plauth
3
,
Guido Gerken
1
, Ali E Canbay
1*
Abstract
Background: Body composition analysis using phase angle (PA), determined by bioelectrical impedance analysis
(BIA), reflects tissue electrical properties and has prognostic value in liver cirrhosis. Objective of this prospective
study was to investigate clinical use and prognostic value of BIA-derived phase angle and alterations in body
composition for hepatitis C infection (HCV) following antiviral therapy.
Methods: 37 consecutive patients with HCV infection were enrolled, BIA was performed, and PA was calculated
from each pair of measurements. 22 HCV genotype 3 patients treated for 24 weeks and 15 genotype 1 patients
treated for 48 weeks, were examined before and after antiviral treatment and compared to 10 untreated HCV
patients at 0, 24, and 48 weeks. Basic laboratory data were correlated to body composition alterations.
Results: Significant reduction in body fat (BF: 24.2 ± 6.7 kg vs. 19.9 ± 6.6 kg, genotype1; 15.4 ± 10.9 kg vs. 13.2 ±
12.1 kg, genotype 3) and body cell mass (BCM: 27.3 ± 6.8 kg vs. 24.3 ± 7.2 kg, genotype1; 27.7 ± 8.8 kg vs. 24.6 ±
7.6 kg, genotype 3) was found following treatment. PA in genotype 3 patients was significantly lowered after
antiviral treatment compared to initial measurements (5.9 ± 0.7° vs. 5.4 ± 0.8°). Total body water (TBW) was
significantly decreased in treated patients with genotype 1 (41.4 ± 7.9 l vs. 40.8 ± 9.5 l). PA reduction was
accompanied by flu-like syndromes, whereas TBW decline was more frequently associated with fatigue and
cephalgia.
Discussion: BIA offers a sophisticated analysis of body composition including BF, BCM, and TBW for HCV patients
following antiviral regimens. PA reduction was associated with increased adverse effects of the antiviral therapy
allowing a more dynamic therapy application.
Background
Bioelectrical impedance analysis (BIA) has been intro-
duced as a n on-invasive, rapid, easy to perform, repro-
ducible, and safe technique for the analysis of body
composition [1]. It is based on the assumption t hat an
electric current is conducted well by water and electro-
lyte-containing parts of a body but poorly by fat and
bone mass. A fixed, low-voltage, high-frequency alter-
nating current introduced into the human body or tissue
is conducted almost completely through the fluid
compartment of the fat-free mass [2]. BIA measures
parameters such as resistance (R) and capacitance (Xc)
by recording a voltage drop in applied current [3]. Capa-
citance causes the current to lag behind the voltage,
which creates a phase shift. This shift is quantified geo-
metrically as the a ngular transformation of the ratio of
capacitance to resistance, or the phase angle (PA) [4].
PA reflects the relative c ontribution of fluid (resistance)
and cellular membranes (capacitance ) of the human
body. By definition, PA is positively associated with
capacitance and negatively associated with resistance [4].
PA can also be interpreted as an indicator of water dis-
tribution between the extra- and intracellular space, one
of the most sensitive indicators of malnutrition [5,6].
* Correspondence:
1
University Clinic Duisburg-Essen, Department of Gastroenterolgy and
Hepatology, Hufelandstrasse 55, 45122 Essen, Germany
Full list of author information is available at the end of the article
Kahraman et al. Virology Journal 2010, 7:191
/>© 2010 Kahraman et al; licensee BioMed Central Ltd. This is an Open Access article distributed under the terms of the Creative
Commons Attribution License ( 2.0), which permits u nrestricted use, distribution, and
reproduction in any medium, provided the original work is properly cited.
BIA-derived PA could serveasprognosticmarkerin
several clinical conditions where cell membrane integ-
rity is comp romised and alteratio ns in fluid balance
are noted, such as malnutrition in advanced neoplastic
diseases or decompensated liver cirrhosis [2,7-21].
However, there are no data on body composition in
patients with HCV infection before and after antiviral
treatment which is an important factor for treatment
decisions, especially if supplemental therapy is needed.
Indeed, interferon-a (IFN-a) and ribavirin treatment in
HCV is ofte n associated with f atigue, cephalgia, weight
loss, flu-like syndromes, and anorexia [22], implying
changes in nutritional status and b ody composition
[23].
Objective
The primary objective of the present study was to pro-
spectively evaluate effects of antiviral therapy on BIA-
derived PA as a simple method for t he estimation of
bod y cell mass (BCM), body fat (BF), extracellular mass
(ECM), and t otal body water (TBW) in 37 patients with
chronic HCV infection.
Study Design
Patient population
The study was performed on a consecutive case series
of 37 patients wit h chronic HCV infection (October
2008 - September 2009). Inclusion criteria were age ≥
18 years, chronic HCV infection, and a liver biopsy per-
formed within the last 6 months. Exclusion criteria
included decompensated liver disease, peripheral
oedema, pre-existent malnutrition, decreased albumin
levels (< 3.4 g/dl), hepatocellular carcinoma (HCC),
active alcohol abuse, co-infection with HBV or HIV,
chronic renal failure (GFR < 50 ml/min./1.73 m
2
), and
overt diabe tes. Treated patients were divided into 2
groups accordin g to HCV genotype a nd duration of
antiviral therapy. All patients underwent baseline
laboratory measurements. Full written informed consent
was obtained from all subjects before entry into the
study, and the clinic’s ethics committee approved the
protocol. All of the treated HCV patients received pegy-
lated interferon-a (1.5 mg/kg body weight weekly s.c.)
and ribavirin (12 mg/kg body weight daily p. o.) as anti-
viral therapy and completed the 24 or 48 week cycle
with the starting dose. Patients with the need of dose
adjustment were excluded in order to avoid effects of
the dose on alterations in body composition. In addi-
tion, none of the included patients needed supportive
medication with granulokine or epo. Moreover, no
patient received other antiviral or steatosis-inducing
drugs. Occurrence and severity of side effects was moni-
tored by a study nurse who was blinded to the results
of BIA measurements.
Virology
All HCV patients had a positive anti-HCV status (CMIA
anti-HCV, Abbott Laborat ories, Wiesbaden, Germany),
positive HCV-RNA in serum, and incr eased liver
enzymes. HCV genotyping was performed with INNO-
LIPA HCV II kits (Siemens Healthcare Diagnostics,
Marburg, Germany) according to the manufacturer’ s
instructions. Amplicor-HCV-Monitor (Perkin-Elmer,
Norwalk, Connecticut, USA) was used to qua ntify HCV-
RNA levels in serum. The detection limit was < 615
copies/ml.
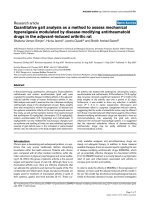
BIA measurement procedures
BIA was performed by a registered study nurse (M. N.).
Impedance measurements were t aken after 10 minutes
of rest with a BIA impedance analyzer (BIA 101, Akern
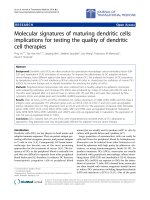
Bioresearch, Florence, Italy). Briefly, two pairs of electro-
des were attached on the righ t hand and right foot with
the patient in supine position, with legs slightly apart,
and the arms not touching the torso [4] (Figure 1). Cal-
culation of TBW, BF, and BCM was performed as pre-
viously described elsewhere [24-26].
Statistical analysis
Statistical analysis was performed using the SPSS 11.5
system (SPSS Incorporation,Chicago,Illinois,USA).
Continuous variables are presented as means ± standard
deviation (SD) whereas categorical variables are pre-
sented as count and proportion. Comparison between
groups were made u sing the Mann-Whitney U test or
the Student’s test for continuous variables, and the c
2
or
Fisher’s exact probability test for categorical data. A p-
value < 0.05 was considered to be statistically significant.
Multiple comparisons between more than two groups of
patients were performed by ANO VA and sub sequent
least-significant difference procedure test. Spearman’s
correlation coefficient was calculated for testing the rela-
tionship between different quantities in a bivariate
regression model.
Results
Patients’ demographic data
Table 1 shows the baseline characteristics of 37
patients with chronic HCV infection and 10 therapy-
naïve subjects with HCV infection (5 with genotype 1
and 5 with genotype 3). Genotype 1 was present in 15
patients (8 males, 7 females, mean age 48.1 ± 12.6 y)
whereas 22 patients had genotype 3 (10 males, 12
females, 37.5 ± 9.5 y). Patients with genotype 3 were
treated for 24 weeks whereas subjects with genotype 1
received antiviral therapy for 48 weeks. Virological
response was o bserved in 73.3% of patients with geno-
type 1 and in 86.3% with genotype 3. In addition, we
also performed ultrasound examinations to exclude
Kahraman et al. Virology Journal 2010, 7:191
/>Page 2 of 8
ascites and used the FibroScan to measure extent of
liver fibrosis. However, we found no positive correla-
tion between BIA measurements and liver stiffness
(data not shown).
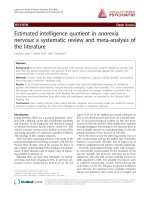
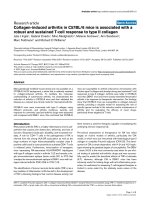
Body weight is significantly reduced in patients with
genotype 1 receiving antiviral treatment for 48 weeks
As demonstrated in Figure 2A, body weight significantly
decreased in patients with genotype 1 following antiviral
treatment for 48 weeks (78 ± 13.1 kg before therapy
versus 71 ± 15.3 kg after therapy; p < 0.001). Body
weight was also reduced in subjects wi th genotype 3
receiving antiviral medication for 24 weeks, though not
statistically significant (75.5 ± 20.7 kg before therapy
versus 68.5 ± 21 kg after therapy; n.s.). In contrast,
almost no alterations in body weight were observed in
the c ontrol group - irrespective of the genotype (geno-
type 1: 88.8 ± 3.1 kg a t baseline, 87.4 ± 12.3 kg after 48
weeks; genotype 3: 86.6 ± 2.1 kg at baseline, 85.2 ± 2.2
kg after 24 weeks; n.s.).
Figure 1 Schematic representation of BIA measurements using signal and detection electrodes.
Table 1 Baseline biochemical and physical characteristics of the study populations
HCV genotype 1
(n = 15)
Control
genotype 1
(n = 5)
HCV
genotype 3
(n = 22)
Control
genotype 3
(n = 5)
Gender (male/female) 8/7 2/3 10/12 2/3
Age (years) 48.1 ± 12.6 49.3 ± 10.3 37.5 ± 9.5 49.3 ± 10.3
ALT U/l) 80.2 ± 69.3 61.4 ± 40.9 40.5 ± 34.2 61.4 ± 40.9
AST (U/l) 76.7 ± 67.6 37.4 ± 17.6 58.4 ± 32.1 37.4 ± 17.6
g-GT (U/l) 133.7 ± 23.3 60 ± 29.8 97.8 ± 10.6 60 ± 29.8
Total bilirubin (mg/dl) 1.4 ± 0.2 0.7 ± 0.2 0.9 ± 0.5 0.7 ± 0.2
Prothrombin time (%) 103 ± 11.2 108.6 ± 12.1 114 ± 9 108.6 ± 12.1
Triglycerides (mg/dl) 153.2 ± 94.3 137.6 ± 62.9 194.5 ± 86.2 137.6 ± 62.9
Cholesterol (mg/dl) 201.8 ± 52.5 201 ± 43.6 208.6 ± 37.2 201 ± 43.6
Virological response 11/4 (73.3%) / 19/3 (86.3%) /
Ascites None none none none
FibroScan (kPa)
Pre-therapy
8.8 ± 5.4 9.8 ± 3.9 7.5 ± 1.9 8.2 ± 2.4
FibroScan (kPa)
Post-therapy
7.4 ± 1.8 9.5 ± 3.3 6.2 ± 1.2 8.7 ± 2.9
Values are presented as means ± SD. Genotype 1 was present in 15 patients with hepatitis C whereas 22 patients had genotype 3. Additionally, a group of 10
subjects with untreated HCV was used as a control. No relationship was found between BIA measurements and laboratory data.
Kahraman et al. Virology Journal 2010, 7:191
/>Page 3 of 8
Body fat is significantly decreased in patients with
hepatitis C following antiviral therapy
BF was decreased in patients with genotype 1 (24.2 ± 6.7
kg pre-therapy, 19.9 ± 6.6 kg post-therapy; p < 0.001;
Figure 2B). Likewise, BF was decreased in patients with
genotype 3 (15.4 ± 10.9 kg pre-therapy, 13.2 ± 12.1 kg
post-therapy; p < 0.005). Interestingly, reduction i n BF
was more profound in genotype 1 following 48 weeks of
therapy. However, no significant alterations in BF were
observed within the therapy- naïve HCV groups - neit her
after 24 nor after 48 weeks (genotype 1: 26.2 ± 3.0 kg at
baseline, 25.8 ± 2.5 kg after 48 weeks; genotype 3: 26.8 ±
2.8 kg at baseline, 25.6 ± 2.6 kg after 24 weeks; n.s.).
Body cell mass is reduced in HCV patients after antiviral
therapy
In HCV genotype 1 patients, BCM decreased from 27.3 ±
6.8 kg before antiviral treatment to 24.3 ± 7.2 kg
(p = 0.02; Figure 2C). We also observed a significant
reduction in BCM in patients with HCV genotype 3 (27.7
± 8.8 kg before versus 24. 6 ± 7.6 kg after treatment; p =
0.01). Again, no changes in BCM were observed in
untreated HCV patients (for genotype 1: 28.0 ± 2.9 kg at
baseline versus 26.6 ± 3.3 kg after 48 weeks and for geno-
type 3: 27.2 ± 3.5 kg at baseline versus 26.0 ± 3.3 kg after
24 weeks; p > 0.5).
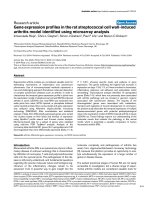
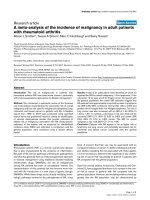
Determination of extracellular mass revealed no
significant alterations in patients infected with hepatitis C
following antiviral regimens
As depicted in Figure 3A, ECM did not change in either
HCV genotype 1 (28.1 ± 4.4 l before and 27.7 ± 5.2 l
afte r therapy; p > 0.05) nor in HCV genotype 3 patie nts
(27.4 ± 5.2 l before and 28.1 ± 6.0 l after therapy; p >
0.05). Similarly, no significant changes in ECM were
detected within the untreated HCV cohort (for genotype
Figure 2 (A) Body weight is significantly reduced in HCV patients with genotype 1 following 48 weeks of antiviral treatment.No
significant decline was present in the control group during the observation period. For all figures, the initial measurements are depicted as light
grey and the follow-up measurements are depicted as dark grey blots. (B) Body fat is significantly decreased in HCV patients following antiviral
regimens - irrespective of genotype or duration of therapy. No alterations were observed within the control group. (C) A significant reduction in
body cell mass was also observed in both HCV groups post-therapy. Again, no significant alterations were present in the therapy-naïve group.
Kahraman et al. Virology Journal 2010, 7:191
/>Page 4 of 8
1: 29.0 ± 2.2 l at baseline versus 27.2 ± 3.0 l after 48
weeks and for genotype 3: 27.8 ± 2.5 l at baseline versus
27.4 ± 2.4 l after 24 weeks; p > 0.05).
Total body water is significantly reduced in HCV patients
with genotype 1 following antiviral treatment for 48
weeks
TBW was reduced in patients with genotype 1 following
antiviral treatment for 48 weeks (41.4 ± 7.9 l pre-ther-
apy vs. 40.8 ± 9.5 l post-therapy; p < 0.01; Figure 3B)
whereas no significant alterations could be observed for
HCV genotype 3 patients (40.3 ± 10 l pre-therapy vs.
40.4 ± 9.3 l post-therapy; n.s.). In addition, no significant
changes for TBW were present in patients with
untreated HCV infection (genotype 1: 41.2 ± 1.3 l at
baseline,40.8±0.8lafter48weeks;genotype3:39.0±
1.5 l at baseline, 38.2 ± 1.7 l after 24 weeks; n.s.).
BIA-derived phase angle is significantly decreased in HCV
patients with genotype 3 following antiviral regimens
AsshowninFigure3C,PAdidnotdifferbeforeand
after antiviral therapy in HCV patients with genotype 1
(5.3 ± 0.7° before therapy versus 5.4 ± 0.7° after therapy;
p > 0.05) whereas in genotype 3 patients PA was signifi-
cantly de creased (5.9 ± 0.7° before therapy versus 5.4 ±
0.8° after therapy; p < 0.001). Again, no changes were
observed in patients with untreated hepatitis C (geno-
type 1: 6.5 ± 0.2° at baseline, 6.2 ± 0.3° after 48 weeks;
genotype 3: 6.6 ± 0.3° at baseline, 6.6 ± 0.4° after 24
weeks; n.s.).
Figure 3 (A) No significant changes in extracellular mass were detected in HCV patients related to genotype or duration of antiviral
treatment. (B) Total body water is significantly reduced in HCV-infected patients with genotype 1. As demonstrated, TBW decreased with the
duration of antiviral therapy for 48 weeks. (C) Phase angle was significantly decreased in patients with genotype 3. Interestingly, no alterations in
PA were present in patients with genotype 1 treated for 48 weeks.
Kahraman et al. Virology Journal 2010, 7:191
/>Page 5 of 8
Adverse effects of antiviral treatment are more prominent
in HCV-infected patients with alterations in body
composition
In a further sub-analysis we found a reduction in BF and
BCM to a similar degree in both HCV genotypes follow-
ing antiviral therapy - without any correlation to the
recorded adverse effects of antiviral treatment (Table 2).
Interestingly, a decrease in TBW was more often
accompanied with episodes of fatigue and cephalgia in
patients with genotype 1. Moreover, we observed that a
decline in PA was more often as sociated with flu-like
symptoms - as revealed for patients with genotype 3.
We speculate that this may be related to a delayed dehy-
dration in this cohort of patients.
Discussion
BIA has been used fo r the assessment of malnutrition in
patients with liver cirrhosis. In this setting, use of BIA
has been demonstrated to offer a considerable advantage
over other widely available but less accurate methods
like anthropometry or the creati nine approach [27].
Despite some limitations in patient s with ascites, BIA is
a reliabl e bedside tool for the det ermination of BCM in
cirrhotic patients. Pirlich and colleagues, however,
demonstrated that removal of ascites had only minor
effects on BCM as assessed by BIA [28].
In a recently published study by Antaki et al., BIA was
used for the evaluation of hepatic fibrosis in patients
with chronic HCV infection [23]. The aim was to assess
whether BIA can differentiate between minimal and
advanced liver fibrosis in a cohort of 20 HCV-infected
patients. The authors found no significant differences
with respect to PA, R, or Xc for the whole body and the
right upper quadrant measurements in any axes - irre-
spective if minimal or advanced fibrosis was present.
Furthermore, Romero-Gomez and co-investigators
found that in HCV patients infe cted by genotype 3a,
hepatic steatosis correlated significantly with intrahepa-
tic HCV-RNA load. However, in genotype 1, hepatic
steatosis was associated with host factors such as leptin
levels, BMI, percentage of BF, and visceral obesity [29].
Following antiviral treatment, we found a significant
reduction in body fat in patients with genotype 3. Inter-
esti ngly, majo r alter ations in BMI were not present. We
suggest a loss in fatty tissue, which might be compen-
sated e.g. by increased water storage. Although we hav e
no evidence fo r this me chanism, as we did not further
investigate this issue. For clinical purpose, body fat com-
prises an intrinsic risk fa ctor for diabetes, hyperlipide-
mia, NAFLD, and cardio-vascular diseases whereas a
higher body cellular mass is not associated to known
health risks. In addition, analyzing TBW by BMI
method may f urther impro ve to predict a patient’ s
hydration level while ECM contains the metabolically
inactive parts of the body components including bone
minerals and blood plasma. In a further cross-sectional
analysis by Delgado-Borrego and colleagues comparing
39 HCV-positive with 60 HCV-negative ortho topi c liver
transplant (OLT) recipients, the authors found by BIA-
derived measurements that HCV infection and BMI
were independent predicto rs of insulin resistance (IR),
respectively. HCV infection was associated with a 35%
increase in IR [30].
The present study was conducted to investigate
whether BIA can be used to monitor changes or altera-
tions in body composition parameters in patients with
chronic HCV infection following antiviral therapy for 24
or 48 weeks. Although compromised by the small sam-
ple size, our results suggest that bioelectrical impeda nce
analysis does have the sensitivity required to distinguish
significant differences in patients with chronic HCV
infection with respect to body weight, BF, BCM, and
TBW, in part related to the genotype. We also includ ed
a c ontrol group with untreated HCV infection whereas
several studies of BIA in healthy subjects have shown
mean PA values ra nging from 6.3 to 8.2° [21,31]. Our
findings for PA in untreated HCV patients did fall in
that ra nge. It should be note d that BIA can be affected
by both BMI and age. A higher BMI is known to corre-
late with a higher PA, possibly secondary to the effect of
adipose tissue on resistance[32].Otherstudieshave
suggested a gradual decrease in PA with age [31,33].
Our results did not show a correlation between gender
and age or biochemical and virologic response rates to
PA (data not shown) in either group, probably due to
the small sample size. However, to best of our knowl-
edge this is the first study demonstrating alterations in
body composition measured by BIA in patients with
chronic HCV infection following antiviral treatment.
The identification of prognostic factors in pati ents
infected with HCV is of considerable importance for the
clinical management of this disease. The current study
was perfor med to investigate whether BIA-derived phase
angle or alterations in body composition can predict or
monitor the outcome to antiviral therapy in HCV-
infected patien ts. Our study demonstrates that a
Table 2 Percentage of adverse effects related to the
genotypes and alterations in body composition following
antiviral treatment
Adverse effects HCV genotype 1
(n = 15)
HCV genotype 3
(n = 22)
Cephalgia 8/15 (53.3%) * 8/22 (36.3%)
Fatigue 13/15 (86.6%) * 12/22 (54.5%)
Flu-like symptoms 10/15 (66.6%) 18/22 (81.8%) *
Symptoms of fatigue and cephalgia were more evident in patients with
genotype 1 whereas flu-like symptoms were more present in patients with
genotype 3 following antiviral treatment (* p < 0.05).
Kahraman et al. Virology Journal 2010, 7:191
/>Page 6 of 8
reduction in PA was clinically more often accompanied
with episodes of flu-like syndromes in patients with gen-
otype 3 whereas symptoms like fatigue and cephalgia
were more evident after a decline in total body water in
patients with ge notype 1 (Table 2). This information
would be helpful in patient management and may impli-
cate that for example in patients with genotype 1 follow-
ing antiv iral treatment fluid support should be planned
or modified w hereas in genotype 3 flu-like symptoms
should be treated earlier with e.g. acetaminophen. As a
step to further understand the clinical applications of
BIA-derived assessments, we propose that similar stu-
dies with larger sample sizes are needed to further vali-
date the p rognostic significance of PA a nd TBW
determinations in patients infected with HCV. Investiga-
tions into other non-invasive modalities for the assess-
ment of alterations in body composition in patients with
hepatitis C infection should be pursued.
Abbreviations
ALT: alanine aminotransferase; AST: aspartate aminotransferase; BCM: body
cell mass; BF: body fat; BIA: bioelectrical impedance analysis; BMI: body mass
index; ECM: extra cellular mass; HCV: hepatitis C virus; IFN-a: interferon-a; PA:
phase angle; TBW: total body water
Acknowledgements
Funding: This work was supported by the Deutsche
Forschungsgemeinschaft (DFG; Grant CA 267/4-1, 267/6-1) and the Wilhelm
Laupitz Foundation.
Author details
1
University Clinic Duisburg-Essen, Department of Gastroenterolgy and
Hepatology, Hufelandstrasse 55, 45122 Essen, Germany.
2
Krankenhaus
Dueren gem. GmbH, Internal Medicine II, Roonstr. 30, 52351 Dueren,
Germany.
3
Städtisches Klinikum, Department of Internal Medicine, Auenweg
38, 06847 Dessau, Germany.
Authors’ contributions
All authors read and approved the final manuscript.
AK designed the study, acquired clinical patient data, analyzed and
interpreted the data, and drafted the manuscript. JH analyzed and
interpreted the data, revised the manuscript for important intellectual
content, and gave technical support on BIA measurements. MN performed
BIA measurements. JE and AW acquired clinical data and assisted in
statistical analysis. MP revised the manuscript for important intellectual
content. GG obtained funding, gave administrative and material support,
and supervised the study. AC designed the study, interpreted the data,
revised the manuscript for important intellectual content, obtained funding,
and supervised the study.
Competing interests
The authors declare no conflict of interest.
Received: 16 July 2010 Accepted: 16 August 2010
Published: 16 August 2010
References
1. Hemmingsson E, Udden J, Neovius M: No apparent progress in
bioelectrical impedance accuracy: validation against metabolic risk and
DXA. Obesity (Silver Spring) 2009, 17:183-7.
2. Simons JP, Schols AM, Westerterp KR, ten Velde GP, Wouters EF: The use of
bioelectrical impedance analysis to predict total body water in patients
with cancer cachexia. Am J Clin Nutr 1995, 61:741-5.
3. Zarowitz BJ, Pilla AM: Bioelectrical impedance in clinical practice. DICP
1989, 23:548-55.
4. Baumgartner RN, Chumlea WC, Roche AF: Bioelectric impedance phase
angle and body composition. Am J Clin Nutr 1988, 48:16-23.
5. Talluri T, Lietdke RJ, Evangelisti A, Talluri J, Maggia G: Fat-free mass
qualitative assessment with bioelectric impedance analysis (BIA). Ann N
Y Acad Sci 1999, 873:94-8.
6. Schwenk A, Beisenherz A, Romer K, Kremer G, Salzberger B, Elia M: Phase
angle from bioelectrical impedance analysis remains an independent
predictive marker in HIV-infected patients in the era of highly active
antiretroviral treatment. Am J Clin Nutr 2000, 72:496-501.
7. Lukaski HC, Johnson PE, Bolonchuk WW, Lykken GI: Assessment of fat-free
mass using bioelectrical impedance measurements of the human body.
Am J Clin Nutr 1985, 41:810-7.
8. Fredrix EW, Saris WH, Soeters PB, Wouters EF, Kester AD, von
Meyenfeldt MF, Westerterp KR: Estimation of body composition by
bioelectrical impedance in cancer patients. Eur J Clin Nutr 1990, 44:749-52.
9. Adami GF, Marinari G, Gandolfo P, Cocchi F, Friedman D, Scopinaro N: The
use of bioelectrical impedance analysis for monitoring body
composition changes during nutritional support. Surg Today 1993,
23:867-70.
10. Pichard C, Kyle UG, Slosman DO: Fat-free mass in chronic illness:
comparison of bioelectrical impedance and dual-energy x-ray
absorptiometry in 480 chronically ill and healthy subjects. Nutrition 1999,
15:668-76.
11. Pencharz PB, Azcue M: Use of bioelectrical impedance analysis
measurements in the clinical management of malnutrition. Am J Clin
Nutr 1996, 64:485S-488S.
12. Chertow GM, Lazarus JM, Lew NL, Ma L, Lowrie EG: Bioimpedance norms
for the hemodialysis population. Kidney Int 1997, 52:1617-21.
13. Pupim LB, Kent P, Ikizler TA: Bioelectrical impedance analysis in dialysis
patients. Miner Electrolyte Metab 1999, 25:400-6.
14. Nagano M, Suita S, Yamanouchi T: The validity of bioelectrical impedance
phase angle for nutritional assessment in children. J Pediatr Surg 2000,
35:1035-9.
15. Fein PA, Gundumalla G, Jorden A, Matza B, Chattopadhyay J, Avram MM:
Usefulness of bioelectrical impedance analysis in monitoring nutrition
status and survival of peritoneal dialysis patients. Adv Perit Dial 2002,
18:195-9.
16. Desport JC, Preux PM, Bouteloup-Demange C, Clavelou P, Beaufrere B,
Bonnet C, Couratier PP: Validation of bioelectrical impedance analysis in
patients with amyotrophic lateral sclerosis. Am J Clin Nutr 2003,
77:1179-85.
17. Sarhill N, Mahmoud FA, Christie R, Tahir A: Assessment of nutritional
status and fluid deficits in advanced cancer. Am J Hosp Palliat Care 2003,
20:465-73.
18. Ott M, Fischer H, Polat H, Helm EB, Frenz M, Caspary WF, Lembcke B:
Bioelectrical impedance analysis as a predictor of survival in patients
with human immunodeficiency virus infection. J Acquir Immune Defic
Syndr Hum Retrovirol 1995, 9:20-5.
19. Maggiore Q, Nigrelli S, Ciccarelli C, Grimaldi C, Rossi GA, Michelassi C:
Nutritional and prognostic correlates of bioimpedance indexes in
hemodialysis patients. Kidney Int 1996, 50:2103-8.
20. Faisy C, Rabbat A, Kouchakji B, Laaban JP: Bioelectrical impedance analysis
in estimating nutritional status and outcome of patients with chronic
obstructive pulmonary disease and acute respiratory failure. Intensive
Care Med 2000, 26:518-25.
21. Selberg O, Selberg D: Norms and correlates of bioimpedance phase
angle in healthy human subjects, hospitalized patients, and patients
with liver cirrhosis. Eur J Appl Physiol 2002, 86:509-16.
22. Manns MP, Wedemeyer H, Cornberg M: Treating viral hepatitis C: efficacy,
side effects, and complications. Gut 2006, 55:1350-9.
23. Antaki F, French MM, Moonka DK, Gordon SC: Bioelectrical impedance
analysis for the evaluation of hepatic fibrosis in patients with chronic
hepatitis C infection. Dig Dis Sci 2008, 53:1957-60.
24. Kyle UG, Bosaeus I, De Lorenzo AD, Deurenberg P, Elia M, Gomez JM,
Heitmann BL, Kent-Smith L, Melchior JC, Pirlich M, Scharfetter H, Schols AM,
Pichard C: Bioelectrical impedance analysis–part I: review of principles
and methods. Clin Nutr 2004, 23:1226-43.
25. Kyle UG, Bosaeus I, De Lorenzo AD, Deurenberg P, Elia M, Manuel Gomez J,
Lilienthal Heitmann B, Kent-Smith L, Melchior JC, Pirlich M, Scharfetter H,
Kahraman et al. Virology Journal 2010, 7:191
/>Page 7 of 8
A MWJS, Pichard C: Bioelectrical impedance analysis-part II: utilization in
clinical practice. Clin Nutr 2004, 23:1430-53.
26. Kyle UG, Pirlich M, Schuetz T, Lochs H, Pichard C: Is nutritional depletion
by Nutritional Risk Index associated with increased length of hospital
stay? A population-based study. JPEN J Parenter Enteral Nutr 2004,
28:99-104.
27. Pirlich M, Selberg O, Boker K, Schwarze M, Muller MJ: The creatinine
approach to estimate skeletal muscle mass in patients with cirrhosis.
Hepatology 1996, 24:1422-7.
28. Pirlich M, Schutz T, Spachos T, Ertl S, Weiss ML, Lochs H, Plauth M:
Bioelectrical impedance analysis is a useful bedside technique to assess
malnutrition in cirrhotic patients with and without ascites. Hepatology
2000, 32:1208-15.
29. Romero-Gomez M, Castellano-Megias VM, Grande L, Irles JA, Cruz M,
Nogales MC, Alcon JC, Robles A: Serum leptin levels correlate with
hepatic steatosis in chronic hepatitis C. Am J Gastroenterol 2003,
98:1135-41.
30. Delgado-Borrego A, Casson D, Schoenfeld D, Somsouk M, Terella A,
Jordan SH, Bhan A, Baid S, Cosimi AB, Pascual M, Chung RT: Hepatitis C
virus is independently associated with increased insulin resistance after
liver transplantation. Transplantation 2004, 77:703-10.
31. Barbosa-Silva MC, Barros AJ, Wang J, Heymsfield SB, Pierson RN:
Bioelectrical impedance analysis: population reference values for phase
angle by age and sex. Am J Clin Nutr 2005, 82:49-52.
32. Guida B, Laccetti R, Gerardi C, Trio R, Perrino NR, Strazzullo P, Siani A,
Farinaro E, Colantuoni A: Bioelectrical impedance analysis and age-related
differences of body composition in the elderly. Nutr Metab Cardiovasc Dis
2007, 17:175-80.
33. Bosy-Westphal A, Danielzik S, Dorhofer RP, Piccoli A, Muller MJ: Patterns of
bioelectrical impedance vector distribution by body mass index and
age: implications for body-composition analysis. Am J Clin Nutr 2005,
82:60-8.
doi:10.1186/1743-422X-7-191
Cite this article as: Kahraman et al.: Bioelectrical impedance analysis in
clinical practice: implications for hepatitis C therapy BIA and hepatitis C.
Virology Journal 2010 7:191.
Submit your next manuscript to BioMed Central
and take full advantage of:
• Convenient online submission
• Thorough peer review
• No space constraints or color figure charges
• Immediate publication on acceptance
• Inclusion in PubMed, CAS, Scopus and Google Scholar
• Research which is freely available for redistribution
Submit your manuscript at
www.biomedcentral.com/submit
Kahraman et al. Virology Journal 2010, 7:191
/>Page 8 of 8