Báo cáo y học: "No influence of oxygen levels on pathogenesis and virus shedding in Salmonid alphavirus (SAV)challenged Atlantic salmon (Salmo salar L.)" pot
Bạn đang xem bản rút gọn của tài liệu. Xem và tải ngay bản đầy đủ của tài liệu tại đây (2.48 MB, 14 trang )
RESEARC H Open Access
No influence of oxygen levels on pathogenesis
and virus shedding in Salmonid alphavirus (SAV)-
challenged Atlantic salmon (Salmo salar L.)
Linda Andersen
1*
, Kjartan Hodneland
2
, Are Nylund
1
Abstract
Background: For more than three decades, diseases caused by salmonid alphaviruses (SA V) have become a major
problem of increasing economic importance in the European fish-farming industry. However, experimental
infection trials with SAV result in low or no mortality i.e very different from most field outbreaks of pancreas
disease (PD). This probably reflects the difficulties in reproducing complex biotic and abiotic field conditions in the
laboratory. In this study we looked at the relationship between SAV-inf ection in salmon and sub-lethal
environmental hypoxia as a result of reduced flow-through in tank systems.
Results: The experiment demonstrated that constant reduced oxygen levels (60-65% oxygen saturation: 6.5-7.0
mg/L) did not significantly increase the severity or the progress of pancreas disease (PD). These conclusions are
based upon assessments of a semi-quantitative histopathological lesion score system, morbidities/mortalities, and
levels of SAV RNA in tissues and water (measured by 1 MDS electropositive virus filters and downstream real-time
RT-PCR). Furthermore, we demonstrate that the fish population shed detectable levels of the virus into the
surrounding water during viraemia; 4-13 days after i. p. infection, and prior to appearance of severe lesions in heart
(21-35 dpi). After this period, viral RNA from SAV could not be detected in water samples although still present in
tissues (gills and hearts) at lasting low levels. Lesions could be seen in exocrine pancreas at 7-21 days post
infection, but no muscl e lesions were seen.
Conclusions: In our study, experimentally induced hypoxia failed to explain the discrepancy between the severities
reported from field outbreaks of SAV-disease and experimental infections. Reduction of oxygen levels to constant
suboptimal levels had no effect on the severity of lesions caused by SAV-infection or the progress of the disease.
Furthermore, we present a modified VIRADEL method which can be used to detect virus in water and to
supplement experimental infection trials with information related to viral shedding. By using this method, we were
able to demonstrate for the first time that shedding of SAV from the fish population into the surrounding water
coincides with viraemia.
Background
Diseases caused by salmonid alphaviruses; SAV (Alpha-
virus, Togaviridae) have become an increasing problem
of economic al importance to the European fish-farming
industry. Salmonid alphavirus (SAV) is the only alpha-
virus that has been isolated from fish, and are thought
to comprise at least six subtypes (SAV1-6) [1]. Whereas
all subtypes h ave been associated with pancreas disease
(PD) affecting Atlantic salmon (Salmo salar L.) in sea
water [1], SAV2 is the only subtype that is known to
cause disease outbreaks in fresh water, i.e in rainbow
trout Oncorhynchus mykiss (Walbaum) [1-6]. In Norway,
SAV3 is the only identified subty pe [6-8], and the virus
has been shown to affect sea water reared rainbow trout
and salmon [9,10].
During PD-outbreaks, affected fish will often exhibit
abnormal swimming behaviour and may congregate in
net pen corners close to the surface [7]. Affected fish
may seem lethargic with a marked loss in appetite. Few
if any distinctive gross pathological changes can be seen
* Correspondence:
1
Department of Biology, University of Bergen, Pb 7800, N-5020 Bergen,
Norway
Full list of author information is available at the end of the article
Andersen et al. Virology Journal 2010, 7:198
/>© 2010 Andersen et al; license e BioMed Central Ltd. This is an Open Access article distributed under the terms of the Creative
Commons Attribution License (http://creative commons.org/licenses/by/2.0), which permits unrestricted use, distribution, and
reproduction in any medium, provided the original work is properly c ited.
during experimental SAV-infections. Histopathological
findings associated with infections by all subtypes of
SAV are very similar [11,12], and may include severe
degeneration of exocrine pancreas tog ether with myopa-
thy of heart- and skeletal muscle, with variable inflam-
mation. These significant lesions occur in a sequential
manner, with pancreas being the first tissue showing
pathology, followed by lesions in heart and skeletal mus-
cle [13,14].
Mortality rates associated with SAV-infections in sea
water reared salmon and rainbow trout are highly vari-
able [10,15,16] and range from subclinical infections
with no outbreaks [17] to acute outbreaks with high
mortality [1,10,18]. The severity of PD in sea water can
be affected by a range of factors linked to the environ-
ment, pathogen and/or the host such as stressors related
to handling, management strategies, other infectious
agents [19-21] temperature [18] and differences in
genetic factors related to the host or the virus (virulence
traits) [15,22-24]. In experimental trials with SAV, how-
ever, high mortalities are rarely seen [4,18,22,25-28]
probably due to problems with reproducing complex
field conditions in the laboratory.
Our understanding on how variations in water tem-
perature, oxygen and salinity levels might influence fish
welfare and susceptibility for infectious diseases is lim-
ited [29,30]. In general, hypoxia has a negative impact
on important mechanisms such as growth, appetite, dis-
ease resistance and welfare of salmon [31]. Shortage of
oxygen (hypoxia) can act as a stressor to fish [32] and
elicit primary s tress responses such as release of cate-
cholamines and corticosteroids (see [33,34]) possibly
affecting immune responses which renders the fish more
susceptible to infections [32-34]. Fish reared in marine
net pens/large cage systems experience periods with
environmental hypoxia, especially during rapid growth
in combination with high stocking densities and high
temperatures [35]. Also, oxyg en levels within a fish farm
may fluctuate with depth and time and within and
between sea- cages and due to shifting chang es in envir-
onmental factors such as water currents, wind, tempera-
ture, salinity, oxygen mixing and oxygen production by
photosynthetic algae (see [35]). Experimental trials
where Atlantic salmon were repeatedly exposed to
graded hypoxia have shown that fluctuations between
normoxia and 60-65% oxygen saturation is suboptimal
for salmon, whereas fluctuations between normoxia and
50% saturation or less have been shown to affect appe-
tite in a negative manner and lead to an increased num-
ber of skin lesions and elevation of stress responses
(Mette Remen, IMR , Bergen, Norway, personal commu-
nication). In our study, we wanted to see if by reducing
oxygen levels to constant environmentally sub-lethal
levels (60-65%) this would affect the development and/
or the severity of SAV-infection/PD. This was assessed
by measuring l evels of SAV in tissues and in water
(shedding of virus) by real-time RT-PCR, and by com-
paring histopathological lesions (heart, pancreas and
somatic muscle) and mortalities between the respective
groups.
Materials and methods
Fish and experimental design
Fish were supplied by a local fish supplier (Hordaland
County) and reared at the fish facility at Industrilabora-
toriet (ILAB) located at Bergen High Technology Cen-
tre, Norway. Prior to the experiment, gills from 30 fish
were screened by real-time RT-PCR for the presence of
various disease causing agents (SAV, infectious pancrea-
tic necrosis virus (IPNV), infectious salmon anaemia
virus (ISAV), Chlamydia sp., Neoparamoeba sp., Para-
nucleospora theridion,andParvicapsula sp.) with nega-
tive results. The fish had a mean weight of 73.2 grams
and a mean length of 18.1 cm (n = 30) at th e beginning
of the experiment and had been vaccinated with a mul-
tivalent vaccine (no SAV component). Initially, the fish
were reared in fresh water in a flow-through system.
The fish group were then exposed to an increasing sali-
nity level (particle filtered (50 μm) and UV-sterilized (>
60 mW/cm
2
) sea water), experiencing full salinity 33‰
(mean 31.97‰, range 30.3-32.8‰)and12°C(mean
11.95 °C, range 11.6-12.9°C) five weeks prior to the
experiment. Salinity, oxygen levels and temperature
were monitored at least daily throughout the experi-
ment, and the fish were hand fed daily with a commer-
cial feed. The flow-through in tanks was from 100-400
Lh
-1
tank
-1
dependent on desired oxygen levels for the
various experimental groups (60-65% - or 85-90%
saturation) and according to biomass and temperature.
Two hundred and sixty fish were divided into 4 tanks
(0.15 m
3
), n = 65 fish per tank. When the expe riment
started the fish groups had been acclimatized to labora-
tory conditions for 55 days. The experiment was
approved by the Norwegian Animal Research Authori-
ties (NARA) in 2008 (reference number 899).
Inocula
Supernatants from Chinook salmon embryo (CHSE-214)
cell culture (uninfected or salmonid alphavirus (SAV)-
infected) were diluted 1:10 in Eagle’s Minimum Essential
Medium (EMEM) and sterile filtered. T wo control
groups (2 t anks, n = 65 per tank) were intraper itoneally
(i.p.) injected with 0.2 ml of supernatants from unin-
fected cells whereas two other groups (2 tanks, n = 65
per tank) were i.p. injected with 0.2 ml of supernatants
from SAV-infected cells, prepared as described. The
SAV-isolatewasaSAVsubtype3isolate;SAVH30/04
(kindly provided by M. Karlsen, University of Bergen).
Andersen et al. Virology Journal 2010, 7:198
/>Page 2 of 14
All fish were anaesthe tized with Metacaine MS-222
prior to injection. The SAV3 isolate SAVH30/04, origi-
nating from salmon in Hordaland county in 2004, had
been passed six times in CHSE-214 cell culture until
cytopathogenic effect (CPE) could be observed (10 dpi),
and had a viral endpoint titer TCID
50
of 5.6 × 10
4
virus
per ml in the inoculum.
Virus end point-titration by indirect fluorescence
antibody test (IFAT)
Virus end point-titration was based upo n the method
described by Kärbe r [36] an d was u sed to e stimate the
50% tissue culture infectious dose (TCID
50
)ofthe
inoculum. Briefly, a ten fold dilution series of the inocu-
lum in medium with 2% Fetal Bovine Serum (FBS) was
prepared and inoculated onto rainbow trout (RT)-gill
cells grown in a 96-well plate and incubated for 8 days
at 14°C. The IFAT procedure was performed as
described by [37] but with primary recombinant polyclo-
nal antibodies E2-pTe200 raised against SAV3 (1:400). A
panel of four polyclo nal recombinant antibodies were
generated in 2005 (Karl F. Ottem & Katrine Bones
Enger, University of Bergen, unpublished ) by immuniz-
ing rabbits with SAV3-derived recombinant antigens (E1
and E2-region) expressed in Escherichia coli,andoneof
these was used in this study (E2-pTe200)(courtesy of
KF. Ottem, University of Bergen). The cells were incu-
bated with a secondary antibody, Alexa Fluor 488 goat
anti-rabbit I gG (1:1000 dilution, Molecular probes) and
examined in a Leica DMIRBE inverted fluorescence
microscope. Cells that had been inoculated with cell
media only acted as negative controls.
Oxygen levels
Two days after SAV-infection, the oxygen levels in two
of the tanks (paral lel tanks; one uninfected control
group and one SAV-infected) were gradually lowered
(duringthefirst24hperiod)fromnormaloxygencon-
ditions (85-90% oxygen saturation, 9.2-9. 7 mg O
2
per
liter, approx. 300-400 Lh
-1
tank
-1
)toconstantsubopti-
mal/sub-lethal conditions (60-65% oxygen saturation,
6.5-7.0 mg O
2
per liter, approx. 100-200 Lh
-1
tank
-1
)by
slowly reducing flow-through in the tanks. T he oxygen
levels were monitored closely in the beginning, and then
at least daily throughout the experimental period of 70
days. The flow-through was adjusted according to bio-
mass during the experiment in order to keep the oxygen
levels at a constant reduced level of 60-65% saturation.
The experimental groups are hereafter throughout the
manuscript referred to as CNorm and CRed for the
uninfected controls reared at normal and reduced oxy-
gen levels, whereas the SAV-infected groups held under
normal and reduced oxygen will be referred to as
SNorm and SRed, respectively.
Sampling of tissues
At various times post SAV-inf ection (7, 14, 21, 35, 49
and 7 0 days post infection), tissues were sampled from
five fish from each experimenta l group (CNorm, CRed,
SNorm and SRed). Fish were killed by a blow to the
head, and blood was taken from the caudal veins into
heparinised tubes . Weight/fork length togeth er with
gross pathology were noted for all individuals. Fulton’s
condition factor (K) was calculated by K = W (weight in
grams)/L (length in cm)
-3
* 100. The samples were kept
on ice or fast frozen in liquid nitrogen for real-time RT-
PCR (gills and hearts), and fixed by immersion in a
modified Karnovsky’s fixative for histology (heart,
somatic muscle at the level of the lateral line and the
dorsal fin, together with pyloric caeca region and spleen
with pancreatic tissue). Blood was centrifuged at 1000 ×
g for 5 min and plasma was removed and frozen at -80°
C for subsequent SAV RNA real-time RT-PCR measure-
ments. Gills from dead and moribund fish were also
analyzed with real-time RT-PCR. In addition, pancreatic
tissue, heart and muscle were also processed for histol-
ogy from moribund fish.
Bacteriologial examination
Inocula from head kidney of all individuals were pla ted
onto Difco™ Marine Agar 2216 and blood agar supple-
mented with 1.5% NaCl. Agar was incubated at 15°C
until colonies could be seen, or discarded after 14 days
if no colonies appeared. Colonies were cultivated in
Difco™ Marine Broth 2216 for 24-48 h and frozen in
this media with 20% glycerol at -80°C for long term sto-
rage of bacteria stock. DNA was extracted from bacteria
by resuspending a single colony in 50 μlofdestH
2
0,
vortexing, heating at 95°C for 5 min and centrifuging at
12000 × g for 1 min. One μl of the resulting supernatant
containing DNA was used as a template in a PCR reac-
tion; 5 μl of 10 × ExTaq buffer (TaKaRa), 4 μlof10
mM dNTP’s, 1 μl of forward and reverse primers target-
ing the 16 S rRNA gene of a broad spectra of bacteria;
EUGB27F (5’-AGAGTTTGATCMTGGCTCAG-3’)and
EUG1518R (5’-AAGGAGGTGATCCANCCRCA -3’)
[38], 0.3 μlofExTaq polymerase (TaKaRa), to a total
volume of 50 μl. The PCR was run under the following
conditions; an initial denaturing at 94°C for 3 min, fol-
lowed by 35 cycles of denaturation at 94°C for 30 s,
annealing 52°C for 45 s, elongation 72°C for 2 min, fol-
lowed by a final elongation stage of 72°C for 10 min.
PCR-products were evaluated on a 1% agarose gel in 1
× Tris-acetate-EDTA (TAE) buffer and products were
sequenced directly in both directions by the use of a
ABI Prism BigDye™ Terminator Cycle Sequencing Ready
Reaction kit, version 3.1 (Applied Biosystems, Perkin-
Elmer) according to the manufacturers instruc tions,
with the primers EUGB27F or EUG1518R and analyzed
Andersen et al. Virology Journal 2010, 7:198
/>Page 3 of 14
at the sequence facility at Bergen High Technology Cen-
tre. The sequences were processed using Vector NTI
Contig suite version 9.0.0 (Informax) and identified
using BLAST.
Exogenous control for real-time RT-PCR analysis of
plasma and water samples
Two exogenous controls or spikes were used in this
study in order to quantify SAV-specific viral RNA levels
in water or plasma; the extreme halophile Halobacter-
ium salinarum (an archaeon) (type strain DSM 3754/
ATCC 33171) and the aquatic rhabdovirus Viral H ae-
morrhagic Septicaemia Virus (VHSV). The VHSV virus
isolate was of genotype III and had been isolated from
rainbow trout in Norway in 2008 [39], and given the
name FA28.02.08 (Genbank acc.# GU121099 and
GU121100). H. sali narum was cultivated at 37°C in
medium 97 from DSMZ to an optical density OD
600 nm
of 2.0. VHSV was cultivated at 14°C in RT-gill cells for
two passages until appearance of CPE and with a viral
endpoint titer of 1 × 10
7
virus per ml. Virus superna-
tants (sterile filtered) and H. salinarum in its medium
were aliquoted at these concentrations and frozen at
-80°C for subsequent spiking of samples. Plasma sam-
ples (25 μl) were added 4 μlofVHSVpriortoRNA
extraction. For water samples, the H. salinarum spike
was a dded prior to filtration (20 μl per liter) as a filtra-
tion control, whereas VHSV was added after filtration as
a RNA extraction control (4 μlper350μlsampleof
lysis buffer-see next section).
Water sampling
One liter of sea water was sampled from the respe ctive
fish tanks in sterile autoclaved screw-cap bottles (Nunc).
Sampling was done at the following time points after
SAV infection; 6, 13, 20, 28, 37 and 69 dpi for all tanks.
In addition, in order to obtain more detailed informa-
tion about the onset and duration of the virus shedding
period, water fr om the CNorm and SNorm groups were
monitored more closely than CRed and SRed, with
water sampling at 2, 4, 8, 10, 15, 17 and 22 days post
SAV-infection.
Water filtration for viruses was done according to a
VIRADEL (virus-adsorption-elution) method (see
[40,41]) u sing electropositive 1 MDS filters [42,43]. Fil-
tration was done following the instructions made by the
manufacturer, with some modifications. Briefly, one liter
of sea water was vacuum filtered through one-layer of
electropositive Zeta Plus® Viro sorb® 1 MDS Filters
(Cuno Inc, U.S.A.) with a glass filtration system for 47
mm diameter membranes (Pyrex®Laboratory Glassware,
U.K) with a water flow of 0.2-0.5 liters per min, after
adding 20 μlofH. salinaru m (see previous section). The
filters were placed upside down in 1.4 ml of lysis buffer
(E.Z.N.A total RNA kit from OmegaBioTek) in 50 mm
diameter petri dishes, seal ed with parafilm and shaken
for 10 minutes (150 rpm) at room temperature. Two
portions (à 350 μl) of lysis buffer were removed and 4
μl of VHSV was added to one of these portions (the
other portion acted as a VHSV-neg ative control). The
samples were each mixed with 350 μl70%EtOH,vor-
texed and frozen at -80°C prior to subsequent thawing
and RNA extraction following the manufacturer’s proto-
col using the E.Z.N.A total RNA kit from OmegaBioTek.
This modified metho d was evaluated prior to use and
resulted in at least a 20 fold concentration of viral RNA
compared to unfiltered (unconcentrated) samples, and
was highly reproducible (data not shown).
RNA extraction and real-time RT-PCR
Total RNA was extracted from tissues (gills and hearts
10-20 μg) using TRIreagent (Sigma) according to the
method described by Devold and coworkers [44],
whereas total RNA were extracted from serum samples
(25 μl) with the E.Z.N.A total RNA kit from OmegaBio-
Tek following the manufacturer’sprotocol.TheRNA
was eluted in 50 μl of DEPC treated H
2
0water.The
Verso™ 1-step QRT-PCR Rox kit from Thermo Scientific
was used for real-time RT-PCR analysis. The nsP1-assay
targeting the nsP1-gene in SAV [45] was applied for
specific detection of SAV, whereas the elongation factor
1 alpha (EF1A
A
) assay [46] were us ed as an endogenous
control for tissues. The VHSV08-assay targeting VHSV
[39] and the Sal-assay targetin g H. salinarum (present
study; F-primer: 5’-GGGAAATCTGTCCGCTTAACG-
3’, R-primer: 5’- CCGGTCCCAAGCTGAACA-3’, Probe:
VIC-5’- AGGCGTCCAGCGGA-3’-MGB) was used as
exogenous controls when extracting R NA from plasma
and water samples. The Sal-assay generates a 59 bp
PCR-product (position 541-600 of Acc.# AB219965).
The real-ti me master mixture consisted of 6.25 μl 1-step
QPCR Rox Mix (2 ×), 0.625 µl RT Enhancer, together
with 0.125 µl of Verso Enzyme mix. Primer and probe
concentrations had been optimized for each assay; F pri-
mer/R primer/probe: nsP1 assay (SAV): 900 nm/900
nm/200 nm, EF1A
A
assay (elongation factor 1 alpha);
900 nm/900 nm/225 nm), Sal assay: 300 nm/900 nm/
200 nm, VHSV08 assay: 600 nm/600 nm/225 nm. Pri-
mers and probes at their respective concentrations were
added to the master mixture and adjusted with ddH
2
0
to a total volu me of 10.5 µl prior to adding 2 µl of RNA
template. The real-time RT-PCR reaction was run in a
7500 Fast Real-Time PCR System cycler from Applied
Bio systems using the following conditions: reverse tran-
scription at 50°C for 15 minutes followed by activation
of the Thermo-Start DNA polymerase at 95°C for 15
minutes prior to amplification with 45 cycles of 95°C for
15 se conds and 60°C f or 1 min (denaturation and
Andersen et al. Virology Journal 2010, 7:198
/>Page 4 of 14
annealing/extension) . For each assay a standard curve
was generated from dilution series of RNA in 20 ng/μl
yeast tRNA (Invitrogen) ( nsP1-, EF1A
A
- and Sal-a ssays)
or ddH
2
0 (VHSV-assay).
All samples that were analyzed with real-time RT-PCR
were performed in triplicate. Only samples that were
positive in triplicates were considered fo r normalization.
Thresholds for all assays were set to 0.01 except for the
Sal-assay which was set to 0.001. Ct-values obtained for
the target gene (nsP1-assay) were normalized against the
endogenous control EF1A
A
-assay (tissues) whereas
plasma samples were normalized against the VHSV08-
assay. Water samples were normalized against both the
Sal-assay and the VHSV08-assay. Samples from dead
fish were not normalized, butonlyconsideredasSAV-
positive or SAV-negative. RNA extraction controls and
no template controls (NTC) were included in all runs in
order to detect possible contamination. In addition, a
positive control was included in all runs in order to
detect reagent mix erro rs. If water or plasma samples
were found SAV-positive, one parallel sample that had
not been spiked with VHSV was also checked for the
presence of VHSV that could have given rise to false
background for normalization of real-time RT-PCR data
(VHSV-negative controls).
Mean Ct-values for the target gene nsP1 were nor-
malized against endogenous (EF1A
A
)- and exogenous
reference genes (Sal- and VHSV-assays) by the use of
the Microsoft®Excel® based computer software Q-Gene
[47]. The resulting mean normalized expression
(MNE)-values were transformed into N-folds by defin-
ing the lowest MNE valued obtained during the experi-
ment for each tissue as 1. The data were then Log2
transformed. In order to evaluate if there were any sig-
nificant differences in the normalized RNA levels of
samples from the SNorm and the SRed groups, Log2
valuesforeachsamplefrombothgroupsatthevarious
sampling points were imported into the GraphPad
Prism 5.00 software; GraphPad Software, Inc., San
Diego, CA. Statistical differences in viral RNA levels in
plasma, water, gills and hearts between groups were
evaluated by a Kruskal-Wallis non-parametric test fol-
lowed by Dunn’s post test. The same test were also
used for evaluating differences in weight, length and
condition factor between groups, whereas the Fisher’s
exact test were used to evaluate mortality levels
between groups. A p-value of 0.05 or less was consid-
ered as significant.
Histology and histological scoring system
Tissues (heart, somatic muscle and pancreatic tissue
from pyloric caeca region and associated with spleen)
from five fish from all experimental groups at six time
points were fixed in a modified Karnovsky’s fixative
containing Ringer’s solution with 4% sucrose, and kept
at 4°C until further processing. Tissues were washed 3
times (15 min each) in a phosphat e buffer with Ringer’s
solution and dehydrated in an ethanol series (70%-96%
ethanol). The tissue were then infiltrated with Historesin
(7022 31731 Leica Historesin Embedding Kit) (Leica
Microsystems) or with Technovit 7100 (Hereaus Külz-
ner) as described by the manufacturer, and left to
harden in molds over night at room temperature. Sec-
tions 1.5-2 μm thick were cut on a Reichert- Jung 2050
Supercut microto me (Cambridge Instrument s) or a
Leica RM2255 and then mounted on slides in dH
2
0.
Sections were dried and stained with 1% Toluidine blue
and studied in a Leitz Dialux 20 or a Leitz Aristoplan
light microscope (Leica). Pictures were taken with a
digital Olympus camera E-330 or a Nikon DS-US1 cam-
era with NIS-Elements software version 5.03 (Nikon
Instruments Inc). Histopathological lesions in pancreas,
muscle and hearts were evaluated from five fish from
each group at each time point from the SNorm and
SRed groups (n = 60), whereas three fish from e ach
group at each time point were evaluated from CNorm
and CRed (n = 40). Lesions were scored in accordance
to a semi-quantitative lesion score system (Table 1)
based upon the one presented by McLoughlin et al
(2006) [22]. Briefly, normal histology was given the
score 0, f ocal to mild pancreatic acinar cell degenera-
tion/myocytic degeneration in hearts and muscle (±
inflammation) were given the score 1, whereas score 2
and 3 depict ed more severe lesions in the tissues (see
Table 1 for details). Only lesions with a score of ≥ 2
were considered as PD-specific as focal epicarditis (score
1) could also be seen in he arts from some of the fish in
the control groups. Lesions were evaluated as a blind
study.
Results
Real-time RT-PCR standard curves and efficiencies
The PCR efficiency, regression analysis and s tandard
curve slope s (Ct-value vs. log quantity) of the various
assays were calculated from the Ct-values obtained from
dilution series of RNA and are given in Table 2. The
mean slope for all assays was similar (Table 2) and indi-
cated high PCR efficiency.
Bacteria isolations
Several bacteria were isolated on marine agar and blood
agar (2% NaCl) from head kidney of salmon during this
experiment. By BLAST search tool the bacteria were
identified to genus and it was established that they all
belonged to marine genera; Idiomarina sp., Cobetia
marina, Janibacter sp., Bacillus sp., Tenacibaculum/Fla-
vobacterium, Vibrio sp., Vibrio splendidus, and Pseudoal-
teromonas sp.
Andersen et al. Virology Journal 2010, 7:198
/>Page 5 of 14
Oxygen levels
Two days after infection, the oxygen levels in one tank
with uninfected fish (CRed) and one tank with SAV-
infected fish (SRed), were gradually (slowly within a 24
h period) lowered from 85-90% saturation (9.2-9.7 mg
O
2
per liter, approx. 300-400 lh
-1
tank
-1
) to 60-65%
saturation (6.5-7.0 mg O
2
per liter, approx. 100-200 lh
-
1
tank
-1
) by reduction of the flow-through rate. The aver-
age oxygen level during the experiment in the various
experimental tanks was; CNorm; mean 86.29 (min 80,
max 94), CRed; mean 64.79, (min 52, max 71), SNorm;
mean 84.32 (min 69, max 93), SRed; mean 65.57 (min
57, max 75), respectively.
Mortality
Mortality data were collected on a daily basis, and
cumulative mortality r anged from 6.1% (CNorm) to
12.3% (CRed) in the uninfected controls, and from 1.5%
(SNorm) to 10.8% (SRed) in the SAV-infected groups
(Figure 1). The differences in mortalities between groups
were tested w ith a Fisher’s exact test, which found no
statistical significant differences between groups. All
dead fish (gill tissue) were analyzed with real-time
RT-PCR; of these no fish in the control groups were
SAV-positiv e, whereas in t he SAV-in fected groups there
was one out of one (SNorm) and five out of s even dead
fish (SRed) which were SAV-positive (raw Ct-values of
29-37).
Clinical signs and gross pathological changes
Variable degrees of fin erosions (sometimes with bleed-
ings), especially of the dorsal and pectoral fins, could be
seen in all experimental groups throughout the study.
Some individuals also had pete cchial bleedings/erythe-
mia on abdomen and at pectoral fin bases, and four
dead fish had severe erosions behind pectoral fins (CRed
and SRed groups).
Weight and length development (condition factor)
During the 70 days the experiment lasted, it was not
possible to see a significant increase in mean body
length or weight for the fish groups, nor a considerable
difference in mean weight, length or Fulton’scondition
factor (K) between the various groups (see additional
files 1, 2 and 3).
SAV in blood
No viral RNA from SAV was detected in plasma sam-
ples from the control groups at any time points. In both
SAV-infected groups, SAV was detected in plasma sam-
ples by real-time RT-PCR in fish sampled at 7 and 14
dpi only. Viral RNA levels were normalized against the
exogenous control VHSV (VHSV08-assay) (Figure 2).
This normalization strategy demonstrated that the high-
est levels of SAV nucleic acids occurred at 7 dpi, in
both SAV-groups. No statistical differences between
SAV groups at each time point could be seen with
regards to viral RNA levels. No VHSV-controls (plasma
Table 1 Semi-quantitative score system for comparing lesion severity between tissues
Score Description
Pancreas lesions
0 Normal appearance
1 Focal pancreatic acinar cell degeneration ± inflammation
2 Multifocal degeneration/atrophy of pancreatic acinar tissue, plus some normal tissue left ± inflammation
3 Significant multifocal degeneration/atrophy of pancreatic acinar tissue, no normal tissue left ± inflammation
Heart lesions
0 Normal appearance
1 Focal myocardial degeneration and/or inflammation (< 50 fibres affected)
2 Multifocal myocardial degeneration ± inflammation (50-100 fibres affected)
3 Severe diffuse myocardial degeneration ± inflammation (> 100 fibres affected)
Muscle lesions
0 Normal appearance
1 Focal myocytic degeneration ± inflammation
2 Multifocal myocytic degeneration ± inflammation
3 Severe diffuse myocytic degeneration± inflammation
The system was adapted from McLoughlin et al (2006) [22] with some modifications.
Table 2 Standard curve evaluation of the various assays
Assay Slope R
2
E
nsP1 -3.6652 0.9975 0.8743
EF1A
A
-3.6711 0.9991 0.8724
SAL -3.7425 0.9849 0.8501
VHSV08 -3.3961 0.9699 0.9839
The mean slope of the standard curve, regression (R
2
) and efficiency (E = -1
+10(-1/slope)) were calculated.
Andersen et al. Virology Journal 2010, 7:198
/>Page 6 of 14
samples without VHSV-spike) analyzed from plasma
were VHSV-positive.
SAV levels in gills and hearts
No SAV viral RNA could be detected in gills from the
uninfected groups reared at normal or reduced oxygen
levels. However, in hearts from the same individuals,
very low amounts of SAV viral RNA could be detected
in 7 out of 60 fish at 7-21 dpi. The raw Ct-values were
in the range of 32-36. In both SAV-infected groups,
viral RNA from SAV was detected in gills (Figure 3) and
hearts (Figure 4) at all sampling points. The RNA levels
in the gills and hearts peaked at 7 and 14 dpi, respec-
tively (Figure 3 and 4). In general, the viral RNA levels
seemed to be higher in hearts compared to the gills.
The mean levels of SAV viral RNA when normalized
against the reference gene EF1A
A
were not significantly
different between the SAV-infected groups in gills or
hearts during the experiment.
Water samples
In order to obtain more detailed information on the
onset and duration of the virus shedding period, water
from the CNorm and the SNorm groups were moni-
tored more closely than CR ed and SRed. Viral RNA was
detected in water sampled from the SNorm group
between 4-10 days post infection, and in SRed virus
were detected at 6 and 13 dpi (Table 3). After this per-
iod, SAV specific viral RNA could not be detected in
water from any of the SAV-infected groups. SAV were
not detected in water samples from the tanks with the
uninfected controls. When normalizing the relative
amount of viral RNA in water against the spiked filtra-
tion control H. salinarum and the RNA-extraction con-
trolVHSV,itwasevidentthatthehighestamountsof
viral RNA in water in both SAV-infected groups could
be seen at 6 days post infection, declining at 10-13 dpi
(Table 3). Only water samples f rom the SNorm group
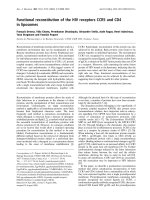
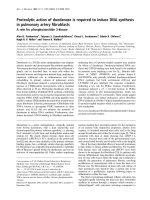
Figure 1 Cumulative mortality and morbidity during the experiment. The number of fish in each tank was 65. The highest percentage of
mortalities/morbidities could be seen in the CRed (8 out of 65; 12.3% morbidity/mortality) and in the SRed group (7 out of 65; 10.8% morbidity/
mortality). CNorm = Uninfected controls, normoxia. CRed = Uninfected controls, reduced oxygen conditions. SNorm = SAV-infected, normoxia.
SRed = SAV-infected, reduced oxygen conditions.
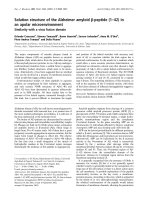
Figure 2 Levels of SAV-specific viral RNA in plasma.ViralRNA
(nsp1-assay) was normalized against the exogenous spike VHSV.
Mean normalized expression (MNE) values were Log2 transformed.
Plasma samples were only positive at 7 and 14 dpi. At 7 dpi; 4/4
were SAV-positive in both SAV-groups, whereas 2/5 and 3/5 plasma
samples were SAV-positive at 14 dpi in the SNorm and SRed,
respectively. Significant differences between the SAV- groups at
each time point were tested with a Kruskal-Wallis non-parametric
test followed by a Dunn’s post test. SNorm = SAV-infected,
normoxia. SRed = SAV-infected, reduced oxygen conditions. Median
values are shown as horizontal lines.
Andersen et al. Virology Journal 2010, 7:198
/>Page 7 of 14
were normalized against VHSV. No statistical difference
in viral RNA levels between groups could be seen.
Histopathology
Lesions in pancreatic- and heart tissue were only observed
in SAV3-challenged fish. The exception was small foci
with epicarditis in hearts, which could be found in 11 out
of 43 fish (25.6%) of the examined individuals from the
control groups. No muscle lesions were f ound in any of
the experimental groups throughout the study. Two mori-
bund fish were sampled from CNorm at 56 and 62 dpi,
and one fish from SRed at 42 dpi. Pancreas, heart and
muscle tissue were processed for histology and examined,
with no lesions recorded in these organs.
Pancreas
Vacuolation and rounding of the acinar cells could b e
seen in 5 out of 8 individuals at 7 dpi. (Figure 5).
Degeneration and fibrosis of the exocrine part of the
pancreatic tissue was observed in 8 fish at 7-21 dpi.
After this period no pancreatic lesions were evident.
Hearts
Focal epicarditis of the ventricle w as found in some
individuals at 7-14 dpi in both SAV-infected groups
(Figure 6). At 14 dpi, focal to multifocal cardiomyocytic
degeneration was identified in c ompact and spongy
layers of the ventricle in a few individuals (score 2). In
the SNorm- and the SRed groups, severe epicarditis
could be seen in hearts at 21 dpi, together with severe
Figure 3 Levels of SAV-specific viral RNA in gills. Viral RNA (nsp1-assay) was normalized against EF1A
A
. Mean normalized expression (MNE)
values were Log2 transformed. Five fish were sampled from each group at each time point (7, 14, 21, 35, 49 and 70 dpi). N positive at 21, 35, 49
and 70 in the SNorm group were 4, 2, 3 and 2, whereas n positive in the SRed-group at 14, 49 and 70 dpi were 4, 0 and 2, respectively.
Significant differences between the SAV- groups at each time point were tested with a Kruskal-Wallis non-parametric test followed by a Dunn’s
post test. SNorm = SAV-infected, normoxia. SRed = SAV-infected, reduced oxygen conditions. Median values are shown as horizontal lines.
Figure 4 Levels of SAV-specific viral RNA in hearts. Viral RNA (nsp1-assay) was normalized against EF1A
A
. Mean normalized expression (MNE)
values were Log2 transformed. Five fish were sampled from each group at each time point (7, 14, 21, 35, 49 and 70 dpi). In the SRed group at
49 dpi only 4 fish were positive. SNorm = SAV-infected, normoxia. SRed = SAV-infected, reduced oxygen conditions. Significant differences
between the SAV- groups at each time point were tested with a Kruskal-Wallis non-parametric test followed by a Dunn’s post test. Median
values are shown as horizontal lines.
Andersen et al. Virology Journal 2010, 7:198
/>Page 8 of 14
multifocal necrosis and inflammation of the compact
and spongy myocardium (score 3). At 35 dpi, a moder-
ate to extensive multifocal epicarditis was present. Infil-
tration of inflammation cells/increased cellularity could
be seen, especially in the junction of compact and
spongy myocardium at 35-49 dpi. In this period, spora-
dic focal degeneration and inflammation of myocard
was found. After 35 dpi, only small foci with epicarditis
could be seen together with foci of increased cellularity/
inflammation in the junction of compact and spongy
layers of the ventricle.
Results from histopathological examination of pan-
creas, heart and skeletal muscle of all experimental
groups was evaluated in a semi-quantitative approach
(Table 1) based upon the scoring system described in
McLoughlin et al (2006) [22] with some modifications.
Findings are summarized in Table 4. Severe lesions o f
score 3 in heart (severe inflammation together with
multifocal to diffuse cardiomyocytic degeneration in
ventricle) could be seen at 21-35 dpi in both SAV-
infected groups during the experiment. No difference in
histo-scor e was found between SNorm and SRed at any
sample point.
Discussion
A large discr epancy exists between the h igh mortality
levels often repor ted with pancreas disease (PD) in field
versus experimental infect ions with SAV. It is possible
that certain key environmental factors, such as oxygen
levels, might play an important role concerning the
severity or the progress of PD. In general, hypoxia can
act as a stressor to fish [35] which may result in
impaired immune functions mediated through the
hypothalamo-pituitary-interrenal axis and lead to
decreased resistance to infections [48,49]. In our study,
mortality could not be linked directly to the oxygen
levels since similar mortality levels could be seen in a ll
experimental groups. Furthermore, the development or
progress of PD was not affected by oxygen levels as
lesions of comparable severity were seen during the
same time period in both SAV-groups. It is possible that
by subjecting fish to constant sub-lethal oxygen levels as
performed in this trial, the fish probably experienced a
lower stress level and were able to acclimatize to the
hypoxic conditions. If the salmon had been r epeatedly
exposed to fluc tuating oxygen levels and not constant
suboptimal levels, it is possible that this would have
affected the disease progress or led to higher mortality
levels (i.e added stress). Exposure of fish to hypoxic con-
ditions for a longer time prior to SAV-infection than
was used in this study could have rendered the fish
more susceptible to SAV-infection. Moreover, it can not
be excluded that the virus infection route could have an
impact on mortality levels, as this has been seen for
another salmon virus, IPNV, a feature which was attrib-
uted to th e immune system b eing activated in different
ways [50].
The SAV-infection led to severe lesions in hearts
during the course of infection, characterized by epicar-
ditis and multifocal degeneration of cardiomyocytes in
ventricle of the heart. Fe rguson et al [51] concluded
that the most severe lesions associated with PD were
myocardial degeneration. In our study, in addition to
severe lesions in hearts, lesions in exocrine pancreas
could also be seen at 7-21 dpi, whereas no lesions
could be seen in skeletal muscle during the experi-
ment. It is possible that the absence of muscle lesions
in many experimental studies could explain the lower
mortality levels reported from experimental SAV-infec-
tions, as muscle lesions have been suggested as a con-
tributing factor to PD-mortality in field [52].
Furthermore, muscle lesions in the oesophagus have
been reported from PD-cases [51,52], a feature which
probably has the potential to interfere with food
intake. Nevertheless, the presence o f muscle lesions is
probably not the single reason for the discrepancy in
mortality levels, since experimental S AV-studies have
been described where muscle lesions were induced but
with no mortality observed [4,28].
Salmon has been shown to produce protective neutra-
lizing antibodies shortly after i.p infection [53], readily
diminishing viruses from the system. SAV-specific viral
RNA was shown t o be present in tissues (gills and
hearts) at lasting low levels after the acute phase and
throughout the experimental period of 70 days. Such
long-lasting presence of SAV-specific viral nucleic acids
in tissues have previously been described by Christie et
al [28] (140 days) and by Andersen et al [45] (190 days)
during experimental infections, and also in longitudinal
field studies [16,54]. The nature of these SAV-specific
RNAs has not been determined [28,45]. A few fish from
the control groups were shown to be SAV-positive
(heart tissue) in this study, which might be due to car-
rier status as presence of SAV in the fresh water phase
has been shown [55,56].
Table 3 Levels of SAV-specific viral RNA (nsp1-assay) in
water
Log2 MNE nsP1 vs. Sal (VHSV) in water
Groups 2 4 6 8 10 13
SNorm 0 (0) 4 (0) 8 (5) 5 (1) 4 (0) 0 (0)
Sred ND ND 9 (ND) ND ND 2 (ND)
nsP1 were normalized against the exogenous spikes Halobacterium salinarum
and VHSV (parenthesis). Mean normalized expression (MNE) values were Log2
transformed. Viral RNA specific for SAV could only be found in water 4-13 dpi.
After this period, no SAV could be detected in water. Only water samples
from the SNorm group were normalized against VHSV. SNorm = SAV-infected,
normal oxygen conditions. SRed = SAV-infected, reduced oxygen conditions.
ND = no data.
Andersen et al. Virology Journal 2010, 7:198
/>Page 9 of 14
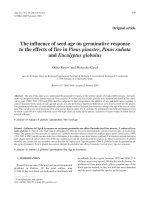
Figure 5 Pancreas Salmo salar L. Resin sections (1.5 μm) were stained with Toluidine blue. A) and B); normal pancreatic tissue with fat tissue
(FT) between pyloric caeca (PC). Note endocrine pancreas; islets of Langerhans (
*
). Zymogene granula (black arrow) can be seen inside the
exocrine pancreas acini (grey arrows). C)- F); pancreatic tissue from SAV-infected fish (7 dpi) showing rounding and vacuolation (arrowheads) of
exocrine acini/cell degeneration. Note that zymogene granula can still be seen in some degenerated acini.
Andersen et al. Virology Journal 2010, 7:198
/>Page 10 of 14
Figure 6 Hearts Salmo salar L. Resin sections (1.5 μm) were stained with Toluidine blue. A); normal heart tissue, showing the various layers of
the ventricle; epicardium (1), stratum compactum (2) and stratum spongiosum (3) together with endocardium (4). B) -H); ventricle from SAV-
infected fish. Focal epicarditis (B; black arrow) and focal cardiomyocytic degeneration (C; arrowheads) could be observed at 14 dpi. D)-F); severe
epicarditis and myocarditis (black arrows), together with multifocal degeneration of cardiomyocytes (arrowheads) was seen at 21 dpi. G) and H);
hypercellularity and inflammation (black arrows) in the contact layer between compact and spongy myocardium was seen at 35 dpi.
Andersen et al. Virology Journal 2010, 7:198
/>Page 11 of 14
ThisstudyextendsthecurrentknowledgeofSAV-
pathogenesis in Atlantic salmon since it is the first to
demonstrate virus shedding during infection. The pre-
sent study also shows that virus shedding coincides with
viraemia. Atlantic salmon Salmo salar L. smolts that
were intraperitoneally (i.p.) infected with a salmonid
alphavirus (SAV3) isolate (SAVH30/04) shed detectable
levels of virus into the surrounding water in the period
4-13 days post infection. This was assessed by a VIRA-
DEL (virus-adsorpti on-elution) method using electr opo-
sitive 1MDS virus filters (see [40-43]). The VIRADEL
method was optimized for downstream real-time RT-
PCR and this modified method has proven to be a very
useful tool which can supplement experimental infection
trials with information related to viral shedding. Also,
this method has a pot ential for simultaneous detectio n
and monitoring of levels of other pathogens, as such
abilities have been demonstrated for electropositive
1MDS filters [43]. Detectio n of infectious SAV-particles
in water samples can also be monitored by inoculation
onto susceptible cell cultures after viruses have been
eluted from filters with cell medium containing sera.
We further demonstrate that the highest levels of SAV-
specific viral RNA shed to the water could be seen at 6
days post infection in both SAV-infected groups. This
coincided with the period where the highest SAV viral
RNA l evels could be seen in plasma (7 dpi) and gills in
both SAV-groups. Both infectious SAV-particles/viral
RNA have been shown to only be present in blood for a
relative short period after infection [54]. The presence
of viral RNA in plasma as soon as 7 dpi is suggestive of
a rapid onset of virae mia after i.p. injection of virus, as
reported for other experiment al i.p. infection s with SAV
[22,27,28,57]. In tissues, the highest viral RNA levels
specific for SAV could be seen at 7 dpi in gills and at
14 dpi in hea rts, respectively. In general, the viral RNA
levels seemed higher in hearts than in gills. However, no
significant differences were found between the SAV-
infected groups regarding viral RNA levels in tissues or
water, suggesting that oxygen levels did not have a con-
siderable effect on the infection. In our study, detectable
levels of virus shedding p receded appearance of severe
lesions in heart which could be seen from 21 -35 days
after i.p. infection. Viral shedding from a SAV-infected
fish population in a farm, however, will be a more com-
plex situation, as the time period where viral sh edding
can be seen will be more pro longed and not a synchro-
nous event as seen in experimental tank systems. In
addition, information is lacking regarding the route of
virus entry/exit and the virus dose necessary to elicit an
infection. Our findings that SAV shedding coincides
with blood viraemia further supports the proposal of
Graham and coworkers [54] that in order to detect or
monitoranactiveSAV-infectioninagivensalmon
population, blood serum or plasma should be monitored
in addition to the previously recommended tissues for
real-time RT-PCR diagnostics; pseudobranch/gills and
hearts [45,54].
Conclusions
In the present study, experimentally induced hypoxia failed
to explain the discrepancy between the severities reported
from fie ld outbreaks of PD-disease and experimental infec-
tions as the severity or the progress of the disease was not
affected. We also demonstrate for the first time by the use
of a modified VIRADEL method that detect able levels of
SAV are shed into water during v iraemia.
Additional material
Additional file 1: K-factor. The additional files K-factor.jpg, length.jpg
and weight.jpg describe mean development of condition factor (K),
length in cm and weight in grams for all groups during the experiment.
Additional file 2: Length. The additional files K-factor.jpg, length.jpg
and weight.jpg describe mean development of condition factor (K),
length in cm and weight in grams for all groups during the experiment.
Additional file 3: Weight. The additional files K-factor.jpg, length.jpg
and weight.jpg describe mean development of condition factor (K),
length in cm and weight in grams for all groups during the experiment.
Acknowledgements
The authors are grateful to the Lauritz Meltzer fund at the University of
Bergen for funding this project, and would also like to thank all persons
Table 4 Summary of score lesions (histopathological
findings) from heart tissue
Days post infection
Groups 7 14 21 35 49 70
SNorm 0 03200
022200
023320
020202
02ND200
0% 80%
(1.6 ± 0.9)
75%
(2 ± 1.4)
100%
(2.2 ± 0.5)
20%
(0.4 ± 0.9)
20%
(0.4 ± 0.9)
SRed 0 03200
ND20200
023200
023200
003300
0% 60%
(1.2 ± 1.1)
80%
(2.4 ± 1.3)
100%
(2.2 ± 0.5)
0% 0%
For a description of score criteria, see Table 1. Hearts from five fish were
sampled from each group at each time point. No lesions could be seen in
control fish, except for small foci with epicarditis in 11 out of 43 control fish
(25.6%). The percentage of fish with PD-specific lesions (≥2) at each time
point is given, and also the mean lesion score with standard deviation given
in parenthesis. SNorm = SAV-infecte d, normal oxygen conditions. SRed = SAV-
infected, reduced oxygen conditions. ND = no data.
Andersen et al. Virology Journal 2010, 7:198
/>Page 12 of 14
involved in sampling of fish. The employees at ILAB are appreciated for
carefully monitoring and adjusting oxygen levels. We are also grateful for
being able to use the polyclonal antibodies against SAV3 developed at the
University of Bergen in 2005 by Karl F. Ottem. Kuninori Watanabe,
Department of Biology, University of Bergen, is valued for advice on
histology preparation and Paul Løvik (same Department) for autoclaving and
microscopy assistance. Dr. Petter Frost at Schering Plough-Intervet Norbio,
Bergen, is appreciated for valuable inputs, whereas Mette Remen at the
Institute of Marine research, IMR, Bergen, Norway, is valued for sharing
unpublished results from fish experiments concerning hypoxia. We also
thank Lindsey Moore at Schering Plough-Intervet Norbio, Bergen, for
proofreading the manuscript.
Author details
1
Department of Biology, University of Bergen, Pb 7800, N-5020 Bergen,
Norway.
2
Cavanilles Institute of Biodiversity and Evolutionary Biology,
University of Valencia, Pb 22085, 46071 Valencia, Spain.
Authors’ contributions
AN and LA designed the experiment and conducted the fish infection. LA
designed the modified water filtration method and performed all laboratory
work, except the design of the Sal-assay, which was made by KH. LA and
AN evaluated the histology sections. LA analyzed the results and wrote the
manuscript. AN and KH critically revised the manuscript. AN has contributed
with discussions during planning. All authors read and approved the final
manuscript.
Competing interests
The authors declare that they have no competing interests.
Received: 4 June 2010 Accepted: 21 August 2010
Published: 21 August 2010
References
1. Fringuelli E, Rowley HM, Wilson JC, Hunter R, Rodger H, Graham DA:
Phylogenetic analyses and molecular epidemiology of European
salmonid alphaviruses (SAV) based on partial E2 and nsP3 gene
nucleotide sequences. J Fish Dis 2008, 31:811-823.
2. Castric J, Baudin Laurencin F, Bremont M, Jeffroy J, Le Ven A, Bearxotti M:
Isolation of the virus responsible for sleeping disease in experimentally
infected rainbow trout (Oncorhynchus mykiss). Bull Eur Ass Fish Pathol
1997, 17(1):27-30.
3. Villoing S, Béarzotti M, Chilmonczyk S, Castric J, Brémont M: Rainbow trout
sleeping disease virus is an atypical alphavirus. J Virol 2000, 74(1):173-183.
4. Weston J, Villoing S, Bremont M, Castric J, Pfeffer M, Jewhurst V,
Mcloughlin MF, Rødseth O, Christie KE, Koumans J, Todd D: Comparison of
two aquatic alphaviruses, salmon pancreas disease virus and sleeping
disease virus, by using genome sequence analysis, monoclonal
reactivity, and cross-infection. J Virol 2002, 76:6155-6163.
5. Graham DA, Rowley HM, Walker IW, Weston JH, Branson EJ, Todd D: First
isolation of sleeping disease virus from rainbow trout, Oncorhynchus
mykiss (Walbaum), in the United Kingdom. J Fish Dis 2003, 26:691-694.
6. Weston JH, Graham DA, Branson E, Rowley HM, Walker IW, Jewhurst VA,
Jewhurst HL, Todd D: Nucleotide sequence variation in salmonid
alphaviruses from outbreaks of salmon pancreas disease and sleeping
disease. Dis Aquatic Organ 2005, 66:105-111.
7. Hodneland K, Bratland A, Christie KE, Endresen C, Nylund A: New subtype
of salmonid alphavirus (SAV), Togaviridae, from Atlantic salmon Salmo
salar and rainbow trout Oncorhynchus mykiss in Norway. Dis Aquat Organ
2005, 66:113-120.
8. Karlsen M, Hodneland K, Endresen C, Nylund A: Genetic stability within
the Norwegian subtype of salmonid alphavirus (family Togaviridae). Arch
Virol 2006, 151(5):861-74.
9. Olsen AB, Wangel C: An outbreak of PD-like disease in rainbow trout
(Oncorhynchus mykiss) in Norway [abstract]. Book of Abstracts EAFP 8th
International Conference, 14-19 sept., Edinburgh, Scotland 1997, 62.
10. Taksdal T, Olsen AB, Bjerkås I, Hjortaas MJ, Dannevig BH, Graham DA,
McLoughlin MF: Pancreas disease in farmed Atlantic salmon, Salmo salar
L., and rainbow trout, Oncorhynchus mykiss (Walbaum), in Norway. J Fish
Dis 2007, 30:545-558.
11. Boucher P, Baudin-Laurencin F: Sleeping disease and pancreas disease
comparative histopathology and acquired cross-protection. J Fish Dis
1996, 19:303-310.
12. Hodneland K: Salmonid Alphavirus (SAV) - Genetic characterisation of a
new subtype, SAV3, and implementation of a novel diagnostic method.
Dr scient thesis University of Bergen, Department of Biology 2006.
13. Murphy TM, Rodger HM, Drinan EM, Gannon F, Kruse P, Korting W: The
sequential pathology of pancreas disease in Atlantic salmon farms in
Ireland. J Fish Dis 1992, 15:401-408.
14. McLoughlin MF, Nelson RN, McCormick JI, Rowley HM, Bryson DB: Clinical
and histopathological features of naturally occurring pancreas disease in
farmed Atlantic salmon, Salmo salar L. J Fish Dis 2002, 25:33-43.
15. Crockford T, Menzies FD, McLoughlin MF, Wheatley SB, Goodall EA: Aspects
of the epizootiology of pancreas disease in farmed Atlantic salmon
Salmo salar L in Ireland. Dis Aquat Organ 1999, 36:113-119.
16. Jansen MD, Taksdal T, Wasmuth MA, Gjerset B, Brun E, Olsen AB, Breck O,
Sandberg M: Salmonid alphavirus (SAV) and pancreas disease (PD) in
Atlantic salmon, Salmo salar L., in freshwater and seawater sites in
Norway from 2006 to 2008. J Fish Dis 2010, 33(5):391-402.
17. Graham DA, Jewhurst H, McLoughlin MF, Sourd P, Rowley HM, Taylor C,
Todd D: Sub-clinical infection of farmed Atlantic salmon Salmo salar
with salmonid alphavirus- a prospective longitudinal study. Dis Aquat
Organ 2006, 27;72(3):193-9.
18. McLoughlin MF, Graham DA: Alphavirus infections in salmonids- a review.
J Fish Dis 2007, 30(9):511-31.
19. McVicar AH: Pancreas disease of farmed Atlantic salmon, Salmo salar,in
Scotland: epidemiology and early pathology. Aquaculture 1987,
67(1987):71-78.
20. McVicar AH: Infection as a primary cause of pancreas disease in farmed
Atlantic salmon. Bull Eur Ass Fish Pathol 1990, 10(3):84-87.
21. Nylund S, Sævareid IO, Nylund A: Occurrence and association of a
microsporidian with salmon diseases in Norway [abstract]. Book of
Abstracts EAFP 14th International Conference, Prague, 14-19 sept 2009, 159.
22. McLoughlin MF, Graham DA, Norris A, Matthews D, Foyle L, Rowley HM,
Jewhurst H, MacPhee J, Todd D: Virological, serological and
histopathological evaluation of fish strain susceptibility to experimental
infection with salmonid alphavirus. Dis Aquat Organ 2006, 72:125-133.
23. Norris A, Foyle L, Ratcliff J: Heritability of mortality in response to a
natural pancreas disease (SPDV) challenge in Atlantic salmon, Salmo
salar L., post-smolts on a West of Ireland sea site. J Fish Dis 2008,
31:913-920.
24. Kristoffersen AB, Viljugrein H, Kongtorp RT, Brun E, Jansen PA: Risk factors
for pancreas disease (PD) outbreaks in farmed Atlantic salmon and
rainbow trout in Norway during 2003-200. Prev Vet Med 2008,
90(1.2):127-136.
25. Houghton G:
Acquired protection in Atlantic salmon Salmo salar parr
and post-smolts against pancreas disease. Dis Aquat Organ 1994,
18:109-118.
26. McLoughlin MF, Nelson RT, Rowley HM, Cox DI, Grant AN: Experimental
pancreas disease in Atlantic salmon Salmo salar post-smolts induced by
salmon pancreas disease virus (SPDV). Dis Aquat Organ 1996, 26:117 124.
27. Desvignes L, Quentel C, Lamour F, Le Ven A: Pathogenesis and immune
response in Atlantic salmon (Salmo salar L.) parr experimentally infected
with salmon pancreas disease virus (SPDV). Fish Shellfish Immunol 2002,
12:77-95.
28. Christie KE, Graham DA, McLoughlin MF, Villoing S, Todd D, Knappskog D:
Experimental infection of Atlantic salmon Salmo salar pre-smolts by i.p.
injection with new Irish and Norwegian salmonid alphavirus (SAV)
isolates: a comparative study. Dis Aquat Organ 2007, 75:13-22.
29. Wheatley SB, McLoughlin MF, Menzies FD, Goodall EA: Site management
factors influencing mortality rates in Atlantic salmon (Salmo salar L.)
during marine production. Aquaculture 1995, 136:195-207.
30. Fridell F, Gadan K, Sundh H, Taranger G, Glette J, Olsen RE, Sundell K,
Evensen Ø: Effect of hyperoxygenation and low water flow on the
primary stress response and susceptibility of Atlantic salmon Salmo salar
L. to experimental challenge with IPN virus. Aquaculture 2008, 270:23-35.
31. Kvamme BO, Oppedal F, Torgersen T, Fridell F, Sundh H, Sundell KS:
Fiskevelferd - Oksygennivået viktig for oppdrettsfisken sin helse og
velferd (in Norwegian). In Kyst og Havbruk 2008. Fisken og havet, særnr.2
Edited by: Boxaspen K, Dahl E, Gjøsæter J, Sunnset BH 2008, 134-137.
Andersen et al. Virology Journal 2010, 7:198
/>Page 13 of 14
32. Breitburg DL: Effects of hypoxia, and the balance between hypoxia and
enrichment, on coastal fishes and fisheries. Estuaries 2002, 25(4b):767-781.
33. Ellis T, North B, Scott AP, Bromage NR, Porter M, Gadd D: The relationships
between stocking density and the welfare of farmed rainbow trout. J
Fish Biol 2002, 61:493-531.
34. Barton BA: Stress in fishes: a diversity of responses with particular
reference to changes in circulating corticosteroids. Integr Comp Biol 2002,
42:517-525.
35. Johansson D, Ruohonen K, Kiessling A, Oppedal F, Stiansen JE, Kelly M,
Juell JE: Effect of environmental factors on swimming depth preferences
of Atlantic salmon (Salmo salar L.) and temporal and spatial variations in
oxygen levels in sea cages at a fjord site. Aquaculture 2006, 254:594-605.
36. Kärber G: Beitrag zur kollektiven behandlung pharmakologischer
reihenversuche. Arch Exp Pathol Pharmakol 1931, 162:480-483.
37. Karlsen M, Yousaf MN, Villoing S, Nylund A, Rimstad E: The amino terminus
of the salmonid alphavirus capsid protein is decisive for subcellular
localization and inhibits cellular proliferation. Arch Virol 2010,
155(8):1281-93.
38. Giovannoni SJ, Rappé MS, Vergin KL, Adair NL: 16 S rRNA genes reveal
stratified open ocean bacterioplankton populations related to the Green
Non-Sulfur bacteria. Proc Natl Acad Sci USA 1996, 23;93(15):7979-84.
39. Duesund H, Nylund S, Watanabe K, Ottem KF, Nylund A: Characterization
of a VHS virus genotype III isolated from rainbow trout (Oncorhynchus
mykiss) at a marine site on the west coast of Norway. Virol J 2010, 7:19.
40. Wallis C, Henderson M, Melnick JL: Enterovirus concentration on cellulose
membranes. J Appl Microbiol 1972, 23(3):476-480.
41. Goyal SM, Gerba CP: Viradel method for detection of rotavirus from
seawater. J Virol Methods 1983, 7:279-285.
42. Sobsey MD, Glass JS: Poliovirus concentration from tap water with
electropositive adsorbent filters. Appl Environ Microbiol 1980,
40(2):201-210.
43. Polaczyk AL, Roberts JM, Hill VR: Evaluation of 1 MDS electropositive
microfilters for simultaneous recovery of multiple microbe classes from
tap water. J Microbiol Methods 2007, 68(2):260-266.
44. Devold M, Krossøy B, Aspehaug V, Nylund A: Use of RT-PCR for diagnosis
of infectious salmon anaemia virus (ISAV) in carrier sea trout Salmo
trutta after experimental infection. Dis Aquat Organ
2000, 40(1):9-18.
45. Andersen L, Bratland A, Hodneland K, Nylund A: Tissue tropism of
salmonid alphaviruses (subtypes SAV1 and SAV3) in experimentally
challenged Atlantic salmon (Salmo salar L.). Arch Virol 2007,
152(10):1871-83.
46. Olsvik PA, Lie KK, Jordal AE, Nilsen TO, Hordvik I: Evaluation of potential
reference genes in real-time RT-PCR studies of Atlantic salmon. BMC Mol
Biol 2005, 17;6:21.
47. Müller PY, Janovjak H, Miserez AR, Dobbie Z: Processing of gene
expression data generated by quantitative real-time RT-PCR.
Biotechniques 2002, 32(6):1372-4, 1376, 1378-9.
48. Wendelaar Bonga SE: The stress response in fish. Physiol Rev 1997,
77(3):591-625.
49. Weyts FAA, Cohen N, Flik G, Verburg-van Kemenade BML: Interactions
between the immune system and the hypothalamo-pituitary-interrenal
axis in fish. Fish Shellfish Immunol 1999, 9(1):1-20.
50. Rønneseth A, Pettersen EF, Wergeland HI: Neutrophils and B-cells in blood
and head kidney of Atlantic salmon (Salmo salar L.) challenged with
infectious pancreatic necrosis virus (IPNV). Fish Shellfish Immunol 2006,
20(4):610-620.
51. Ferguson HW, Roberts RJ, Richards H, Collins RO, Rice DA: Severe
degenerative cardiomyopathy associated with pancreas disease in
Atlantic salmon, Salmo salar L. J Fish Dis 1986, 20:95-98.
52. Rodger HM, Murphy TM, Drinan EM, Rice D: Acute skeletal myopathy in
farmed Atlantic salmon, Salmo salar. Dis Aquat Organ 1991, 12:17-23.
53. Houghton G, Ellis AE: Pancreas disease in Atlantic salmon: serum
neutralisation and passive immunisation. Fish Shellfish Immunol 1996,
6:465-472.
54. Graham DA, Fringuelli E, Wilson C, Rowley HM, Brown A, Rodger H,
McLoughlin MF, McManus C, Casey E, McCarthy LJ, Ruane NM: Prospective
longitudinal studies on salmonid alphavirus infections on two Atlantic
salmon farms in Ireland; evidence for viral persistence. J Fish Dis 2010,
33(2):123-35.
55. Nylund A, Plarre H, Hodneland K, Devold M, Aspehaug V, Aarseth M,
Koren C, Watanabe K: Haemorrhagic smolt syndrome (HSS) in Norway:
pathology and associated virus-like particles. Dis Aquat Organ 2003,
54:15-27.
56. Bratland A, Nylund A: Studies on the possibility of vertical transmission of
Norwegian salmonid alphavirus in production of Atlantic salmon in
Norway. J Aquat Anim Health 2009, 21(3):173-178.
57. Houghton G: Kinetics of infection of plasma, blood leucocytes and
lymphoid tissue from Atlantic salmon Salmo salar experimentally
infected with pancreas disease.
Dis Aquat Organ 1995, 22:193-198.
doi:10.1186/1743-422X-7-198
Cite this article as: Andersen et al.: No influence of oxygen levels on
pathogenesis and virus shedding in Salmonid alphavirus (SAV)-
challenged Atlantic salmon (Salmo salar L.). Virology Journal 2010 7:198.
Submit your next manuscript to BioMed Central
and take full advantage of:
• Convenient online submission
• Thorough peer review
• No space constraints or color figure charges
• Immediate publication on acceptance
• Inclusion in PubMed, CAS, Scopus and Google Scholar
• Research which is freely available for redistribution
Submit your manuscript at
www.biomedcentral.com/submit
Andersen et al. Virology Journal 2010, 7:198
/>Page 14 of 14