Báo cáo khoa học:" Evolution of the M gene of the influenza A virus in different host species: large-scale sequence analysis" pptx
Bạn đang xem bản rút gọn của tài liệu. Xem và tải ngay bản đầy đủ của tài liệu tại đây (1020.24 KB, 13 trang )
BioMed Central
Page 1 of 13
(page number not for citation purposes)
Virology Journal
Open Access
Research
Evolution of the M gene of the influenza A virus in different host
species: large-scale sequence analysis
Yuki Furuse, Akira Suzuki, Taro Kamigaki and Hitoshi Oshitani*
Address: Department of Virology, Tohoku University Graduate School of Medicine, 2-1 Seiryou-machi Aoba-ku, Sendai, Japan
Email: Yuki Furuse - ; Akira Suzuki - ;
Taro Kamigaki - ; Hitoshi Oshitani* -
* Corresponding author
Abstract
Background: Influenza A virus infects not only humans, but also other species including avian and
swine. If a novel influenza A subtype acquires the ability to spread between humans efficiently, it
could cause the next pandemic. Therefore it is necessary to understand the evolutionary processes
of influenza A viruses in various hosts in order to gain better knowledge about the emergence of
pandemic virus. The virus has segmented RNA genome and 7th segment, M gene, encodes 2
proteins. M1 is a matrix protein and M2 is a membrane protein. The M gene may be involved in
determining host tropism. Besides, novel vaccines targeting M1 or M2 protein to confer cross
subtype protection have been under development. We conducted the present study to investigate
the evolution of the M gene by analyzing its sequence in different species.
Results: Phylogenetic tree revealed host-specific lineages and evolution rates were different
among species. Selective pressure on M2 was stronger than that on M1. Selective pressure on M1
for human influenza was stronger than that for avian influenza, as well as M2. Site-by-site analyses
identified one site (amino acid position 219) in M1 as positively selected in human. Positions 115
and 121 in M1, at which consensus amino acids were different between human and avian, were
under negative selection in both hosts. As to M2, 10 sites were under positive selection in human.
Seven sites locate in extracellular domain. That might be due to host's immune pressure. One site
(position 27) positively selected in transmembrane domain is known to be associated with drug
resistance. And, two sites (positions 57 and 89) locate in cytoplasmic domain. The sites are involved
in several functions.
Conclusion: The M gene of influenza A virus has evolved independently, under different selective
pressure on M1 and M2 among different hosts. We found potentially important sites that may be
related to host tropism and immune responses. These sites may be important for evolutional
process in different hosts and host adaptation.
Background
The influenza virus is a common cause of respiratory
infection all over the world. The influenza A virus can
infect not only humans but also avian, swine, and equine
species. The virus has a negative single-stranded RNA with
eight gene segments, namely PB2, PB1, PA, HA, NP, NA,
M, and NS. The subtype of influenza A virus is determined
by the antigenicity of two surface glycoproteins, hemaglu-
Published: 29 May 2009
Virology Journal 2009, 6:67 doi:10.1186/1743-422X-6-67
Received: 15 April 2009
Accepted: 29 May 2009
This article is available from: />© 2009 Furuse et al; licensee BioMed Central Ltd.
This is an Open Access article distributed under the terms of the Creative Commons Attribution License ( />),
which permits unrestricted use, distribution, and reproduction in any medium, provided the original work is properly cited.
Virology Journal 2009, 6:67 />Page 2 of 13
(page number not for citation purposes)
tinin (HA) and neuraminidase (NA). The subtypes cur-
rently circulating in the human population are H1N1 and
H3N2. Influenza A viruses cause epidemics and pandem-
ics by antigenic drift and antigenic shift, respectively [1].
Antigenic drift is an accumulation of point mutations
leading minor and gradual antigenic changes. Antigenic
shift involves major antigenic changes by introduction of
new HA and/or NA subtype into human population.
All known HA and NA subtypes are maintained in avian
species, and all mammalian influenza A viruses are
thought to be derived from the avian influenza A virus
pool [1]. In avian species, influenza A viruses are in an
evolutionary stasis [1]. In contrast, all gene segments of
mammalian viruses continue to accumulate amino acid
substitutions [1]. Today, the emergence of an influenza
pandemic is of great global concern. If a novel influenza A
subtype acquires the ability to spread between humans
efficiently, it could cause the next pandemic [1]. This abil-
ity is acquired by reassortment between human and non-
human influenza A viruses or by the accumulation of
mutations in the non-human influenza virus. It is neces-
sary to understand the evolutionary processes of influenza
A viruses in various hosts so that we have better knowl-
edge about the emergence of this pandemic virus. We con-
ducted the present study to investigate the evolution of
the M gene among different species. Although there are
numerous studies on the evolution of the HA gene [2-7],
only a few studies on the evolution of the M gene have
been conducted [8].
The M gene is intriguing because it encodes both matrix
and membrane proteins, and has multiple functions. The
M gene (1027 bps) encodes two proteins, namely M1 (at
nucleotide position 26 to 784) and M2 (at nucleotide
position 26 to 51 and 740 to 1007) [9]. M1 is a matrix
protein that lies just beneath the viral envelope in the
form of dimers and interacts with viral ribonucleoprotein
(vRNP) complex, forming a bridge between the inner core
components and the membrane proteins [10-13]. vRNPs
harbor the determinants for host range [1,14,15]. M1 con-
tacts with both viral RNA and NP, promoting the forma-
tion of RNP complexes and causing the dissociation of
RNP from the nuclear matrix [16-21]. M1 plays a vital role
in assembly by recruiting the viral components to the site
of assembly and essential role in the budding process
including formation of viral particles [22,23]. M2 is a
membrane protein which is inserted into the viral enve-
lope and projects from the surface of the virus as tetramers
[24,25]. The M2 protein comprises 97 amino acids – 24 in
the extracellular domain, 19 in the transmembrane
domain, and 54 in the cytoplasmic domain. Extracellular
domain of M2 is recognized by hosts' immune system
[26-28]. Transmembrane domain of M2 has ion channel
activity, which involved in uncoating process of the virus
in cell [29]. Amantadine inhibits virus replication by
blocking the acid-activated ion channel. The cytoplasmic
domain of M2 interacts with M1 and is required for
genome packaging and formation of virus particles [30-
36].
The molecular mechanism of how the host range of influ-
enza A viruses is determined is still not fully understood.
The M gene may be involved in determining host tropism.
Besides, novel vaccines targeting M1 or M2 proteins to
confer cross-subtype protection have been shown to be
promising [37-43]. Therefore, understanding of evolution
of the M gene is of great importance and practical rele-
vance.
Results
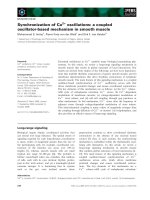
Phylogenetic Tree
The phylogenetic trees for the M gene of all the sequence
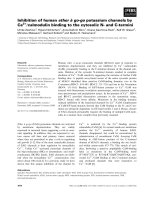
data we analyzed are shown in Figure 1. We defined "lin-
eage" as an aggregate of large branches. The phylogenetic
analysis revealed seven host-specific lineages: 1) human
lineage (Hu1) consisting of H1N1 between 1918 and
1954 (Spanish Flu and its progeny viruses), H2N2
between 1957 and 1967 (Asian Flu and its progeny
viruses), and H3N2 (Hong Kong Flu and its progeny
viruses) after 1968; 2) another human lineage (Hu2) con-
sisting of H1N1 (Russian Flu) after 1977; 3) avian lineage
(Av1) including viruses mainly from Asia but also from
other regions; 4) another avian lineage (Av 2) including
viruses mostly from North America; 5) swine lineage
(Sw1), located between human and avian lineages,
mainly from North America; 6) another swine lineage
(Sw2) diverging from Av1 and consisting of swine viruses
after 1980, mainly from Europe; and 7) canine/equine
lineage (CE) diverging from the root of Av2.
The M gene of all known human influenza A viruses, i.e.,
H1N1 between 1918 and 1957, H2N2 between 1957 and
1968, H3N2 after 1968, and H1N1 after 1977 was derived
from that of the 1918 Spanish Flu. One lineage (Hu1)
included three different subtypes (H1N1 between 1918
and 1957, H2N2 between 1957 and 1968, and H3N2
after 1968), which means that the same M gene was main-
tained in human influenza even after two antigenic shifts
in 1957 and 1968. Another lineage (Hu2) included H1N1
after 1977. This M gene was also derived from Spanish
Flu, but underwent different evolutionary processes and
formed another lineage. Since H1N1 re-emerged in 1977
as Russian Flu, the two subtypes (H1N1 and H3N2) have
been co-circulating in human populations and have
formed two distinct lineages (Hu1 and Hu2). However,
Hu2 exclusively includes H1N1 viruses and all human
H3N2 are included in Hu1 (Figure 1B). On the other
hand, both avian influenza lineages (Av1 and Av2) did
not show any subtype specificity, and included many dif-
Virology Journal 2009, 6:67 />Page 3 of 13
(page number not for citation purposes)
ferent subtypes (Figure 1A and 1B). In avian lineages, even
small branches of the phylogenetic tree are shared by dif-
ferent subtypes.
Although strains with the M gene in both avian lineages
(Av1 and Av2) have been seen sporadically in humans,
they have not been maintained in the population (blue
characters in Av1 and Av2, Figure 1A and 1F). Strains with
the M gene in swine lineages also infect humans, but these
swine viruses have not been established in human popu-
lations (blue characters in Sw1 and Sw2, Figure 1A and
1F). All H5N1 viruses that infected humans as well as the
H5N1 virus that infected swine possessed share the M
gene of the avian influenza lineage (Av1, (Figure 1E).
Evolutionary Rate
For evolutionary rate analysis, we included the sequences
of only host-specific lineages and excluded other
sequences such as those of the H5N1 influenza in humans
(Figure 1F. See "Materials and methods"). The profile of
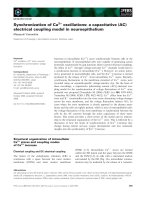
the sequences analyzed is shown in Table 1. Evolutionary
rates were estimated for each lineage (Figure 2).
Av2 of avian influenza A viruses showed the slowest evo-
lutionary rate (1.63 × 10
-4
substitutions per site per year).
All human and swine Influenza A viruses had a signifi-
cantly faster evolutionary rate than avian viruses (Table
2). In addition, evolutionary rates were significantly dif-
ferent even between lineages of same host. Hu2 has
evolved more rapidly than Hu1, and Sw2 has evolved
more rapidly than Sw1 (Figure 2 and Table 2).
Selective Pressures
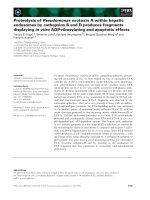
The selective pressures for the entire sequence (we defined
the magnitude of the pressure as "ω") were 0.13 for the
entire coding region of the M gene, 0.06 for M1, and 0.45
for M2 (Figure 3). A higher selective pressure indicates
that the gene (or the site) is under stronger selection (pos-
itive selection) for amino acid substitution. Lower selec-
tive pressure indicates that the gene (or the site) is under
stronger negative selection to retain the same amino
acid(s) because changes may lead to incompetence or
abortion [44,45]. Selective pressure was statistically
stronger in M2 than that in M1 for all hosts.
ω of the entire coding region of the M gene for human and
swine influenza was significantly higher (no overlap of
95% confidence intervals) than that for the avian influ-
enza (Figure 3). ω for both M1 and M2 of human influ-
enza are also significantly larger than that for avian
influenza (Figure 3).
Phylogenetic trees for the M geneFigure 1
Phylogenetic trees for the M gene. Figures shows phylogenetic trees constructed using RAxML. Scale bar shows evolu-
tionary distance inferred by RAxML algorithm. Trees are shaded in colors according to host (A), subtype (B), year (C), geo-
graphical location (D), and H5N1 (E). To compare evolutionary characteristics such as evolution rate and selective pressure,
we named each lineage as shown in (F).
Virology Journal 2009, 6:67 />Page 4 of 13
(page number not for citation purposes)
Site-by-site Analyses
Site-by-site (by each codon) analyses for human influenza
were conducted by SLAC (the entire tree [eSLAC], internal
branches [iSLAC], and terminal branches [tSLAC]), and
FEL (the entire tree [eFEL] and internal branches [iFEL])
methods [45]. We conducted the analyses by testing
hypotheses for the entire tree, internal branches, and ter-
minal branches (See "Materials and methods").
"dN/dS" indicates the magnitude of selective pressure on
each codon. When dN/dS on a certain codon is signifi-
cantly greater than 1, the site is considered to be under sig-
nificant positive selection. When dN/dS on a certain
codon is significantly smaller than 1, the site is considered
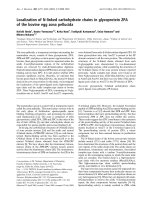
to be under significant negative selection. Figure 4 shows
P-values calculated by eSLAC and eFEL for each codon,
indicating negative or positive selection. eSLAC and eFEL
gave similar results. The sites under significant negative
selection for human influenza were found in 159 out of
252 codons (63.1%) in M1 and 26 out of 97 (26.8%) in
M2. Only one codon (0.4%) in M1 and eight codons
(8.2%) in M2 were under significant positive selection by
eFEL for human influenza. The sites under positive selec-
tion identified by at least one test are listed in Table 3. The
site in M1 under significant positive selection was posi-
tion 219 (from here, "position" indicates the amino acid
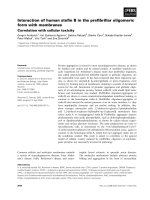
Evolutionary rateFigure 2
Evolutionary rate. Number of nucleotide substitutions compared to the oldest strain in each lineage is plotted. Evolutionary
rates are calculated from the slope of the tangent of a simple regression line (number of substitutions/site/year), for canine/
equine (A), swine (B), avian (C), and human (D). Correlation coefficient (r) was estimated using the Pearson correlation. Refer-
ence strains are A/chicken/Brescia/1902(H7N7) for Av1, A/turkey/Massachusetts/3740/1965(H6N2) for Av2, A/equine/Miami/
1/1963(H3N8) for CE, A/Brevig Mission/1/1918(H1N1) for Hu1 and Hu2, A/swine/Iowa/15/1930(H1N1) for Sw1, and A/swine/
Netherlands/25/80(H1N1) for Sw2. Mean and 95% confidence interval (shown in parentheses) are calculated by SPSS.
Table 1: Profile of sequences analyzed for selective pressure
Host Total number Number after excluding identical sequences Year Mean diversity
All hosts 5060 3011 1902 – 2008 0.100
Human 2763 1217 1918 – 2008 0.050
Avian 2009 1492 1902 – 2008 0.077
Swine 201 123 1930 – 2006 0.069
Canine/Equine 87 53 1963 – 2005 0.015
Virology Journal 2009, 6:67 />Page 5 of 13
(page number not for citation purposes)
position, i.e., the codon). Figure 5 shows that this site is
located at the edge of the structure and is a part of a T-cell
and MHC cell epitope. Of ten sites positively selected in
M2, seven sites are in the extracellular domain (positions
11, 12, 13, 14, 16, 21, and 23), one site is in the trans-
membrane domain (position 27), and two sites in the
cytoplasmic domain (positions 57 and 89, Table 3).
To define the evolutionary difference for each codon in
human and avian influenza, we also calculated site-by-site
selective pressures for avian influenza by eFEL. Consensus
sequences of human and avian viruses were compared to
identify major differences between these two hosts. We
identified the sites at which consensus amino acids were
different between the human and avian viruses and
showed selective pressures (Figure 6 and Table 4). A sum-
mary of the site-by-site analyses including positive and
negative selection for human and avian influenza, and
differences in the consensus sequences are shown in Fig-
ure 7. Position 219 in M1, which is under significant pos-
itive selection in the human virus, is under significant
negative selection in the avian virus. Positions 115 and
Table 2: Comparison of evolutionary rates among different hosts
Av1 Av2
a
within each host
Evolutionary rate (number of substitutions/site/year) 5.76 × 10
-4
1.63 × 10
-4
Hu1 7.34 × 10
-4
0.020 < 0.001
Hu2 12.8 × 10
-4
< 0.001 < 0.001 < 0.001
Sw1 9.23 × 10
-4
< 0.001 < 0.001
Sw2 18.4 × 10
-4
< 0.001 < 0.001 < 0.001
CE 5.40 × 10
-4
0.795 0.007
List of P-values for differential evolutionary rates.
a
P-values for lineages of same host: Hu1 vs. Hu2 and Sw1 vs. Sw2.
Bold values are those deemed to show significantly positive selection (P < 0.05).
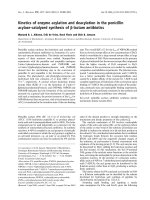
Selective pressure among hostsFigure 3
Selective pressure among hosts. Selective pressures for the entire sequence (ω) are calculated for the entire coding region
of the M gene, and separately for M1 and M2. Error bar shows 95% confidence interval.
Virology Journal 2009, 6:67 />Page 6 of 13
(page number not for citation purposes)
Table 3: Sites under positive selection for human influenza
Gene Domain
a
Position dN/dS
b
eSLAC iSLAC tSLAC eFEL iFEL
M1 219 inf
c
0.0048 0.22 0.022 0.0032 0.013
M2 Ex 11 inf 0.074 0.23 0.33 0.017 0.0055
Ex 12 inf 0.0068 0.32 0.022 0.0026 0.024
Ex 13 inf 0.020 0.55 0.036 0.0025 0.064
Ex 14 inf 0.069 0.37 0.19 0.019 0.025
Ex 16 6.18 0.015 0.027 0.27 0.021 0.0017
Ex 21 inf 0.071 0.37 0.19 0.036 0.040
Ex 23 inf 0.052 0.27 0.19 0.037 0.024
Tm 27 4.42 0.054 0.59 0.039 0.082 0.20
Cy 57 3.62 0.21 0.16 0.57 0.050 0.024
Cy 89 inf 0.002 0.12 0.016 0.0023 0.0046
The significance of SLAC and FEL results for positive selection levels are given as P-values.
a
Ex indicates extracellular domain; Tr, transmembrane domain; and Cy, cytoplasmic domain.
b
dN/dS was calculated by eFEL.
c
"inf" means infinity as denominator is 0.
Bold values are those deemed to show significantly positive selection (P < 0.05).
Selection profile by eFEL and eSLACFigure 4
Selection profile by eFEL and eSLAC. Selection profiles of M1 (A) and M2 (B) are shown. The abscissa indicates the
codon position. The ordinate indicates the (1-p) value for each position, and is above or below the horizontal line when dN/dS
> 1 or dN/dS < 1, respectively. The horizontal lines represent 0.95, so that the positions where the bars cross the lines above
and below indicate the positively and negatively selcected sites, respectively. The results of eSLAC and eFEL are shown.
Virology Journal 2009, 6:67 />Page 7 of 13
(page number not for citation purposes)
121 in M1, which are under significant negative selection
in both human and avian viruses, have different consen-
sus amino acids between the hosts (Figure 7 and Table 4).
Discussion
The phylogenetic tree showed that the M gene of influ-
enza A viruses has evolved independently in each host. It
revealed host-specific lineages, which were compatible
with other reports. In previous reports, Av1, Av2, Sw1,
Sw2, and CE were named as Eurasian (Old World) avian,
North American (New World) avian, classic (old) swine,
European (avian-like) swine, and recent (avian-like)
canine lineages, respectively [1,8,46,47]. Since the emer-
gence of the Russian Flu, both H1N1 and H3N2 have
been co-circulating in human populations and undergo-
ing different evolutionary processes, which have resulted
in two distinct human influenza lineages, Hu1 and Hu2
(Figure 1A, B, and 1F). Although reassortment of human
influenza A viruses between the same subtype (intratypic
recombination) has occurred frequently [48-51], we
found only a few strains that seemed to be generated by
reassortment between H1N1 and H3N2 human influ-
enza, including H1N2 strains. These strains were not
maintained in human populations. When the H3N2 virus
with the M gene in Hu1 acquires the M gene from H1N1
in Hu2, such a virus might not replicate and/or transmit
effectively. On the other hand, M genes of avian influenza
are frequently shifted between subtypes as shown in Fig-
ure 1A and 1B. This suggests that reassortment between
subtypes (intertypic recombination) is common in avian
influenza. This result is compatible with the study by
Dugan et al., which showed a high rate of gene reassort-
ment among avian influenza A viruses [52]. It is still
unclear why the M gene of avian influenza is interchange-
able among subtypes, while the M gene of human influ-
enza is not. Further experiments in vitro are necessary to
answer this question.
After Spanish Flu, the same M gene has been maintained
in human influenza, even after two pandemics (Asian Flu
and Hong Kong Flu) that were thought to have been gen-
erated by reassortment between avian and human influ-
enza A viruses [1] (Figure 1A and 1C). In the phylogenetic
tree (Figure 1A), Spanish Flu is located at the root of a
human lineage and close to a swine lineage; there is a
greater distance between Spanish Flu and the avian influ-
enza A viruses identified around 1918. This result sup-
ports the hypothesis that an ancestral virus of Spanish Flu
had entered the mammalian population before 1918
[53,54]. It remains to be seen whether this M gene will be
retained after further pandemics. It was shown that the M
gene of recent human influenza cannot incorporate the
HA segment of avian influenza in vitro [55].
3D crystral structure of M1Figure 5
3D crystral structure of M1. The figure was generated
using BioHealthBase. M1 is identified as dimers. Site at posi-
tion 219 (yellow circles), which is under positive selection for
human influenza, is located at the edge of the structure.
Consensus sequenceFigure 6
Consensus sequence. Consensus amino acid sequences of human and avian influenza A virus are shown. The major variable
is defined as amino acid variants which are found in 10% or more strains. Different sites are shaded in red.
Virology Journal 2009, 6:67 />Page 8 of 13
(page number not for citation purposes)
There have been several sporadic infections with viruses
from non-human lineages to humans, including the
recent H5N1 infections in humans. However, these
viruses were not maintained, and therefore, they disap-
peared from the human population without efficient
transmission from human to human. In addition, it is
implied that swine can be a "mixing vessel" in which
human and avian viruses are reassorted to generate a
human pandemic strain [1,56]. However, infections of
strains with avian or human M genes in swine were also
rare, and most of these viruses were not maintained in the
swine population, except for the Sw2 lineage, in which
viruses with the avian lineage M gene became established
in the swine population.
Our phylogenetic analysis showed that viruses were clus-
tered in host-specific lineages. This suggests that the M
gene may be host specific and viruses with an M gene from
other hosts are difficult to replicate. It is possible that the
M gene determines the host range through the interaction
between M1 and vRNPs [13,14,57]. An M gene that can
match with host-specific vRNPs may be needed to repli-
cate and transmit in a certain host. In addition, many
studies have shown the interaction between M1 protein
and host proteins, such as RACK1, MAPK, and core his-
tone [13,58-60]. The M gene may be directly and/or indi-
rectly linked to host tropism of the virus.
The evolutionary rate of the M gene was low in avian
viruses compared to human and swine viruses (Figure 2
and Table 2). This result is rational because birds are con-
sidered to be a natural host for the influenza A virus [1].
The avian influenza A virus may have already been
adapted to the host and not subject to pressure to induce
further amino acid changes. This is also supported by the
result showing that ω of the M gene was the lowest in
avian influenza (Figure 3). Additional amino acid changes
might be required in mammalian hosts to allow the
viruses to adapt to these relatively new hosts. This stronger
selective pressure on human and swine influenza may
make human and swine influenza evolve more rapidly
than avian influenza (Figures 2 and 3).
Interestingly, evolutionary rates were significantly differ-
ent between lineages of the same host (Table 2). The evo-
Summary of site-by-site analysesFigure 7
Summary of site-by-site analyses. The figure shows the positive or negative selection in human and avian influenza, and dif-
ferences in consensus sequences between the hosts. Amino acid positions under positive and negative selection are shaded in
red and blue, respectively. Sites under significant positive and negative selection are shaded in dark colors, while light colors
indicate no significance. Triangles indicate sites where the consensus amino acids are different between human and avian influ-
enza.
Table 4: Selective pressure on different sites between human
and avian influenza
Human Avian
Gene Domain
a
Position dN/dS
b
P-value dN/dS P-value
M1 115 0.07 0.0031 0.06 < 0.001
121 0.11 0.039 0.07 < 0.001
137 0.69 0.61 0.03 < 0.001
M2 ex 11 inf
c
0.017 inf < 0.001
ex 16 6.18 0.021 5.06 0.044
ex 20 Inf 0.094 inf < 0.001
cy 54 1.36 0.50 0.50 0.12
cy 57 3.62 0.050 inf 0.12
cy 78 0.74 0.68
0.26 0.086
cy 86 3.47 0.16 0.64 0.64
cy 93 1.27 0.71 inf 0.067
a
Ex indicates extracellular domain; Tr, transmembrane domain; and
Cy, cytoplasmic domain.
b
dN/dS was calculated by eFEL.
c
"inf" means infinity as denominator is 0.
Significance of the FEL test for positive selection levels is given as P-
values, and underlined values indicate P-values for negative selection.
Bold values are those deemed to indicate significantly positive or
negative selection (P < 0.05).
Virology Journal 2009, 6:67 />Page 9 of 13
(page number not for citation purposes)
lutionary rates of Hu2 and Sw2 were faster than Hu1 and
Sw1, respectively. The evolution of the M gene might not
only be controlled by host species. One possible explana-
tion is that strains in a lineage that appeared more recently
such as Hu2 or Sw2, have to evolve more rapidly in order
to be adapted better to the host than strains in other pre-
existing lineages (Hu1 or Sw1), which have already
adapted to some extent. Social factors at the time when
new lineages appeared such as the growth of the popula-
tion and globalization may also facilitate a faster evolu-
tion. This may be the reason why the evolutionary rates of
Hu2 and Sw2 are higher than those of Hu1 and Sw1,
respectively (Figure 2). However, reason of difference
between evolutionary rates of Av1 and Av2 is unclear.
The selective pressure is stronger in M2 than in M1 (Figure
3) and more sites under positive selection were identified
in M2 than in M1 (Table 3 and Figure 7). Among them,
most of the sites (7 out of 10) under positive selection in
M2 are located in the extracellular domain (Table 3 and
Figure 7). Infection of influenza A virus induces the host's
immune response to M2, especially to the extracellular
domain [26-28]. It has been shown that antibodies recog-
nizing the extracellular domain including the sites under
positive selection confer protective immunity [37-39].
The host's immune response may make stronger selective
pressure on M2 than that on M1. However, of course,
selective pressure is much higher in the HA segment, the
major antigenic component, than in the M2 gene [61],
and this M2 gene is thus more conserved than the HA
gene [42].
M1 is thought to play a vital role in the assembly and bud-
ding process [12,22,23]. Even minor mutations in M1
may cause a critical deficiency in virus replication. This
could also explain why M1 is under strong negative pres-
sure and why the selective pressure on M1 is smaller than
that on M2 (Figure 3). Nevertheless, the selective pressure
on M1 of the human influenza was stronger than that of
the avian influenza (Figure 3). M1 of human influenza
should be under stronger selective pressure than that of
avian influenza to be better adapted.
Position 219 in M1 is under positive selection in human
influenza. It was also reported that this site was positively
selected using a different method of calculation [62].
However, this site is under negative selection in avian
influenza (Figure 7). M1 is recognized by cytotoxic T cells
[40,63,64] and the C-terminal of M1 determines anti-
genicity [65,66]. The site, located at the edge of structure
(Figure 5), is part of the T-cell and MHC epitope. M1 may
also be under selective pressure from the host's immune
response, although this is weaker than M2. Besides, the C-
terminal of M1 is important for binding to vRNPs [16].
This site might play an important role in the interaction
with vRNPs, being associated with host range. Therefore,
it is under positive selection only in the human and not in
avian influenza virus.
Positions 115 and 121 in M1, which are under significant
negative selection in both human and avian influenza,
had different consensus amino acids between these two
hosts (Figure 7). These results indicate that these sites may
be important for host tropism and are therefore under
negative selection. In addition, position 137 also has dif-
ferent consensus amino acids between the hosts, though
this site is not under significant negative selection in
human influenza (the site is under negative selection in
avian influenza). The two domains in M1 have been
reported to affect the disposition of viral RNA. One
domain resides in a palindromic stretch of basic amino
acids (position 101 to 105) [17,18] and the other domain
is located at position 148 to 162 containing a zinc finger
motif [19,20]. The three sites (positions 115, 121, and
137) are located between these two domains. These sites
might affect the disposition of viral RNA and be involved
in the determination of host range.
Position 27, which is a site in the transmembrane
domain, is positively selected in M2. This site is associated
with amantadine resistance [67]. The selective pressure on
the site may be due to drug pressure. However, we could
not show any positive pressure on position 31, which is
associated with the recent spread of amantadine resistance
[68]. Details on drug pressure and possible mechanism
for recent surge of amantadine-resistant strains will be
described in another manuscript (in preparation).
The cytoplasmic domain of M2 is important for interac-
tion with M1, genome packaging, and formation of virus
particles [33-36]. Two sites are under positive selection in
the cytoplasmic domain of M2 (positions 57 and 89,
Table 3). In particular, position 57 showed different con-
sensus amino acids between human and avian influenza
(Figure 7). These results indicate that the amino acids in
these sites have frequently changed, and these sites are
likely to be involved in several functions of M2. The M2
cytoplasmic tail (position 45 to 69) has been shown to be
a binding domain for M1 [35]. Position 82 to 89 is impor-
tant for infectious virus production [35]. Another study
showed that vRNP packaging is mediated by amino acids
at position 70 to 89 of the M2 gene [69]. The M2 gene
must, therefore, have evolved with several functions.
In conclusion, the M gene of the influenza A virus has
evolved with different selective pressures on M1 and M2
among different hosts. We found potentially important
sites that may be related to host tropism and immune
responses. These sites may be important for evolutionary
processes in different hosts and host adaptation. How-
Virology Journal 2009, 6:67 />Page 10 of 13
(page number not for citation purposes)
ever, Dunham et al. concluded that it is difficult to predict
what specific genetic changes are needed for mammalian
adaptation by comparing evolution of avian and swine
influenza A viruses [47]. Further studies to clarify the spe-
cific role of each site identified in the present study are
needed.
Methods
Sequence Data
All data were obtained from the influenza sequence data-
base (Influenza Virus Resource on: http://
www.ncbi.nlm.nih.gov/genomes/FLU/FLU.html,
accessed on July 21, 2008) [70]. All sequencing data for
the strains with a full-length M gene of any subtypes of
influenza A from different host species including avian,
canine, equine, human, and swine were included.
Sequences derived from laboratory strains and duplicate
strains verified by the strain name were excluded. A total
of 5489 sequences were obtained [accession numbers are
listed in additional file 1]. After excluding sequences con-
taining ambiguous nucleotides, minor insertions, minor
deletions (data for full length of coding region were used)
or premature termination codons, a total of 5060
sequences were used in the analysis. Sequencing data were
obtained together with information of the host, subtype,
isolation year, and isolation place. The sequencing num-
bers for the influenza of each host are listed in Table 1. A
multiple alignment of the nucleotide sequences, which
did not contain any gaps, was constructed using ClustalW.
Phylogenetic Tree Analysis
A phylogenetic tree was inferred by RAxML [71]. The
sequences data only for the coding region were used; i.e.,
at nucleotide position 26 to 1007. The basic sequential
algorithm of RAxML is described elsewhere [72]. RAxML
is one of the fastest and most accurate sequential phylog-
eny programs [73]. In this method, a rapid bootstrap
search is combined with a rapid maximum likelihood
search on the original alignment. The tree was constructed
using Web-servers, RAxML BlackBox: "http://phy
lobench.vital-it.ch/raxml-bb/" [71]. The tree is color-
coded according to hosts, subtypes, geographical informa-
tion, or temporal information using FigTree (ver.1.1.2).
Dataset of Influenza for Each Host
Datasets for each host (avian, canine/equine, human, and
swine hosts) were constructed. Sequences only from the
host-specific lineage in the phylogenetic tree were used.
For example, the H5N1 influenza A viruses that had
infected humans were excluded from the analyses because
humans were accidental hosts infected with the viruses of
an avian lineage. Identical nucleotide sequences in the
same dataset were removed before further analyses.
The number of base substitutions per site from an average
of all sequence pairs was calculated to define the diversity
of sequences in each dataset (Table 1) using the maximum
composite likelihood method in MEGA (ver. 4) [74].
Evolutionary Rate
The evolutionary rate of each lineage was calculated. To
calculate the rate, at least one sequence of each subtype in
each year was selected from each dataset. Evolutionary
rate was analyzed for the selected sequences as the
number of substitutions per site per year compared to the
oldest strain in each lineage with a linear regression
model. The significance of the correlations was estimated
using the Pearson correlation. Differential between slopes
of the tangent of simple regression lines were tested by
analysis of covariance. The analyses were conducted using
SPSS (ver.17).
Consensus Sequence
Consensus amino acid sequences were determined as the
sequence of amino acids that were identified most fre-
quently at each position in a dataset, for human and avian
influenza. Amino acid substitutions that were identified
in more than 10% of the strains were regarded as major
variants.
Evaluation of Pressure (
ω
)
Phylogenetic trees for each dataset by hosts were con-
structed using the maximum-likelihood method imple-
mented in PhyML-aLRT [75] with the GTR model (four
rate categories, all parameters estimated from the data).
Selective pressure for each host population was calculated
using the trees. Selective pressure was analyzed by HyPhy
[76]. All analyses in HyPhy were conducted after identify-
ing the best fit model from every possible time-reversible
model (e.g., F81 and HKY85) according to Akaike's infor-
mation criterion [45,77].
Global estimates (ω) of relative rates of non-synonymous
(dN) and synonymous (dS) substitutions averaged over
the entire alignment were compared to calculate the over-
all strength of selection [45].
Site-by-site Selective Pressure (dN/dS)
Positive selection sites for human influenza were detected
using two methods: single likelihood ancestor counting
(SLAC) and fixed-effects likelihood (FEL). FEL was also
conducted for avian influenza. The relative rates of non-
synonymous and synonymous substitutions were com-
pared. Sites where dN/dS > 1 and dN/dS < 1 were inferred
as positively and negatively selected, respectively. The
details of the two methods is described elsewhere
[45,78,79]. It was shown that many recent non-synony-
mous substitutions, i.e., those in the terminal branches of
Virology Journal 2009, 6:67 />Page 11 of 13
(page number not for citation purposes)
the tree, were not represented on internal branches [80].
At codons where internal substitutions are seen, the
strength of selection along the terminal branches is high.
Analyses were conducted exclusively by testing hypothe-
ses for the entire tree, internal branches, and terminal
branches.
Briefly, in the SLAC method, the nucleotide and codon
model parameter estimates are used to reconstruct the
ancestral codon sequences at the internal nodes of the
tree. The single most likely ancestral sequences are then
fixed as known variables, and applied to infer the expected
number of non-synonymous or synonymous substitu-
tions that have occurred along each branch, for each
codon position. SLAC is a substantially modified and
improved derivative of the Suzuki-Gojobori method [44].
The FEL method is based on maximum-likelihood esti-
mates. The FEL method estimates the ratio of non-synon-
ymous to synonymous substitutions on a site-by-site basis
for the entire tree (eFEL) or only the interior branches
(iFEL). iFEL is essentially the same as eFEL, except that
selection is only tested along the internal branches of the
phylogeny [80].
Uniprot (" />") and BioHealthBase
(" />orator=influenza") were used to generate 3D crystal struc-
tures and to determine the location of epitope sites. Acces-
sion numbers: [GeneBank protein GI 89779323
, strain A/
Puerto Rico/8/34, PDB ID 1AA7
, GeneBank sequence
accession CY009445
].
In the present study, we used a newly developed softwares
RAxML [71] and HyPhy [76] for phylogenetic analyses.
Markov Chain Monte Carlo (MCMC) and PhyML are
widely used and are considered useful for manipulating
data sets (hundreds) [2,81-84]. However, they cannot
process huge data sets in order of thousands on an ordi-
nary desktop computer. Therefore, we used a PC with
Windows operating system and 3 GB RAM). PAML, which
is a common software package for phylogenetic analyses
such as the calculation of selective pressure using maxi-
mum likelihood [85], also failed occasionaly in analyzing
large data sets. We therefore used the recently developed
software, which overcomes these problems. The accuracy
of this software has been confirmed [73,79,86]. Through
site-by-site analyses, we identified more sites negatively or
positively selected than those in a study by Suzuki [61].
This was ascribed to a difference in the number of data sets
and/or algorithms, as we analyzed ten times more than
the number analyzed in his study.
List of abbreviations
vRNP: viral ribonucleoprotein.
Competing interests
The authors declare that they have no competing interests.
Authors' contributions
YF carried out all analyses and drafted the manuscript. AS,
TK, and HO participated in the design of the study and
helped to draft the manuscript. All authors have read and
approved the final manuscript.
Additional material
Acknowledgements
We are indebted to Dr. Jianzhi George Zhang (University of Michigan, USA)
and Dr. Sergei L. Kosakovsky Pond (University of California, San Diego,
USA) for their kind advice regarding the analyses. Financial support for this
study was provided by Health Labor Sciences Research Grant 20-005-OH
from The Ministry of Health, Labor, and Welfare, Japan.
References
1. Webster RG, Bean WJ, Gorman OT, Chambers TM, Kawaoka Y:
Evolution and ecology of influenza A viruses. Microbiological
Reviews 1992, 56:152-179.
2. Zhang W, Jiang Q, Chen Y: Evolution and variation of the H3
gene of influenza A virus and interaction among hosts. Inter-
virology 2007, 50:287-295.
3. Bush RM, Fitch WM, Bender CA, Cox NJ: Positive selection on
the H3 hemagglutinin gene of human influenza virus A. Mol
Biol Evol. 1999, 16(11):1457-1465.
4. Fouchier RAM, Munster V, Wallensten A, Bestebroer TM, Herfst S,
Smith D, Rimmelzwaan GF, Olsen B, Osterhaus ADME: Character-
ization of a novel influenza A virus hemagglutinin subtype
(H16) obtained from black-headed gulls. Journal of Virology
2005, 79:2814-2822.
5. Bean WJ, Schell M, Katz J, Kawaoka Y, Naeve C, Gorman O, Webster
RG: Evolution of the H3 influenza virus hemagglutinin from
human and nonhuman hosts. Journal of Virology 1992,
66:1129-1138.
6. Fitch WM, Leiter JM, Li XQ, Palese P: Positive Darwinian evolu-
tion in human influenza A viruses. Proceedings of the National
Academy of Sciences of the United States of America 1991,
88:4270-4274.
7. Shih AC-C, Hsiao T-C, Ho M-S, Li W-H: Simultaneous amino acid
substitutions at antigenic sites drive influenza A hemaggluti-
nin evolution. Proceedings of the National Academy of Sciences of the
United States of America 2007, 104:6283-6288.
8. Ito T, Gorman OT, Kawaoka Y, Bean WJ, Webster RG: Evolution-
ary analysis of the influenza A virus M gene with comparison
of the M1 and M2 proteins. Journal of Virology 1991, 65:5491-5498.
9. Lamb RA, Lai CJ, Choppin PW: Sequences of mRNAs derived
from genome RNA segment 7 of influenza virus: colinear
and interrupted mRNAs code for overlapping proteins. Pro-
ceedings of the National Academy of Sciences of the United States of Amer-
ica 1981, 78:4170-4174.
10. Nayak DP, Hui EK-W, Barman S: Assembly and budding of influ-
enza virus. Virus Research 2004, 106:147-165.
11. Schmitt AP, Lamb RA: Influenza virus assembly and budding at
the viral budozone. Advances in Virus Research 2005, 64:383-416.
Additional file 1
List of accession numbers. The file contains list of accession numbers of
sequencing data we analyzed.
Click here for file
[ />422X-6-67-S1.txt]
Virology Journal 2009, 6:67 />Page 12 of 13
(page number not for citation purposes)
12. Cros JF, Palese P: Trafficking of viral genomic RNA into and
out of the nucleus: influenza, Thogoto and Borna disease
viruses. Virus Research 2003, 95:3-12.
13. Garcia-Robles I, Akarsu H, Muller CW, Ruigrok RWH, Baudin F:
Interaction of influenza virus proteins with nucleosomes.
Virology 2005, 332:329-336.
14. Naffakh N, Tomoiu A, Rameix-Welti M-A, Werf S van der: Host
restriction of avian influenza viruses at the level of the ribo-
nucleoproteins. Annual Review of Microbiology 2008, 62:403-424.
15. Almond JW: A single gene determines the host range of influ-
enza virus. Nature 1977, 270:617-618.
16. Baudin F, Petit I, Weissenhorn W, Ruigrok RW: In vitro dissection
of the membrane and RNP binding activities of influenza
virus M1 protein. Virology 2001, 281:102-108.
17. Elster C, Larsen K, Gagnon J, Ruigrok RW, Baudin F: Influenza virus
M1 protein binds to RNA through its nuclear localization sig-
nal. Journal of General Virology 1997, 78:1589-1596.
18. Wakefield L, Brownlee GG: RNA-binding properties of influ-
enza A virus matrix protein M1. Nucleic Acids Research 1989,
17:8569-8580.
19. Elster C, Fourest E, Baudin F, Larsen K, Cusack S, Ruigrok RW: A
small percentage of influenza virus M1 protein contains zinc
but zinc does not influence in vitro M1-RNA interaction. Jour-
nal of General Virology 1994, 75:37-42.
20. Nasser EH, Judd AK, Sanchez A, Anastasiou D, Bucher DJ: Antiviral
activity of influenza virus M1 zinc finger peptides. Journal of
Virology 1996, 70:8639-8644.
21. Ye Z, Liu T, Offringa DP, McInnis J, Levandowski RA: Association of
influenza virus matrix protein with ribonucleoproteins. Jour-
nal of Virology 1999, 73:7467-7473.
22. Gomez-Puertas P, Albo C, Perez-Pastrana E, Vivo A, Portela A: Influ-
enza virus matrix protein is the major driving force in virus
budding.
Journal of Virology 2000, 74:11538-11547.
23. Latham T, Galarza JM: Formation of wild-type and chimeric
influenza virus-like particles following simultaneous expres-
sion of only four structural proteins. Journal of Virology 2001,
75:6154-6165.
24. Lamb RA, Zebedee SL, Richardson CD: Influenza virus M2 protein
is an integral membrane protein expressed on the infected-
cell surface. Cell 1985, 40:627-633.
25. Holsinger LJ, Lamb RA: Influenza virus M2 integral membrane
protein is a homotetramer stabilized by formation of
disulfide bonds. Virology 1991, 183:32-43.
26. Gerhard W, Mozdzanowska K, Furchner M, Washko G, Maiese K:
Role of the B-cell response in recovery of mice from primary
influenza virus infection. Immunological Reviews 1997, 159:95-103.
27. Potter CW, Oxford JS: Determinants of immunity to influenza
infection in man. British Medical Bulletin 1979, 35:69-75.
28. Treanor JJ, Tierney EL, Zebedee SL, Lamb RA, Murphy BR: Passively
transferred monoclonal antibody to the M2 protein inhibits
influenza A virus replication in mice. Journal of Virology 1990,
64:1375-1377.
29. Pinto LH, Holsinger LJ, Lamb RA: Influenza virus M2 protein has
ion channel activity. Cell 1992, 69:517-528.
30. Zebedee SL, Lamb RA: Growth restriction of influenza A virus
by M2 protein antibody is genetically linked to the M1 pro-
tein. Proceedings of the National Academy of Sciences of the United
States of America 1989, 86:1061-1065.
31. Hughey PG, Roberts PC, Holsinger LJ, Zebedee SL, Lamb RA, Com-
pans RW: Effects of antibody to the influenza A virus M2 pro-
tein on M2 surface expression and virus assembly. Virology
1995, 212:411-421.
32. Schroeder C, Heider H, Moncke-Buchner E, Lin T-I: The influenza
virus ion channel and maturation cofactor M2 is a choles-
terol-binding protein. European Biophysics Journal 2005, 34:52-66.
33. Chen BJ, Leser GP, Jackson D, Lamb RA: The influenza virus M2
protein cytoplasmic tail interacts with the m1 protein and
influences virus assembly at the site of virus budding. Journal
of Virology 2008, 82:10059-10070.
34. Castrucci MR, Kawaoka Y: Reverse genetics system for genera-
tion of an influenza A virus mutant containing a deletion of
the carboxyl-terminal residue of M2 protein. Journal of Virology
1995, 69:2725-2728.
35. McCown MF, Pekosz A: Distinct domains of the influenza a
virus M2 protein cytoplasmic tail mediate binding to the M1
protein and facilitate infectious virus production. Journal of
Virology 2006, 80:8178-8189.
36. Ozawa M, Maeda J, Iwatsuki-Horimoto K, Watanabe S, Goto H, Hori-
moto T, Kawaoka Y: Nucleotide sequence requirements at the
5' end of the influenza A virus M RNA segment for efficient
virus replication. Journal of Virology 2009, 83:3384-3388.
37. Zharikova D, Mozdzanowska K, Feng J, Zhang M, Gerhard W: Influ-
enza type A virus escape mutants emerge in vivo in the pres-
ence of antibodies to the ectodomain of matrix protein 2.
Journal of Virology 2005, 79:6644-6654.
38. Liu W, Zou P, Chen Y-H: Monoclonal antibodies recognizing
EVETPIRN epitope of influenza A virus M2 protein could
protect mice from lethal influenza A virus challenge. Immu-
nology Letters 2004, 93:131-136.
39. Zebedee SL, Lamb RA: Influenza A virus M2 protein: mono-
clonal antibody restriction of virus growth and detection of
M2 in virions. Journal of Virology 1988, 62:2762-2772.
40. Lee LY, Ha DL, Simmons C, de Jong MD, Chau NV, Schumacher R,
Peng YC, McMichael AJ, Farrar JJ, Smith GL, et al.: Memory T cells
established by seasonal human influenza A infection cross-
react with avian influenza A (H5N1) in healthy individu-
als[see comment]. Journal of Clinical Investigation 2008,
118:3478-3490.
41. Zhirnov OP, Isaeva EI, Konakova TE, Thoidis G, Piskareva LM, Akop-
ova II, Kartashov A, Altstein AD, Ilyinskii PO, Shneider AM: Protec-
tion against mouse and avian influenza A strains via
vaccination with a combination of conserved proteins NP,
M1 and NS1. Influenza Other Respir Viruses 2007, 1:71-79.
42. Fiers W, De Filette M, Birkett A, Neirynck S, Min Jou W: A "univer-
sal" human influenza A vaccine.
Virus Research 2004,
103:173-176.
43. Roose K, Fiers W, Saelens X: Pandemic preparedness: Toward
a universal influenza vaccine. Drug News & Perspectives 2009,
22:80-92.
44. Suzuki Y, Gojobori T: A method for detecting positive selection
at single amino acid sites. Mol Biol Evol. 1999, 16(10):1315-1328.
45. Sergei L, Kosakovsky Pond AFYP, Simon DW: Frost: Estimating selec-
tion pressures on alignments of coding sequences Analyses using HyPhy
2007 [ />].
46. Reid AH, Taubenberger JK, Fanning TG: Evidence of an absence:
the genetic origins of the 1918 pandemic influenza virus.
Nature Reviews Microbiology 2004, 2:909-914.
47. Dunham EJ, Dugan VG, Kaser EK, Perkins SE, Brown IH, Holmes EC,
Taubenberger JK: Different evolutionary trajectories of Euro-
pean avian-like and classical swine H1N1 influenza A viruses.
Journal of Virology 2009, 83:5485-5494.
48. Furuse Y, Suzuki A, Kamigaki T, Shimizu M, Fuji N, Oshitani H: Rever-
sion of Influenza A (H3N2) from Amantadine-resistant to
Amantadine-sensitive by Further Reassortment in Japan
during the 2006–2007 Influenza Season. J Clin Microbiol 2009,
47:841-844.
49. Simonsen L, Viboud C, Grenfell BT, Dushoff J, Jennings L, Smit M,
Macken C, Hata M, Gog J, Miller MA, Holmes EC: The genesis and
spread of reassortment human influenza A/H3N2 viruses
conferring adamantane resistance. Molecular Biology & Evolution
2007, 24:1811-1820.
50. Holmes EC, Ghedin E, Miller N, Taylor J, Bao Y, St George K, Grenfell
BT, Salzberg SL, Fraser CM, Lipman DJ, Taubenberger JK: Whole-
genome analysis of human influenza A virus reveals multiple
persistent lineages and reassortment among recent H3N2
viruses. Plos Biology 2005, 3:e300.
51. Nelson MI, Simonsen L, Viboud C, Miller MA, Taylor J, George KS,
Griesemer SB, Ghedin E, Sengamalay NA, Spiro DJ, Volkov I, Grenfell
BT, Lipman DJ, Taubenberger JK, Holmes EC: Stochastic proc-
esses are key determinants of short-term evolution in influ-
enza a virus. PLoS Pathog. 2006, 2(12):e138.
52. Dugan VG, Chen R, Spiro DJ, Sengamalay N, Zaborsky J, Ghedin E,
Nolting J, Swayne DE, Runstadler JA, Happ GM, et al.: The evolu-
tionary genetics and emergence of avian influenza viruses in
wild birds. PLoS Pathogens 2008, 4:e1000076.
53. Reid AH, Fanning TG, Hultin JV, Taubenberger JK: Origin and evo-
lution of the 1918 "Spanish" influenza virus hemagglutinin
gene[see comment]. Proceedings of the National Academy of Sci-
ences of the United States of America 1999, 96:1651-1656.
Publish with BioMed Central and every
scientist can read your work free of charge
"BioMed Central will be the most significant development for
disseminating the results of biomedical researc h in our lifetime."
Sir Paul Nurse, Cancer Research UK
Your research papers will be:
available free of charge to the entire biomedical community
peer reviewed and published immediately upon acceptance
cited in PubMed and archived on PubMed Central
yours — you keep the copyright
Submit your manuscript here:
/>BioMedcentral
Virology Journal 2009, 6:67 />Page 13 of 13
(page number not for citation purposes)
54. Taubenberger JK, Reid AH, Krafft AE, Bijwaard KE, Fanning TG: Ini-
tial genetic characterization of the 1918 "Spanish" influenza
virus[see comment]. Science 1997, 275:1793-1796.
55. Scholtissek C, Stech J, Krauss S, Webster RG: Cooperation
between the hemagglutinin of avian viruses and the matrix
protein of human influenza A viruses. Journal of Virology 2002,
76:1781-1786.
56. Scholtissek C, Burger H, Kistner O, Shortridge KF: The nucleopro-
tein as a possible major factor in determining host specificity
of influenza H3N2 viruses. Virology 1985, 147:287-294.
57. Huang X, Liu T, Muller J, Levandowski RA, Ye Z: Effect of influenza
virus matrix protein and viral RNA on ribonucleoprotein for-
mation and nuclear export. Virology 2001, 287:405-416.
58. Takizawa N, Watanabe K, Nouno K, Kobayashi N, Nagata K: Asso-
ciation of functional influenza viral proteins and RNAs with
nuclear chromatin and sub-chromatin structure. Microbes &
Infection 2006, 8:823-833.
59. Reinhardt J, Wolff T: The influenza A virus M1 protein interacts
with the cellular receptor of activated C kinase (RACK) 1
and can be phosphorylated by protein kinase C. Veterinary
Microbiology 2000, 74:87-100.
60. Pleschka S, Wolff T, Ehrhardt C, Hobom G, Planz O, Rapp UR, Ludwig
S: Influenza virus propagation is impaired by inhibition of the
Raf/MEK/ERK signalling cascade. Nature Cell Biology 2001,
3:301-305.
61. Suzuki Y: Natural selection on the influenza virus genome.
Molecular Biology & Evolution 2006, 23:1902-1911.
62. Bragstad K, Nielsen LP, Fomsgaard A: The evolution of human
influenza A viruses from 1999 to 2006: a complete genome
study. Virology Journal 2008, 5:40.
63. Gotch F, McMichael A, Smith G, Moss B: Identification of viral
molecules recognized by influenza-specific human cytotoxic
T lymphocytes. Journal of Experimental Medicine 1987,
165:408-416.
64. Jameson J, Cruz J, Ennis FA:
Human cytotoxic T-lymphocyte
repertoire to influenza A viruses. Journal of Virology 1998,
72:8682-8689.
65. Ye ZP, Pal R, Fox JW, Wagner RR: Functional and antigenic
domains of the matrix (M1) protein of influenza A virus. Jour-
nal of Virology 1987, 61:239-246.
66. Bucher D, Popple S, Baer M, Mikhail A, Gong YF, Whitaker C, Paoletti
E, Judd A: M protein (M1) of influenza virus: antigenic analysis
and intracellular localization with monoclonal antibodies.
Journal of Virology 1989, 63:3622-3633.
67. Hay AJ, Wolstenholme AJ, Skehel JJ, Smith MH: The molecular
basis of the specific anti-influenza action of amantadine.
EMBO Journal 1985, 4:3021-3024.
68. Bright RA, Medina M-j, Xu X, Perez-Oronoz G, Wallis TR, Davis XM,
Povinelli L, Cox NJ, Klimov AI: Incidence of adamantane resist-
ance among influenza A (H3N2) viruses isolated worldwide
from 1994 to 2005: a cause for concern[see comment]. Lan-
cet 2005, 366:1175-1181.
69. McCown MF, Pekosz A: The influenza A virus M2 cytoplasmic
tail is required for infectious virus production and efficient
genome packaging. Journal of Virology 2005, 79:3595-3605.
70. Bao Y, Bolotov P, Dernovoy D, Kiryutin B, Zaslavsky L, Tatusova T,
Ostell J, Lipman D: The influenza virus resource at the National
Center for Biotechnology Information. Journal of Virology 2008,
82:596-601.
71. Stamatakis A, Hoover P, Rougemont J: A rapid bootstrap algo-
rithm for the RAxML Web servers. Systematic Biology 2008,
57:758-771.
72. Felsenstein J: Evolutionary trees from DNA sequences: a max-
imum likelihood approach. Journal of Molecular Evolution 1981,
17:368-376.
73. Computing Large Phylogenies with Statistical Methods:
Problems & Solutions [ />Dateien/publications/BGRS2004.PDF]
74. Tamura K, Nei M, Kumar S: Prospects for inferring very large
phylogenies by using the neighbor-joining method. Proceed-
ings of the National Academy of Sciences of the United States of America
2004, 101:11030-11035.
75. Anisimova M, Gascuel O: Approximate likelihood-ratio test for
branches: A fast, accurate, and powerful alternative. Syst Biol
2006, 55:539-552.
76. Pond SLK, Frost SDW, Muse SV: HyPhy: hypothesis testing using
phylogenies. Bioinformatics 2005, 21:676-679.
77. Lanave C, Preparata G, Saccone C, Serio G: A new method for cal-
culating evolutionary substitution rates. Journal of Molecular
Evolution 1984, 20:86-93.
78. Campo DS, Dimitrova Z, Mitchell RJ, Lara J, Khudyakov Y: Coordi-
nated evolution of the hepatitis C virus. Proceedings of the
National Academy of Sciences of the United States of America 2008,
105:9685-9690.
79. Kosakovsky Pond SL, Frost SD: Not so different after all: a com-
parison of methods for detecting amino acid sites under
selection. Mol Biol Evol. 2005, 22(5):1208-1222.
80. Pond SLK, Frost SDW, Grossman Z, Gravenor MB, Richman DD,
Brown AJL: Adaptation to different human populations by
HIV-1 revealed by codon-based analyses. PLoS Computational
Biology 2006, 2:e62.
81. Russell CA, Jones TC, Barr IG, Cox NJ, Garten RJ, Gregory V, Gust
ID, Hampson AW, Hay AJ, Hurt AC, de Jong JC, Kelso A, Klimov AI,
Kageyama T, Komadina N, Lapedes AS, Lin YP, Mosterin A, Obuchi
M, Odagiri T, Osterhaus AD, Rimmelzwaan GF, Shaw MW, Skepner
E, Stohr K, Tashiro M, Fouchier RA, Smith DJ: The global circula-
tion of seasonal influenza A (H3N2) viruses. Science 2008,
320:340-346.
82. Yang Z, Rannala B: Bayesian phylogenetic inference using DNA
sequences: a Markov Chain Monte Carlo Method. Mol Biol
Evol. 1997, 14(7):717-724.
83. Guindon S, Gascuel O: A simple, fast, and accurate algorithm
to estimate large phylogenies by maximum likelihood. Sys-
tematic Biology 2003, 52:696-704.
84. Barry G, Hall E: Phylogenetic Trees Made Easy: A How-To Manual Third
edition. University of Rochester: Sinauer Associates, Inc.; 2007.
85. Yang Z: PAML: a program package for phylogenetic analysis
by maximum likelihood.
Computer Applications in the Biosciences
1997, 13:555-556.
86. Llopart A, Comeron JM: Recurrent events of positive selection
in independent Drosophila lineages at the spermatogenesis
gene roughex. Genetics 2008, 179:1009-1020.