Báo cáo khoa học: "Temporal and geographic evidence for evolution of Sin Nombre virus using molecular analyses of viral RNA from Colorado, New Mexico and Montana" docx
Bạn đang xem bản rút gọn của tài liệu. Xem và tải ngay bản đầy đủ của tài liệu tại đây (2.46 MB, 16 trang )
BioMed Central
Page 1 of 16
(page number not for citation purposes)
Virology Journal
Open Access
Research
Temporal and geographic evidence for evolution of Sin Nombre
virus using molecular analyses of viral RNA from Colorado, New
Mexico and Montana
William C Black IV
1
, Jeffrey B Doty
2
, Mark T Hughes
2
, Barry J Beaty
2
and
Charles H Calisher*
2
Address:
1
Department of Microbiology, Immunology & Pathology, College of veterinary Medicine and Biomedical Sciences, Colorado State
University, Fort Collins, Colorado, USA and
2
Arthropod-borne and Infectious Diseases Laboratory, Department of Microbiology, Immunology &
Pathology, College of veterinary Medicine and Biomedical Sciences, Colorado State University, Fort Collins, Colorado, USA
Email: William C Black - ; Jeffrey B Doty - ; Mark T Hughes - ;
Barry J Beaty - ; Charles H Calisher* -
* Corresponding author
Abstract
Background: All viruses in the family Bunyaviridae possess a tripartite genome, consisting of a small, a medium, and a large RNA
segment. Bunyaviruses therefore possess considerable evolutionary potential, attributable to both intramolecular changes and
to genome segment reassortment. Hantaviruses (family Bunyaviridae, genus Hantavirus) are known to cause human hemorrhagic
fever with renal syndrome or hantavirus pulmonary syndrome. The primary reservoir host of Sin Nombre virus is the deer
mouse (Peromyscus maniculatus), which is widely distributed in North America. We investigated the prevalence of intramolecular
changes and of genomic reassortment among Sin Nombre viruses detected in deer mice in three western states.
Methods: Portions of the Sin Nombre virus small (S) and medium (M) RNA segments were amplified by RT-PCR from kidney,
lung, liver and spleen of seropositive peromyscine rodents, principally deer mice, collected in Colorado, New Mexico and
Montana from 1995 to 2007. Both a 142 nucleotide (nt) amplicon of the M segment, encoding a portion of the G2
transmembrane glycoprotein, and a 751 nt amplicon of the S segment, encoding part of the nucleocapsid protein, were cloned
and sequenced from 19 deer mice and from one brush mouse (P. boylii), S RNA but not M RNA from one deer mouse, and M
RNA but not S RNA from another deer mouse.
Results: Two of 20 viruses were found to be reassortants. Within virus sequences from different rodents, the average rate of
synonymous substitutions among all pair-wise comparisons (π
s
) was 0.378 in the M segment and 0.312 in the S segment
sequences. The replacement substitution rate (π
a
) was 7.0 × 10
-4
in the M segment and 17.3 × 10
-4
in the S segment sequences.
The low π
a
relative to π
s
suggests strong purifying selection and this was confirmed by a Fu and Li analysis. The absolute rate of
molecular evolution of the M segment was 6.76 × 10
-3
substitutions/site/year. The absolute age of the M segment tree was
estimated to be 37 years. In the S segment the rate of molecular evolution was 1.93 × 10
-3
substitutions/site/year and the
absolute age of the tree was 106 years. Assuming that mice were infected with a single Sin Nombre virus genotype, phylogenetic
analyses revealed that 10% (2/20) of viruses were reassortants, similar to the 14% (6/43) found in a previous report.
Conclusion: Age estimates from both segments suggest that Sin Nombre virus has evolved within the past 37–106 years. The
rates of evolutionary changes reported here suggest that Sin Nombre virus M and S segment reassortment occurs frequently in
nature.
Published: 14 July 2009
Virology Journal 2009, 6:102 doi:10.1186/1743-422X-6-102
Received: 8 April 2009
Accepted: 14 July 2009
This article is available from: />© 2009 Black et al; licensee BioMed Central Ltd.
This is an Open Access article distributed under the terms of the Creative Commons Attribution License ( />),
which permits unrestricted use, distribution, and reproduction in any medium, provided the original work is properly cited.
Virology Journal 2009, 6:102 />Page 2 of 16
(page number not for citation purposes)
Background
When Sin Nombre virus (SNV; family Bunyaviridae, genus
Hantavirus), the causative agent of the then newly recog-
nized hantavirus pulmonary syndrome in humans, was
discovered in 1993 in New Mexico, Colorado, and Ari-
zona, the next step in understanding the links in the chain
of transmission was to determine its natural history [1].
All other hantaviruses recognized to that time had been
shown to be associated with wild rodents and therefore
efforts were focused on rodents. It was soon shown that
the deer mouse, Peromyscus maniculatus, is the reservoir
host of this virus [2] and has since been shown that each
hantavirus is associated with rodents or insectivores of
single or a scant few species in long-term, perhaps co-evo-
lutionary, relationships [3].
Subsequent investigations of genotypes of North Ameri-
can hantaviruses, principally of SNV, have indicated or
suggested that, virus lineages occur in relative, if discon-
tinuous geographic isolation and may yet be mono-
phyletic, irrespective of geographic distribution. This has
been attributed to rodent host genetics [3]. In addition,
viral phylogeographic differences may be correlated with
deer mouse phylogeographic differences [4] and a variety
of complex interactions may lead to genetic diversity of
both the rodent hosts and the viruses [5].
As with all viruses assigned to the Bunyaviridae, hantaviral
genomes comprise three RNA segments: a large (L) RNA,
a medium (M) RNA, and a small (S) RNA. The L RNA
encodes the polymerase gene, the M RNA encodes a pre-
cursor polyprotein for the two virion glycoproteins Gn
and Gc and a nonstructural protein NSm, and the S RNA
encodes the nucleocapsid protein. Dual infections of cells
with closely related hantaviruses can yield reassortant
viruses (a mixture of RNA genome segments of the two
viruses) and reassortant viruses have potential epidemio-
logic implications [6,7].
Reassortants of SNV have been identified from field-col-
lected deer mice and from dually infected cells in vitro [8-
10]. The authors of those reports suggested that reassort-
ment with heterologous hantaviruses does not occur at all
or is rare but that segment reassortment in SNV-infected
deer mice might occur fairly regularly.
Such complexities and opportunities suggested to us that
it would be of value to analyze the RNAs of SNV from deer
mice in areas of select western U.S. states (Colorado, New
Mexico and Montana) characterized by similar and differ-
ent habitat types. We expected that the results of such eval-
uations would provide insight to the geographic
distribution, movement, and evolution of this virus. The
studies reported here demonstrate that SNV reassortment
occurs frequently and that it occurs at a high rate for both
the small and medium RNA segments.
Results
We sequenced portions of both the S and M segments of
SNV RNA samples collected from deer mice at six loca-
tions in Colorado, two locations in New Mexico and one
location in Montana (Table 1 and Figure 1). PCR products
were obtained for both M and S segments of SNV RNAs of
20 peromyscine rodents. These were then cloned and
sequenced; a minimum of three clones per sample were
sequenced to derive a consensus. Consensus sequences
for the 142 nt portion of the G2 transmembrane glycopro-
tein and the 751 nt region of the nucleocapsid protein are
shown in Figure 2. Polymorphic sites are underlined. The
predicted amino acid sequence appears above each
codon. Replacement substitutions are highlighted in gray.
Phylogenetic analysis
The 142 nt amplicon region of the M segment encoded a
47 codon portion of the G2 transmembrane glycoprotein
and was sampled from 21 mice. An additional 55
sequences of the same region of the M segment were
added from GenBank to provide a geographic and tempo-
ral context for our sequences. Table 2 lists the model and
parameters estimated in Modeltest 3.7 used to derive the
phylogeny shown in Figure 3. This is the rooted, Maxi-
mum Likelihood (ML), time-based phylogeny inferred
using a strict molecular clock in BEAST 1.4 [11] for the M
segment. There were 37 parsimony informative sites in the
M segment and consequently the bootstrap support for
the various clades was low. The two clades labeled with
light grey circles correspond to the SNV-type clades 1 and
2 proposed by Rowe et al. [12] from SNV collections from
Nevada and California. Pm11 from Montana is basal to
SNV-type Clade 1, whereas Pm19 is basal to SNV-type
Clade 2. However, the remainder of our sequences arose
on the clade labeled 3, as did most of the published
sequences that have been collected from Arizona and New
Mexico.
The 751 nt region of the S segment encoded 250 codons
of the highly conserved nucleocapsid protein and was
sampled from 21 mice. This region of the S segment has
not been as widely used as has the M segment in prior
studies so that only six additional sequences from the lit-
erature were available. Table 2 lists the model and param-
eters estimated in Modeltest 3.7 used to derive the
phylogeny shown in Figure 4. This is the rooted, ML, time-
based phylogeny inferred using a strict molecular clock
with BEAST 1.4 for the S segment. There were 211 parsi-
mony informative sites, and bootstrap support for the var-
ious clades was high. The two clades indicated with light
grey circles are well supported. Clade 1 contains 13 of our
S segment sequences and all previously published S seg-
Virology Journal 2009, 6:102 />Page 3 of 16
(page number not for citation purposes)
ment sequences from New Mexico. The "Four Corners
hantavirus" (Sin Nombre virus) sequence reported by
Hjelle et al. 1994 [13] is basal to Clade 1. Clade 2 is a new
clade containing exclusively Colorado sequences. Interest-
ingly, basal to Clade 2 is the SNV sequence from a deer
mouse captured at Convict Creek, California [14].
Clades from both segments were examined with respect to
geographic origin of the samples. Viruses from at least two
different clades were co-circulating in Fort Lewis deer mice
and the same was true in deer mice from Nathrop, CO and
Navajo NM.
Rates and patterns of molecular evolution
The M segment dataset was analyzed with all 78 sequences
shown in Figure 3 (Table 1). The absolute rate of molecu-
lar evolution of the M segment was 6.76 × 10
-3
substitu-
tions/site/year. The absolute age of the M segment tree
was estimated to be 37 years; a time scale in years appears
at the bottom of Figure 3. In the S segment, the rate of
molecular evolution was 1.93 × 10
-3
substitutions/site/
year and the absolute age of the tree was 106 years (Figure
4). The substitution rates (π, π
s
, π
a
) in the two segments
were similar (Table 3). The estimated ages of either seg-
ment suggest that SNV arose recently, within the past 37–
106 years.
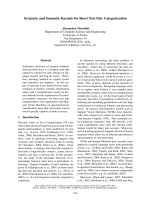
Map of western United States showing locations of trapping sites at which rodents with Sin Nombre virus RNA were obtainedFigure 1
Map of western United States showing locations of trapping sites at which rodents with Sin Nombre virus RNA
were obtained.
Virology Journal 2009, 6:102 />Page 4 of 16
(page number not for citation purposes)
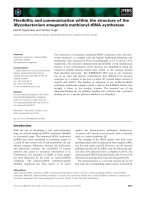
Consensus sequences for the 142 nt portion of the G2 transmembrane glycoprotein and the 751 nt region of the nucleocapsid proteinFigure 2
Consensus sequences for the 142 nt portion of the G2 transmembrane glycoprotein and the 751 nt region of
the nucleocapsid protein. Polymorphic sites are underlined. The predicted amino acid sequence appears above each codon.
Amino acid replacements are highlighted in gray.
A) 142 bp portion of the G2 transmembrane glycoprotein – M segment
F QR RH M M A T R D S F Q S F N V T E P H I T S N R
TTY
CMRCRYATGATGGCAACYMGRGAYTCTTTYCARTCRTTYAATGTDACAGARCCACAYATYACYAGYAAYC
G
L E W I D P D S S I K D H I N M VI L N R D V
R
CTTGARTGGATTGATCCDGAYAGYAGYATYAARGAYCATATHAAYATGRTTTTAAAYCGRGATGTH
B) 751 bp region of the nucleocapsid protein - S segment
E T K L G E L K R E L A D LH I A A Q K L A S K P V
GAGACCAAR
CTYGGRGARCTCAARMGGGARYTGGCTGATCWTATTGCAGCTCAGAAAYTGGCTTCAAAACCTG
T
D P T G I E P D D H L K E K S S L R Y G N V L D
V
TGATCCAACAGGGATTGAR
CCTGATGACCATYTAAARGAAAARTCATCAYTRAGRTATGGMAATGTYCTTGAT
G
N S I D L E E P RS GC Q T A D W K S I G L Y I L S
TR
AATTCYATYGAYYKRGAAGARCCRAGBKGBCARACMGCTGAYTGGAAATCYATYGGRCTMTAYATYYTRAG
T
F A L P I I L K A L Y M L S T R G R Q T I K E N K
TTTGCR
TTRCCVATYATYCTYAARGCYYTRTAYATGYTATCYACTAGRGGSCGTCARACAATYAAAGARAAYA
A
G T RG I R F K D D S S Y E E V N G I R K P R H L
Y
R
GGRACRRGAATTCGATTYAARGATGATTCRTCWTATGARGAAGTYAAYGGRATACGYAARCCAAGACAYYTR
T
V S M P T A Q S T M K A D E I T P G R F R T I A
AY
GTWTCYATGCCDACYGCYCARTCYACAATGAARGCAGAYGARATYACTCCYGGRAGRTTYMGWACWATWGC
Y
C G L F P A Q VA K A R N I I S P V M G V I G F S F
TGTGGDY
TRTTYCCNGCYCARGYYAARGCNAGRAAYATYATYAGTCCTGTYATGGGYGTRATTGGHTTYAGYT
T
F V K D W M E R I D DE F L A A R C P F L P E Q K
D
Y
TTYGTRAARGATTGGATGGARAGRATTGATGABTTYYTRGCTGCWCGBTGYCCWTTYYTRCCYGARCARAAR
G
P R D A A L A T N R A Y F I T R Q L Q V D E S K
ACCCY
AGRGATGCTGCAYTRGCAACYAAYMGRGCHTAYTTYATAACACGBCARTTRCARGTTGAYGARTCAAA
G
V S D I E D L I AT D A R A E S A T I F A D I A T P
GTY
AGYGAYATTGAGGAYYTGATTRCTGAYGCDMGGGCTGARTCYGCYACHATATTYGCAGAYATYGCHACYC
C
H S V
Y
CAYTCMGTH
Virology Journal 2009, 6:102 />Page 5 of 16
(page number not for citation purposes)
Linkage disequilibrium
Figure 5 is a heat diagram in which small disequilibrium
coefficients are represented by white or yellow and large
disequilibrium coefficients are represented by orange or
red. The matrix is read according to the nucleotide posi-
tion of segregating sites displayed along the diagonal. For
example in Figure 5, the square connecting sites 19 and 96
is orange (and placed in a box); this corresponds to an r
2
of 0.596 and these sites are in significant linkage disequi-
librium. The boxes linking sites 33 with 60 or 69 with 111
are also orange indicating that these sites are also in dise-
quilibrium with one another. In contrast, squares linking
site 2 with all other sites are white or light yellow and
these sites are in equilibrium with site 2. The majority of
boxes in Figure 5 are light, suggesting that most segregat-
ing sites in the M segment exist in equilibrium. This prob-
ably occurs because mutations at segregating sites in this
region of the M segment occur independently of one
another.
Analysis of the S segment indicates many orange and red
boxes suggesting a high rate of disequilibrium distributed
throughout the S segment sequence (Figure 6). These pat-
terns suggest that our sampling of only a 142 nt portion of
the M segment may not provide an accurate sample of
evolutionary rates and patterns in the whole M segment.
Many sites in the S segment are in disequilibrium and our
coverage of this segment thus appears adequate.
Test of neutrality
The uniformly high synonymous substitution rate (π
s
) in
the M and S segments shown in Table 3 suggests a very
high nucleotide substitution rate but a very low rate of
amino acid substitutions. This pattern is consistent with
strong purifying selection. To test this pattern further, the
F* statistic [15] was calculated to test for selective neutral-
ity. Figure 7 shows that the overall F* statistic for the M
segment is negative and that the regions that are signifi-
cant in the 3' region are negative as well. The overall F*
statistic for the S segment is a smaller negative number but
only a small region is significant. Recalling that F* > 0
under balancing selection, F* ≈ 0 with neutral substitu-
tions and F* < 0 under purifying selection, Figure 7 sup-
ports a model of purifying selection for the M segment
and neutral substitutions in the S segment.
Segment reassortments
Maximum likelihood trees were created for both genome
segments (M segment on left, S segment on right in Figure
8). Specific clades in the M and S segment trees are labeled
by letters in ovals from A-E, and A-D, respectively. For rea-
sons already discussed, the majority of bootstrap values in
the M segment phylogeny were low, whereas the boot-
strap scores in the S segment phylogeny are large.
There are two isolates in which the M segment arises on a
different branch than does the S segment. Pb15 and Pm17
both from Navajo, NM, arose from Clade E in the M seg-
Table 1: Mouse species, identification and accession numbers, date and the city nearest to the trapping site
Species ID Acc. no. Capture Date Location S M
Peromyscus maniculatus M02 MN-2 07/21/2003 Mesa, CO +
a
+
Peromyscus maniculatus M06 BBE-13 06/09/2004 Breen, CO + +
Peromyscus maniculatus M11 B-942 07/05/2003 Polson, MT + +
Peromyscus maniculatus M12 NK-62732 02/07/1995 Placitas, NM + +
Peromyscus boylii M15 NK-86435 05/21/1999 Navajo, NM + +
Peromyscus maniculatus M16 NK-86747 07/14/1999 Navajo, NM + +
Peromyscus maniculatus M17 NK-97143 12/05/2000 Navajo, NM + +
Peromyscus maniculatus M19 FC-8 04/04/2006 Fort Collins, CO + +
Peromyscus maniculatus M20 ES-7 07/11/2006 Ault, CO + -
Peromyscus maniculatus M22 TS-830-18 08/30/2006 Fort Lewis, CO + +
Peromyscus maniculatus M23 TS-830-20 08/30/2006 Fort Lewis, CO + +
Peromyscus maniculatus M24 TS-830-08 08/30/2006 Fort Lewis, CO + +
Peromyscus maniculatus M25 TS-830-09 08/30/2006 Fort Lewis, CO + +
Peromyscus maniculatus M27 TS-830-06 08/30/2006 Fort Lewis, CO + +
Peromyscus maniculatus M28 C-1 09/13/2006 Nathrop, CO + +
Peromyscus maniculatus M29 C-8 09/13/2006 Nathrop, CO + +
Peromyscus maniculatus M30 J-9 09/13/2006 Nathrop, CO + +
Peromyscus maniculatus M31 J-23 09/13/2006 Nathrop, CO + +
Peromyscus maniculatus M32 2C-4 09/14/2006 Nathrop, CO + +
Peromyscus maniculatus M33 WR-7 06/05/2007 Wray, CO + +
Peromyscus maniculatus M34 WR-11 06/05/2007 Wray, CO + +
Peromyscus maniculatus M37 WR-20 06/05/2007 Wray, CO - +
TOTAL 22 22
a
"+" indicates mice from which S or M RNAs were successfully sequenced
Virology Journal 2009, 6:102 />Page 6 of 16
(page number not for citation purposes)
Maximum likelihood tree for the M segment with 1,000 bootstrap pseudoreplicationsFigure 3
Maximum likelihood tree for the M segment with 1,000 bootstrap pseudoreplications. New sequences from the
present study are in bold. The state and date of collection are listed for each sequence. All clades with bootstrap support >
50% are indicated with a dot and the % of bootstrap support. The SN-Type clades 1 and 2 proposed by Rowe et al. (1995) are
indicated with grey circles as is clade 3 in which all but one of the sequences in the present study arose.
Virology Journal 2009, 6:102 />Page 7 of 16
(page number not for citation purposes)
ment but arose from Clade B in the S segment. Thus, 2 of
the 20 peromyscines from which we amplified both the S
and M segments appeared to contain reassortant viruses.
Otherwise, the S and M segment phylogenies appear to
parallel one another. A χ
2
test of independence was per-
formed to examine the overall correlation between the M
and S segment sequences from same individuals. The χ
2
test was highly significant (P ≤ .0001) as was the Fisher's
Exact Test (P = 7.96 × 10
-9
). This suggests that the M and S
segment sequences from the same mice tended to arise on
the same clade.
Discussion
Phylogenetic analyses of SNV genotypes revealed that
10% (2/20) of viruses were reassortants, not significantly
less (Fisher's Exact Test P = 1.00) than the 14% (6/46)
reported previously [9] in SNV sequences from Nevada
and eastern California. Those authors examined isolates
from 3 humans and from 43 rodents and found that all of
the human isolates but only three of the rodent isolates
were reassortants. A better comparison therefore is 3 of 43
(7%) but this also is not significantly less than the rate in
the present study (Fisher's Exact Test P = 0.6488).
Henderson et al. [9] suggested that as genetic distance
increases, the frequency of formation of viable reassor-
tants decreases and that hantaviruses which are primarily
maintained in different rodent hosts rarely have the
opportunity to genetically interact. Our data only partially
support this suggestion. Notice for example in Figure 8
that the M segment of Pb15 (from a brush mouse) and
Pm17 from Navajo, NM (Clade F) are genetically distant
(4% difference) from M segments of those in Clade B, the
clade containing the S segment of Pb15 and Pm17. Acqui-
sition of SNV by a brush mouse likely was due to a spill-
over event, an infrequent interspecies interaction between
this rodent and an SNV-infected deer mouse. Alterna-
tively, it may be that rodents in species-poor areas are
spared frequent contact with rodents in nearby but not
contiguous areas. Further interpretations require addi-
tional information regarding climatic conditions, habitat
peculiarities and physical barriers, and information about
seasonality of collections.
Very few sites in the 142 nt of the M segment were in link-
age disequilibrium (Figure 5) while many of the sites
within 150 nt of one another in the S segment were in dis-
equilibrium (Figure 6). The differences in disequilibrium
rates are not attributable to greater mutation rates because
both segments have similar evolutionary rates (Table 3).
The differences could be related to relative synonymous
codon usage; the S segment having a biased and therefore
constrained usage pattern, while the M segment may have
had unbiased usage. However, a scaled χ
2
analysis of rela-
tive synonymous codon usage in DNAsp revealed no bias
in either gene (analysis not shown). The difference might
Table 2: Rate and shape parameters estimated by Modeltest 3.7 for each of the four phylogenies presented in Figures. 3, 4, and 8
Transition/transversion ratio Kappa Model Shape parameter (α)
Phylogeny
Figure 2
M segment
- - GTR + Γ 0.1401
Figure 3
S segment
- - GTR + Γ 0.1675
Figure 8
M segment
7.7887 15.58 K80(K2P) + Γ 0.0004
Figure 8
S segment
- - GTR + Γ 0.1693
Substitution rate matrix Proportion of each nucleotide
Phylogeny AC AG AT CG CT GT A C G T
Figure 2
M segment
1.000 9.889 0.176 0.176 9.889 1.000 0.339 0.181 0.167 0.314
Figure 3
S segment
2.349 18.668 1.041 0.258 26.663 1.000 0.302 0.196 0.224 0.278
Figure 8
M segment
- - - - - - 0.250 0.250 0.250 0.250
Figure 8
S segment
1.000 11.321 0.522 0.522 18.495 1.000 0.306 0.194 0.221 0.279
Virology Journal 2009, 6:102 />Page 8 of 16
(page number not for citation purposes)
Maximum likelihood tree for the S segment with 1,000 bootstrap pseudoreplicationsFigure 4
Maximum likelihood tree for the S segment with 1,000 bootstrap pseudoreplications. New sequences from the
present study are in bold. The state and date of collection are listed for each sequence. All clades with bootstrap support >
50% are indicated with a dot and the % of bootstrap support. Clades 1 and 2 referred to in the text are indicated with grey cir-
cles.
Virology Journal 2009, 6:102 />Page 9 of 16
(page number not for citation purposes)
be associated with the relative ages of the two sequences
since the S segment was estimated to be 2.86 times (106
years/37 years) older than the M segment. As an ancestral
sequence accumulates mutations, distinct lineages begin
to form. Initially sequences may be in disequilibrium
because segregating sites have not had sufficient time to
accumulate reverse mutations. However, given enough
time, these reverse mutations will accumulate and pat-
terns of disequilibrium will dissipate. However this is
opposite to the observed trend; S is older than M. There
may be some type of epistatic selection acting across the
nucleocapsid gene or protein that maintains polymorphic
sites in disequilibrium while no such selection is acting
upon the G2 gene or glycoprotein. However, we have no
hypotheses about the form of such a selection.
The significance of these findings lies in the observations
regarding the relatively high rate of reassortment. The deer
mouse is the most common and most numerous mam-
mal in North America. It occurs throughout the United
States and much of Canada, except for their eastern coasts.
Because SNV is transmitted principally through transfer of
saliva, urine or feces from SNV-infected rodents, because
these rodents are so numerous, and because the virus
affects the rodent host but does not do so critically [16],
intraspecies transmission of SNV occurs at high frequency
[17,18]. This provides frequent opportunities for genomic
evolution to occur via reassortment, as has been reported
for influenza viruses [19].
If one arbitrarily selects a location in North America and
sequences the M and S RNAs of SNV from deer mice at
that site and then sequences M and S RNAs from deer
mice at sites increasingly distant (geographically or by
habitat type) from that site, numerous and divergent gen-
otypes likely would be found. Indeed, the initial epidemi-
ologic studies of SNV (S.T. Nichol, personal
communication, 1994) showed such a pattern on a
smaller geographic scale. The number of mutations and
cumulative reassortments mount until, at the greatest geo-
graphic distances, the virus might be seen as being no
longer consistent with the topotype. Host-switching
events may lead to distinct variants in different peromys-
cine subspecies (c.f., Monongahela virus in P. maniculatus
nubiterrae) or in rodents of different peromyscine species
(c.f., New York and Blue River viruses in P. leucopus). The
phylogeography of these subtypes and varieties must be
determined, if we are to understand rodent host and
hantaviral genetics because virus variations may reflect
those of their rodent hosts, as has been suggested by Dra-
goo et al. [4].
It appears to be counterintuitive that this virus has evolved
as rapidly as our data suggest. One might justifiably ask
how this virus has managed to become distributed so
widely in North America only recently, when its host
rodent, the deer mouse, is and has been distributed over
this continent for a very long time. Could a progenitor of
SNV have been a virus whose rodent host was not the deer
mouse and which switched hosts only fairly recently? Low
rates of nucleotide substitutions have been hypothesized
for the hantaviruses but, as Ramsden et al. have suggested,
"hantaviruses replicate with an RNA-dependent RNA
polymerase, with error rates in the region of one mutation
per genome replication, [and therefore] this low rate of
nucleotide substitution is anomalous" [20]. Do only
slight host genetic differences lead to only slight, but sig-
nificant, differences in the virus? Can such apparently triv-
ial virus genetic differences have substantial
epidemiologic differences, perhaps effecting pathogenic-
ity? There are many possible scenarios that should be
investigated; the data we present here do not shed light on
them.
Variants that are widely divergent may have acquired a
gene or genes, one or more mutations, or combinations of
otherwise non-pathogenic changes, and changes thereby
arise and may have epidemiologic consequences. Such
changes could be towards or away from pathogenicity,
infectivity, stability, persistence, host adaptability, replica-
tion, or otherwise. These combinations of events are ran-
dom, or at least not predictable at this time, and therefore
continued surveillance is needed.
Table 3: Polymorphism and substitution rates in the M and S sequences of SNV utilized in Figures 3 and 4
Segment analyzed No. of sequences (this study) No. of unique sequences Haplotype diversity ± std. dev
M segment 78 (21) 65 0.993 ± 0.004
S segment 27(21) 22 0.977 ± 0.019
Segment analyzed π ± std. dev π
s
(potential synonymous sites)
π
a
(potential replacement sites)
M segment 0.07525 ± 0.00365 0.378 (27.5) 0.00070 (110.6)
S segment 0.07432 ± 0.00693 0.312 (176) 0.00173 (574)
Virology Journal 2009, 6:102 />Page 10 of 16
(page number not for citation purposes)
Methods
Rodent sampling
Using Colorado State University Animal Care and Use
Committee-approved procedures, rodents of several spe-
cies were captured using Sherman live-traps. Trapping was
conducted at several geographically diverse locations in
Colorado, including Fort Collins and Ault (north-central),
Wray (northeast), Fort Lewis and Breen (southwest),
Nathrop (central), and Mesa (west-central) (Figure 1).
Habitats at the Fort Collins and Wray sites are character-
ized as shortgrass prairie; at Fort Lewis and Breen as mon-
tane shrubland dominated by Gambel's oak (Quercus
gambelii) and big sage (Artemisia tridentata); at Mesa and
Nathrop as pinyon-juniper (Pinus edulis and Juniperus
spp.) and sagebrush shrublands; the Ault site was an
uncultivated agricultural field.
One SNV-infected deer mouse from Polson, Montana was
kindly provided by Dr. Richard Douglas, Montana Tech,
Butte, Montana. Several others were from Navajo and
Placitas, New Mexico, gifts of Dr. Terry Yates, University of
New Mexico, Albuquerque. Deer mice trapped in Colo-
rado were sacrificed and liver, lung, kidneys and spleen
were removed and stored in RNALater (Ambion, Austin,
TX) at -70°C until they were analyzed.
Collecting and processing deer mice
Deer mice were captured in 8 × 9 × 23-cm non-folding
Sherman live-traps (H. B. Sherman Traps, Inc., Tallahas-
A heat map of linkage disequilibrium among the 36 polymorphic sites in the M segmentFigure 5
A heat map of linkage disequilibrium among the 36 polymorphic sites in the M segment. Only sequences from
clade 3 (Figure 3) were analyzed. The matrix is read according to the nucleotide position of segregating sites displayed along
the diagonal. Small disequilibrium coefficients are represented by white or yellow and large disequilibrium coefficients are rep-
resented by orange or red.
Virology Journal 2009, 6:102 />Page 11 of 16
(page number not for citation purposes)
A heat map of linkage disequilibrium among the 177 polymorphic sites in the S segmentFigure 6
A heat map of linkage disequilibrium among the 177 polymorphic sites in the S segment. Only sequences from
clades 1 and 2 (Figure 4) were analyzed. The matrix is read according to the nucleotide position of segregating sites displayed
along the diagonal. Small disequilibrium coefficients are represented by white or yellow and large disequilibrium coefficients are
represented by orange or red.
Virology Journal 2009, 6:102 />Page 12 of 16
(page number not for citation purposes)
F test of neutrality (Fu and Li, 1993) for the M and S segmentsFigure 7
F test of neutrality (Fu and Li, 1993) for the M and S segments. Only sequences from clade 3 of the M tree (Figure 3)
and clades 1 – 2 of the S tree (Figure 4) were analyzed.
Virology Journal 2009, 6:102 />Page 13 of 16
(page number not for citation purposes)
see, FL) baited with cracked corn, peanut butter and rolled
oats. Animals were anesthetized with isoflurane, standard
measurements were taken and blood samples were col-
lected from the retro-orbital plexus. For animals captured
in Colorado during and after 2006, a 1-hour rapid ELISA
was used in the field to test deer mouse blood samples for
antibody to SNV [21]. Seropositive deer mice were eutha-
nized and kidney, liver, lung, and spleen samples were
collected from each. Those found to be seronegative were
released at the site of capture. Prior to 2006, only carcasses
of deer mice that had died under anesthesia and were later
found to be seropositive by an ELISA were used in this
study.
RNA purification and reverse transcription
For total RNA extraction, tissues were frozen in liquid
nitrogen and then homogenized using a mortar and pes-
tle. Homogenates were extracted once using guanidinium
thiocyanate-phenol-choloroform (Trizol, Invitrogen,
Carlsbad, CA); RNA was precipitated with isopropanol.
Total RNA from infected mouse tissue was then reverse
transcribed with Thermoscript (Invitrogen) and amplified
via polymerase chain reactions (PCR) using segment spe-
cific primers (Table 4). Amplicons of a 751 nt region of
the S segment and of a 142 nt region of the M segment
were produced. Nested PCR was then performed to pro-
duce samples used as sequencing templates.
Maximum likelihood trees for the M and S sequences collected in this study from the same miceFigure 8
Maximum likelihood trees for the M and S sequences collected in this study from the same mice. Bootstrap
results are from 1,000 pseudoreplications. The names of samples that arose from the same mouse and appear in the same
clade are listed once in the center of the diagram. The names of samples that arose from the same mouse but appear in differ-
ent clades are shown in boxes.
Virology Journal 2009, 6:102 />Page 14 of 16
(page number not for citation purposes)
The S segment was amplified with the following cycling
parameters: 94°C (120 s) initial denaturing, [94°C (30 s),
58°C (30 s), 72°C (60 s)] 40 times, and a final extension
at 72°C (300 s). The M segment was amplified with these
cycling parameters: 94°C (120 s) initial denaturing,
[94°C (10 s), 56°C (15 s), 72°C (30 s)] 40 times, and a
final extension at 72°C (300 s). Table 4 shows the primers
used for each segment. Purified PCR products were cloned
into vector pCR2.1 (TOPO cloning kit, Invitrogen). A
minimum of 3 clones were sequenced per sample to con-
trol for any Taq polymerase-induced mutations. Samples
were fully sequenced by the Colorado State University
Macromolecular Sequencing core facility. Cloned seg-
ment data were submitted for BLAST analysis to confirm
their identities as SNV sequences http://
www.ncbi.nlm.nih.gov/BLAST/.
Phylogenetic Analysis
To compare our sequences with those reported in the lit-
erature we used the following M segment sequences:
L27759-27795 [22], U33219-U33264, U45023 [12],
U10889 [23], L37903 [24], and U44991 – U44992 from
[9]. S segment sequences were U47135 [25], U29210 [26],
U09488 [27], AF281850 and AF281851 [28], L33683 and
L33816 [14], L37904 [23], U02474 [13] and L25784 [21].
Maximum likelihood trees were estimated separately for
the M and the S segments by first identifying the evolu-
tionary model that best fits the data, using Modeltest 3.7
[29] with the Phylogenetic Analysis Using Parsimony
(PAUP) 4.0b10 package [30]. The optimal model and
parameters were then used to estimate the ML tree in
PAUP. Bootstrap values of individual branches were
obtained with ML analysis of 100 pseudoreplicates. This
same model and parameters were then used in the
BEAUTi/BEAST 1.4 package to develop a rooted, time-
based phylogeny inferred using a strict molecular clock.
The year of collection minus 2007 values were entered as
"Date before the present" variables for each RT-PCR or
isolation record. TreeAnnotater (v1.4.8) was used to gen-
erate the ML tree. The rate of molecular evolution (substi-
tutions/site/year) was also estimated from the BEAUTi/
BEAST 1.4.
Linkage disequilibrium analysis
Linkage disequilibrium is a measure of the degree to
which substitutions in a segment occur independently of
one another. Substitutions that occur together in a seg-
ment at a rate predicted by their independent frequencies
are in linkage equilibrium. Substitutions that occur more
or less often than expected by random chance are consid-
ered to be in linkage disequilibrium. The Hill and Robert-
son correlation coefficient (r
2
) [31] was used as a metric of
disequilibrium because it ranges from zero (linkage equi-
librium) to one (linkage disequilibrium). Linkage dise-
quilibrium also tests whether sampling a portion of a
genome segment is representative of the whole segment.
Linkage equilibrium is detected when different parts of a
segment are evolving independently and sequencing a
portion of the segment may not provide a representative
sample of the whole. Linkage disequilibrium patterns
among all polymorphic sites were plotted on a heatmap
using the LDheatmap program in R [32].
Nucleotide polymorphisms and substitution rates
For each segment, the computer program DnaSP 4.5 [33]
estimated haplotype diversity [34] (equations 8.4 and
8.12 but replacing 2n by n) and π the average number of
nucleotide differences among all pairwise comparisons of
sequences [34] (equation 10.5). π also was estimated sep-
arately for synonymous (π
s
)and replacement substitu-
tions (π
a
).
A test of selective neutrality was performed [15]. The F*
statistic was calculated in DnaSP to provide a normalized
comparison of the number of all mutations (η) to the
number of singletons (η
s
). This analysis assumes that F* >
0 (η > η
s
) under balancing selection, F* ≈ 0 (η ≈ η
s
) with
neutral substitutions and F* < 0 (η < η
s
) under purifying
selection.
Table 4: Primers used in reverse transcription and amplification of portions of the S and M segments of Sin Nombre virus genotypes
PCR step SNV segment Primer name Sequence
RT S SNV-S5'T TAGTAGTAGACTTCKTRAAGAGCTACT
1° reaction S SNV-S41s GGAATGAGCACCCTCAAAGAAGTGCAAGACAAC
1° reaction S PSE-S1064r ATRGTRTTYCTCATATCCTG
2° reaction S SNV-S143s TGGACCCMGATGAYGTTAACAA
2° reaction S SNV-S1000r GACAYCGATCWGGNGCACATGCAAARACCC
RT M SNV-M2730s CTTTTAGAAAGAWMTGTGSRTTTGC
1° reaction M SNV-M2730s CTTTTAGAAAGAWMTGTGSRTTTGC
1° reaction M SNV-M3023r CCTACTCCTGAACCCCAGGCCCCG
2° reaction M SNV-M2764s CCAACATGTGAGTATCAAGGCAACACAGTGCTGG
2° reaction M SNV-M2966r GGKKTWTCACTTAGRTCYTGRAAGG
Virology Journal 2009, 6:102 />Page 15 of 16
(page number not for citation purposes)
Segment reassortants
The topology of the M and S segment trees were compared
to detect whether SNV RNA sequences from the same
mouse arose in the same branches. Sequences arising in
different clades were considered prima facie evidence of
reassortment. A χ
2
test of independence was also per-
formed to test whether M and S segments from the same
mouse were significantly correlated (non-independent).
This was done by labeling clades with a letter and then
assigning each isolate the letter of its clade in the M and S
segment trees.
Competing interests
The authors declare that they have no competing interests.
Authors' contributions
WCB performed the statistical analyses and wrote descrip-
tions of the techniques and results. JBD assisted in con-
ducting the field studies and conducted the molecular
genetics studies and the sequence alignments. MTH super-
vised the molecular analyses and sequence alignments
and participated in the field studies. BJB conceived the
study and provided advice regarding additional field
work. CHC supervised and participated in the field studies
and drafted the manuscript. All authors read and
approved the final manuscript.
Acknowledgements
We thank Dr. Tony Schountz, University of Northern Colorado, Greeley,
Colorado, Ms Tiffany Richens and Ms Meaghan Beaty, Colorado State Uni-
versity, and many unnamed others for assistance in capturing some of the
rodents in which SNV RNA was detected. We are grateful to Dr. Stuart N.
Nichol, Special Pathogens Branch, Coordinating Center for Infectious Dis-
eases, National Center for Zoonotic, Vector-Borne, and Enteric Diseases,
U.S. Centers for Disease Control and Prevention, Atlanta, Georgia, for his
insightful and very helpful comments regarding data analysis. Funding for
these studies was provided by National Institute of Allergy and Infectious
Diseases, National Institutes of Health contract N01-AI 25489 "United
States based collaboration in emerging viral and prion diseases."
References
1. Nichol ST, Spiropoulou CF, Morzunov S, Rollin PE, Ksiazek TG, Feld-
mann H, Sanchez A, Zaki S, Childs J, Peters CJ: Genetic identifica-
tion of a hantavirus associated with an outbreak of acute
respiratory illness. Science 1993, 262:914-917.
2. Childs JE, Ksiazek TG, Spiropoulou CF, Krebs JW, Morzunov S,
Maupin GO, Gage KL, Rollin PE, Sarisky J, Enscore RE, Frey JK, Peters
CJ, Nichol ST: Serologic and genetic identification of Peromy-
scus maniculatus as the primary rodent reservoir for a new
hantavirus in the southwestern United States. Journal of Infec-
tious Diseases 1994, 169:1271-1280.
3. Morzunov SP, Rowe JE, Ksiazek TG, Peters CJ, St. Jeor SC, Nichol ST:
Genetic analysis of the diversity and origin of hantaviruses in
Peromyscus leucopus mice in North America. Journal of Virology
1998, 72:57-64.
4. Dragoo JW, Lackey JA, Moore KE, Lessa EP, Cook JA, Yates TL: Phy-
logeography of the deer mouse (Peromyscus maniculatus)
provides a predictive framework for research on hantavi-
ruses. Journal of General Virology 2006, 87:1997-2003.
5. Monroe MC, Morzunov SP, Johnson AM, Bowen MD, Artsob H, Yates
T, Peters CJ, Rollin PE, Ksiazek TG, Nichol ST: Genetic diversity
and distribution of Peromyscus-borne hantaviruses in North
America. Emerging Infectious Diseases 1999, 5:75-86.
6. Reese SM, Blitvich BJ, Blair CD, Geske D, Beaty BJ, Black WC 4th:
Potential for La Crosse virus segment reassortment in
nature. Virology Journal 2008, 30:164.
7. Chandler LJ, Beaty BJ, Baldridge GD, Bishop DH, Hewlett MJ: Heter-
ologous reassortment of bunyaviruses in Aedes triseriatus
mosquitoes and transovarial and oral transmission of newly
evolved genotypes. Journal of General Virology 1990, 71:1045-1050.
8. Li D, Schmaljohn AL, Anderson K, Schmaljohn CS: Complete nucle-
otide sequences of the M and S segments of two hantavirus
isolates from California: evidence for reassortment in nature
among viruses related to hantavirus pulmonary syndrome.
Virology 1995, 206:973-983.
9. Henderson WW, Monroe MC, St. Jeor SC, Thayer WP, Rowe JE,
Peters CJ, Nichol ST: Naturally occurring Sin Nombre virus
genetic reassortants. Virology 1995, 214:602-610.
10. Rodriguez LL, Owens JH, Peters CJ, Nichol ST: Genetic reassort-
ment among viruses causing hantavirus pulmonary syn-
drome. Virology 1998, 242:99-106.
11. Drummond AJ, Rambaut A: BEAST: Bayesian evolutionary anal-
ysis by sampling trees. BMC Evolutionary Biology 2007, 7:214-222.
12. Rowe JE, St. Jeor SC, Riolo J, Otteson EW, Monroe MC, Henderson
WW, Ksiazek TG, Rollin PE, Nichol ST: Coexistence of several
novel hantaviruses in rodents indigenous to North America.
Virology 1995, 213:122-130.
13. Hjelle B, Jenison S, Torrez-Martinez N, Yamada T, Nolte K, Zumwalt
R, Macinnes K, Myers G: A novel hantavirus associated with an
outbreak of fatal respiratory disease in the southwestern
United States – evolutionary relationships to known hantavi-
ruses. Journal of Virology 1994, 68:592-596.
14. Schmaljohn AL, Li DX, Negley DL, Bressler DS, Turell MJ, Korch GW,
Ascher MS, Schmaljohn CS: Isolation and initial characterization
of a newfound hantavirus from California. Virology 1995,
206:963-972.
15. Fu YX, Li WH: Statistical tests of neutrality of mutations.
Genetics 1993, 133:693-709.
16. Douglass RJ, Calisher CH, Wagoner KD, Mills JN: Sin Nombre
virus infection of deer mice in Montana: characteristics if
newly infected mice, incidence, and temporal pattern of
infection. Journal of Wildlife Diseases 2007, 43:12-22.
17. Calisher CH, Sweeney W, Mills JN, Beaty BJ: Natural history of Sin
Nombre virus in western Colorado. Emerging Infectious Diseases
1999, 5:126-134.
18. Calisher CH, Wagoner KD, Amman BR, Root J, Douglass RJ, Kuenzi
AJ, Abbott KD, Parmenter C, Yates TL, Ksiazek TG, Beaty BJ, Mills
JN: Demographic factors associated with prevalence of anti-
body to Sin Nombre virus in deer mice in the western United
States. Journal of Wildlife Diseases 2007, 43:1-11.
19. Nelson MI, Viboud C, Simonsen L, Bennett RT, Griesemer SB, St
George K, Taylor J, Spiro DJ, Sengamalay NA, Ghedin E, Tauben-
berger JK, Holmes EC: Multiple reassortment events in the evo-
lutionary history of H1N1 influenza A virus since 1918. PLoS
Pathogens 2008, 4:e1000012.
20. Ramsden C, Holmes EC, Charleston MA:
Hantavirus evolution in
relation to its rodent and insectivore hosts: no evidence for
codivergence. Molecular and Biological Evolution 2009, 26:143-153.
21. Schountz T, Calisher CH, Richens TR, Rich AA, Doty JB, Hughes MT,
Beaty BJ: Rapid field immunoassay for detecting antibody to
Sin Nombre virus in deer mice. Emerging Infectious Diseases 2007,
13:1604-1607.
22. Spiropoulou CF, Morzunov S, Feldmann H, Sanchez A, Peters CJ,
Nichol ST: Genome structure and variability of a virus causing
hantavirus pulmonary syndrome. Virology 1994, 200:715-723.
23. Nerurkar VR, Song JW, Song KJ, Nagle JW, Hjelle B, Jenison S, Yan-
agihara R: Genetic evidence for a hantavirus enzootic in deer
mice (Peromyscus maniculatus) captured a decade before the
recognition of hantavirus pulmonary syndrome. Virology 1994,
204:563-568.
24. Chizhikov VE, Spiropoulou CF, Morzunov SP, Monroe MC, Peters CJ,
Nichol ST: Complete genetic characterization and analysis of
isolation of Sin Nombre virus. Journal of Virology 1995,
69:8132-8136.
25. Huang C, Campbell WP, Means R, Ackman DM: Hantavirus S RNA
sequence from a fatal case of HPS in New York. Journal of Med-
ical Virology 1996, 50:5-8.
26. Song JW, Baek LJ, Gavrilovskaya IN, Mackow ER, Hjelle B, Yanagihara
R: Sequence analysis of the complete S genomic segment of
Publish with BioMed Central and every
scientist can read your work free of charge
"BioMed Central will be the most significant development for
disseminating the results of biomedical research in our lifetime."
Sir Paul Nurse, Cancer Research UK
Your research papers will be:
available free of charge to the entire biomedical community
peer reviewed and published immediately upon acceptance
cited in PubMed and archived on PubMed Central
yours — you keep the copyright
Submit your manuscript here:
/>BioMedcentral
Virology Journal 2009, 6:102 />Page 16 of 16
(page number not for citation purposes)
a newly identified hantavirus isolated from the white-footed
mouse (Peromyscus leucopus): phylogenetic relationship with
other sigmodontine rodent-borne hantaviruses. Virus Genes
1996, 12:249-256.
27. Hjelle B, Krolikowski J, Torrez-Martinez N, Chavez-Giles F, Vanner
C, Laposata E: Phylogenetically distinct hantavirus implicated
in a case of hantavirus pulmonary syndrome in the north-
eastern United States. Journal of Medical Virology 1995, 46:21-27.
28. Botten J, Mirowsky K, Kusewitt D, Bharadwaj M, Yee J, Ricci R, Fed-
dersen RM, Hjelle B: Experimental infection model for Sin
Nombre hantavirus in the deer mouse (Peromyscus manicu-
latus). Proceedings of the National Academy of Sciences of the United
States of America 2000, 97:10578-10583.
29. Posada D, Crandall KA: Modeltest: testing the model of DNA
substitution. Bioinformatics 1998, 14:817-818.
30. Swofford D: PAUP*, Phylogenetic Analysis Using Parsimony
(*and Other Methods). In Sinauer Associates Sunderland, Massa-
chusetts; 2002:4.
31. Hill WG, Robertson A: Linkage disequilibrium in finite popula-
tions. Theoretical and Applied Genetics 1968, 38:226-231.
32. Shin J-H, Blay S, McNeny B, Graham J: LDheatmap: An R function
for graphical display of pairwise linkage disequilibria
between single nucleotide polymorphisms. J Stat Soft . 16 Code
Snippet 3
33. Rozas J, Sanchez-DelBarrio JC, Messeguer X, Rozas R: DnaSP, DNA
polymorphism analyses by the coalescent and other meth-
ods. Bioinformatics 2003, 19:2496-2497.
34. Nei M: Molecular Evolutionary Genetics. Columbia University
Press, New York; 1987:512.