Analysis of Pesticides in Food and Environmental Samples - Chapter 4 ppt
Bạn đang xem bản rút gọn của tài liệu. Xem và tải ngay bản đầy đủ của tài liệu tại đây (418.73 KB, 30 trang )
4
Immunoassays
and Biosensors
Jeanette M. Van Emon, Jane C. Chuang,
Kilian Dill, and Guohua Xiong
CONTENTS
4.1 Introduction 95
4.2 Immunoassays 97
4.2.1 General Overview for Immunoassays 97
4.2.2 Method Development 98
4.2.3 ELISA Methods for Pesticides 100
4.2.4 Data Analysis 106
4.3 Biosensors 108
4.3.1 General Descriptions 108
4.3.2 Microarrays 111
4.3.3 Biosensors Methods for Pesticides 112
4.3.3.1 Potentiometric, Light Addressable Potentiometric
Sensor, and Amperometric Detection 112
4.3.3.2 Piezoelectric Measurements 113
4.3.3.3 Surface Plasmon Resonance 113
4.3.3.4 Conductive Polymers 114
4.4 Current Developments 115
4.5 Future Trends 115
References 117
4.1 INTRODUCTION
Monitoring and exposure data are critical to accurately determine the impact of
pesticides and environmental contaminants on human health [1]. This is especially
true for infants and young children, as well as the elderly and those with compromised
immune systems. Uncertainties in the assessment of human exp osures to exogenous
compounds may be reduced using data obtained from dietary and environmental
Notice: The U.S. Environmental Protection Agency (EPA), through its Office of Research and
Development, funded and collaborated in the research described here under Contracts 68-D99-011 and
EP-D04-068 to Battelle. It has been subjected to agency review and approved for publication. Mention of
trade names or commercial products does not constitute endorsement or recommendation for use.
ß 2007 by Taylor & Francis Group, LLC.
monitoring measurement studies. Faster and more cost-effective analytical methods
can facilitate the collection of data concerning particular target analytes that may
impact human health and the environment. Immunoassays and biosensors can provide
fast, reliable, and cost-effective monitoring and measurement methods [2].
In 1993, the United States National Academy of Sciences (NAS) issued a major
report on pesticides in the diet of children. The report, ‘‘Pesticides in the Diets of
Infants and Children’’ [3] recommended that U.S. pesticide laws be revised to make
foods safer for children. The Food Quality Protection Act [4] of 1996 was passed in
response to the Academy’s report. The FQPA is predicated on the need to reduce
exposure to pesticides in foods particularly for vulnerable groups. The purpose of
the FQPA is to eliminate high-risk pesticide uses, not to eliminate pesticide use
entirely. The Academy report recommended that pesticide residue monitoring pro-
grams target foods often consumed by children, and that analytical testing methods
be standardized, validated, and subjected to strict quality control and quality assur-
ance programs [3].
The FQPA requires the U.S. Environmental Protection Agency (EPA) to look at
all routes and sources (i.e., food, air, water, pets, indoor environments) when setting
limits on the amount of pesticides that can remain in food. Based on these require-
ments and the recommendations in the Academy’s report, there are major analytical
challenges to fully implement the FQPA. Dietary and nondietary exposures must
now be consi dered in an integrated manner. This aggregate exposure approach
clearly requires cost-effective analytical methods for a variety of analytes in different
matrices.
Immunoassay detection methods were initially developed for clinical applica-
tions where their sensitivity and selectivity provided improvements in diagnostic
capabilities. Clinical chemists developed highly successful methods for medical and
health-care applications by leveraging the sensitivity and selectivity of the specific
antibody interaction with large target analytes such as drugs, hormones, bacteria, and
toxins. Pesticide residue chemists recognized the potential of immunochemical
technology for small molecule detection in the 1970s [5]. Since that time, immuno-
assays have been succes sfully adapted for the analysis of a wide range of pesticides
[6] and other potential environmental contaminants including PCBs, PAHs, dioxins,
and metals [7–10].
Immunoassay methods range from high sample throughput methods, providing
cost-effective analytical detection for large-scale monitoring studies [11], to
self-contained rapid testing formats. Immunoassays can provide rapid screening
information or quantitative data to fulfill stringent data quality requirements. These
methods have been used for the selective analyses of many compounds of environ-
mental and human healt h concern. For water-soluble pesticides or compounds with
low volatility, immunoassays can be faster, less expensive, and significantly more
sensitive and reproducible than many other analytical procedures.
Biosensor technology also had its genesis in clinical applications. Medi cal
diagnostic sensors designed for point-of-care use are small, portable devices,
easy-to-use, and give rapid, quantitative results. These attributes are also important
for unattended remote sensing of environmental contaminants and for monitoring
pesticides and pesticide biomarkers [12]. Several pesticide biosensors have been
reported for various monitoring situations [13–17].
ß 2007 by Taylor & Francis Group, LLC.
4.2 IMMUNOASSAYS
All immunochemical methods are based on selective antibodies combining with a
particular target analyte or analyte group. The selective binding between an antibody
and a pesticide analyte has been used to analyze a variety of sample matrices for
pesticide residues. Methods range from the de termination of pesticide dislodgeable
foliar residues on crops to monitoring diet ary consumption, dust and soil exposures,
and determining pesticide biomarkers in urine [18,19].
4.2.1 GENERAL OVERVIEW FOR IMMUNOASSAYS
Immunoassays have been routinely used in medical and clinical settings for the
quantitative determination of proteins, hormones, and drugs with a molecular mass
of several thousand Daltons (Da). Immunoassay techniques including the enzyme-
linked immunosorbent assay (ELISA) have also proven useful for environmental
monitoring and human observational monitoring studies [6,19]. Common environ-
mental pollutants (i.e., pesticides) are typically small molecules with a molecular
mass of <1000 Da. This small size will not elicit antibody production. Small
molecules (haptens) can be used for antibody production when conjugated to carrier
molecules such as proteins. The small molecule of interest is usually modified to
introduce a chemical moiety capable of covalent binding. The small molecule, or
hapten, is then converted to an immunogenic substance through conjugation to the
carrier molecule for antibody production. The design of a hapten greatly affects
the selectivity and sensitivity of the resulting antibody. The distinguishing features of
the small molecule must be preserved while introducing an additional chemical
group (i.e., –COOH, –OH, –SH, –NH
2
) and linker chain or spacer arm for binding
[5]. Hapten design, hapten synthesis , and antibody production are among the critical
initial steps in developing immunoassays for small environmental pollutants.
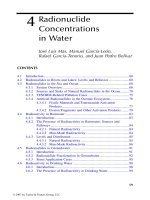
A stepwise diagram for an ELISA is shown in Figure 4.1. This format is based
on the immobilization of an antigen (i.e., the target analyte hapten conjugated to a
Ag/Ab mix is added to Ag-coated wells
Ab–Enzyme complex added
Substrate added to produce color chan
g
e
Ag is immobilized to the plate
Wash
Wash
Wash
FIGURE 4.1 Indirect competitive ELISA.
ß 2007 by Taylor & Francis Group, LLC.
protein) to a solid-phase support such as a test tube or a 96-well microtiter plate [20].
The sample extract for a microplate format (in a water-soluble solvent) and a solution
of specific antibody (typically in phosphate-buffered saline [PBS] pH 7.4 containing
0.5% Tween 20) are added to the antigen-sensitized wells. The target analyte in
solution and the immobilized antigen compete for binding sites on the specific
antibody. The wells are rinsed with buffer to remove antibody not bound to the
solid-phase antigen. The amount of antibody that can bind to the immobilized
antigen on the plate is inversely related to the amount of analyte in the sample. A
secondary antibody (species-specific that binds to the primary antibody) labeled with
an enzyme (antibody-enzyme conjugate) is added to help visualize the presence of
the bound primary antibody. Alkaline phosphatase and horseradish peroxidase are
two commonly used enzyme labels. Another buffer rinse removes unbound excess
enzyme-labeled secondary antibody. The addition of a chromogenic substrate pro-
duces a colored end product that can be measured spectrophotometrically or kinet-
ically for quantitation of analyte. This indirect competitive format is useful to support
large observational studies due to its high sample throughput, adaptation to automa-
tion, availability of commercial labels and substrates, and the high-performance
level that can be achieved. For extremely high sample throughput capability, micro-
titer plates containing 384 microwells can be used. In-depth details on how to
develop antibodies and immunoassays, as well as data analysis are presented by
Van Emon [2].
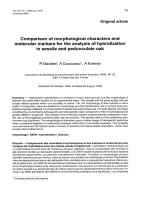
There are several permutations to the basic indirect competitive ELISA.
Figure 4.2 depicts an immunoa ssay form at using immobi lized antibody and an
enzyme-labeled tracer [21]. Analyte in the sample competes with a known amount
of enzyme-labeled analyte for binding sites on the immobilized antibody. In the
initial step, the antianalyte antibody is adsorbed to the side of a test tube or microtiter
plate well. The analyte and an enzyme-labeled analyte are next added to the
antibody-coated wells and competition for antibody binding occurs. After an incu-
bation step, all unbound reagents are rinsed from the wells. Substrate is added for
color development that is inversely related to the concentration of analyte present in
the sample. This particular format is commonly used in immunoassay testing kits as
a few procedural steps are eliminated. However, this format does not have the
convenience of commercially available reagents (i.e., enzyme-labeled secondary
antibody) and requires the synthesis or labeling of either the analyte or hapten
which may not be straightforward.
4.2.2 METHOD DEVELOPMENT
The development of an immunoassay method closely parallels the steps necessary
for an instrumental analysis. A critical step is presenting the analyte to the detector
(e.g., antibody, mass spectrometer, electron capture, flame ionization) in a form that
the detector can recognize. A major difference is typically the extent of sample
preparation required for an immunoassay. Frequently, immunoassays do not require
the same amount of sample cleanup as an instrumental method, providing savings in
time and costs. Many methods have reported simply using a dilution series to remove
interfering matrix substances [22,23]. Solid-phase extraction (SPE) can be used for
ß 2007 by Taylor & Francis Group, LLC.
either unprocessed samples or in tandem with accelerated solvent extraction (ASE)
methods [24–28]. Key to successful methods development is presenting the analyte
to the antibody in a manner that is compatible with antibody function. As antibodies
prefer an aqueous medi um, the sample extract must be soluble in the buffer in which
the immunoassay is performed.
Organic solvents, insoluble or miscible in water, can be used for the initial
extraction, provided extracts are exchanged into a compatible solvent such as
methanol or acetonitrile prior to ELISA. Methanol is one commonly used extraction
solvent for ELISA detection. Other organic solvents such as acetone, acetonitrile,
dichloromethane (DCM), or hexane can be used as an extraction solvent; however, a
solvent-exchange step into an assay-friendly solvent is necessary. The tolerance of
organic solvents must be determined in each specific method as it is dependent on the
immunoreagents employed. For complex sample matrices such as soil, sediment, and
fatty foods, extraction techniques and cleanup procedures may be required before
ELISA detection. The extraction techniques employed in instrumental methods
including shaking, sonication, supercritical fluid extraction (SFE), ASE, or SPE
have also been used for ELISA methods. The shaking method is common for field
applications. However, the shaking method may not provide adequate extraction
efficiency depending on the shaking time, analyte, and sample matrix [29].
The efficiency and reproducibility should be evaluated and documented for any
Analyte and enzyme-labeled hapten compete for antibody sites
Wash removes unbound analyte and labeled hapten
Substrate is added for color detection
Antibodies are immobilized to the plate
FIGURE 4.2 Direct competitive ELISA.
ß 2007 by Taylor & Francis Group, LLC.
extra ctio n techni ques before appli cation to field samp les. This can be accom plished
throu gh recover ies of target analytes from forti fied samp les.
4.2.3 ELISA METHODS FOR PESTICIDES
ELISA is a common form at that has been reported in the literat ure for deter mining
pesti cides and their metabolites in foods, as well as enviro nmental and biolog ical
samp le mat rices [2,5,23,2 8,30 –49]. These p esticides include organoc hlorine (OC)
and organop hosphor us (OP) compo unds, carbam ates, sulf onylure a pyrethroid s, and
many herbi cides. Depe nding on the speci ficity of the antibody and the desig n of the
hap ten, ELISA met hods can be very selec tive for a speci fic targe t pesticide and
used for quanti tative meas urem ents. Other met hods empl oying less selec tive anti-
bo dies, having a high c ross-react ivity for stru cturally similar pesticide s, can be used
as qualitative monitoring tools or to develop exposure equiva lency indices.
Tab les 4.1 and 4.2 summ arize some of the ELISA met hods develop ed for foods
as well as environmental and biological samples.
Assay performance must be demonstrated before applying the ELISA method
to field or study samples. For laboratory-based ELISA met hods, immunoreagents
such as antibodies and coating antigens may only be available from the source
laboratories while enzyme conjugates and substrates are commercially available.
Generally, the protocols provided by the source laboratories should be used as
starting points for determining optimal concentrations of immunoreagents for the
particular analysis. Checkerboard titrations can be performed to determine the
optimal concentrations of the antibodies and coating antigens. Whenever new lots
of immunoreagents are used, they should be examined for their performance with
previously used reagents. Protocols provided with commercial testing kits should be
followed in the specified manner and reagents used within the expiration date. Most
ELISA methods can offer comparable or better analytical precision (e.g., within
Æ20%) and accuracy (e.g., greater than Æ80% of expected value) as conventional
instrument methods for analyzing pesticides. Calibration curves based on standard
solutions must reflect the composition of the sample extract. Standards should be
prepared in the same buffer=solvent solution as the samples. Ideally, the standards
should also include the same amount of matrix as the samples. This is particularly
important when sample dilution is used as the cleanup. For example, if a food
extract contains 20% orange juice the standards should also contain 20% orange
juice (analyte-free before spiking). When assay performance is extremely well-
documented as to the extent of the matrix effect, the matrix may be omitte d and
a conversion factor applied to the buffer standard curve to account for the matrix in
the sample.
Recently, a laboratory-based ELISA method was adapted to determine 3-phenoxy
benzoic acid (3-PBA) in human urine samples collected in subsets from two obser-
vational field studies. 3-PBA is a common urinary metabolite for several pyrethroid
pesticides (cypermethrin, cyfluthrin, deltamethrin, esfenvalera te, perme thrin)
that contain the phenoxybenzyl group. The anti-PBA antibody had negligible cross-
reactivity toward the parent pyrethroids but also recognized and reacted with 4-fluoro-
3-PBA (FPBA). The cross-reactivity to the structurally similar FPBA was 72%
ß 2007 by Taylor & Francis Group, LLC.
TABLE 4.1
Examples of ELISA Methods for Determining Pesticides and Metabolites in Foods
Analyte Food Matrix Assay Format LOD References
2,4-D Apple, grape, potato, orange, peach Magnetic particle, DC ELISA 5 ppb [34]
Acephate Analyte-fortified tap water,
mulberry leaves, lettuce
IC ELISA 2 ng=mL [39]
Acetamiprid Fruits, vegetables DC ELISA 0.053 ng=g [46]
Alachlor, carbofuran,
atrazine, benomyl, 2,4-D
Beef liver, beef Magnetic particle DC ELISA
(per each analyte)
1–14 ppb [33]
Atrazine Extra virgin olive oil Plate DC and DC sensor ELISA 0.7 ng=mL [50]
Azoxystrobin Grape extract ELISA, FPIA, TR-FIA 3 pg=mL (ELISA) [51]
36 pg=mL (PFIA)
28 pg=mL (TR-FIA)
Carbaryl (1-naphthyl
methyl carbamate)
Apple, Chinese cabbage,
rice, barley
Test tube, ELISA 0.7 ng=g [15]
Carbaryl, endosulfan Rice, oat, carrot, green pepper Flow-through and lateral-flow,
membrane-based gold particles
10–100 ng=mL [52]
Chlorpyrifos Fruits and vegetables DC ELISA 0.32 ng=mL [45]
Chlorpyrifos Olive oil Microtiter plate IC ELISA 0.3 ng=mL [42]
DDT and metabolites Drinking water, various foods ELISA-CL 0.06 ng=mL (DDT) [37]
0.04 ng=mL (metabolites)
(continued )
ß 2007 by Taylor & Francis Group, LLC.
TABLE 4.1 (continued)
Examples of ELISA Methods for Determining Pesticides and Metabolites in Foods
Analyte Food Matrix Assay Format LOD References
Difenzoquat Beer, cereal, bread IC ELISA 0.8 ng=mL (beer) [35]
16.0 ng=g (cereals)
Fenazaquin Apple and pear IC ELISA 8 ng=mL [40]
Fenitrothion Apple and peach DC ELISA microtiter plate 20.0 ng=g [47]
Fenthion Vegetable samples Microtiter plate DC ELISA
and dipstick ELISA
0.1 ng=mL (plate)
0.5 ng=mL (dipstick)
[53]
Imidacloprid Fortified water samples Microtiter plate IC ELISA 0.5 ng=mL [54]
Imidacloprid Fruit juices Microtiter DC ELISA 5–20 ng=mL [49]
Iprodione Apple, cucumber, eggplant Microtiter plate DC ELISA 0.3 ng=g [48]
Isofenphos Fortified rice and lettuce IC ELISA 5.8 ng=mL [55]
Methyl parathion
and parathion
Water and several food matrices DC ELISA 0.05 ng=mL (methyl parathion),
0.5 ng=mL (parathion)
[56]
Methyl parathion Vegetable, fruit IC and DC ELISA; FPIA IC: 0.08 ng=mL; DC: 0.5 ng=mL;
FPIA: 15 ng=mL
[41]
Pirimiphos-methyl Spiked grains IC ELISA 0.07 ng=mL [57]
Tebufenozide Red and white wine DC ELISA 10 ng=mL [58]
CL, Chemiluminescence; DC, direct competitive; IC, indirect competitive; PFIA, fluorescence polarization immunoassay; TR-FIA, time-resolved fluorescence immunoassay;
ELISA, enzyme-linked immunosorbent assay.
ß 2007 by Taylor & Francis Group, LLC.
TABLE 4.2
Examples of ELISA Methods for Determining Pesticides and Metabolites in Biological and Environmental Samples
Analyte Sample Matrix Assay Format LOD References
2,4-D Urine Microtiter plate IC ELISA 30 ng=mL in urine [23]
3,5,6-TCP Urine Microtiter plate IC ELISA 1 ng=mL in urine [38]
3,5,6-TCP Dust, soil Magnetic particle DC ELISA 0.25 ng=mL in assay buffer [38]
4-Nitrophenol parathion Soil Microtiter plate IC ELISA 0.2–1ng=mL buffer [25]
Atrazine mercapturic acid Urine Microtiter plate IC ELISA 0.05–0.3 ng=mL in urine [22,28]
DDE Soil Microtiter plate IC ELISA IC
50
¼ 20 ng=mL [59]
Glycine conjugate of cis=trans-DCCA Urine Microtiter plate IC ELISA 1 ng=mL in urine [27]
Glyphosate, atrazine,
metolachlor mercapturate
Water, urine Multiplexed fluorescence
microbead immunoassay
0.03–0.11 ng=mL [60]
Methyl parathion Soil Microtiter plate IC and
DC ELISA and FPIA
0.08 ng=mL (IC) [41]
0.5 ng=mL (DC)
15 ng=mL (FPIA)
Triazine herbicides Surface water,
groundwater
Test tube DC ELISA 0.2–2ng=mL in water [24]
FPIA, Fluorescence polarization immunoassay; IC, indirect competitive; DC, direct competitive; ELISA, enzyme-linked immunosorbent assay.
ß 2007 by Taylor & Francis Group, LLC.
as reported by the source laboratory [61]. FPBA is the metabolite for cy fluthrin
(a pyrethroid pesticide containing a fluorophenoxybenzyl group). This high cross-
reactivity is advantageous as this 3-PBA ELISA can be used as a monitoring tool
for determining a broad exposure to pyrethroids. For assay development, the anti-PBA
antibody, coating antigen, and initial assay protocol were provided by the source
laboratory. Checkerboard titration experiment s were performed to determine
the optimal concentrations of anti-PBA antibody, coating antigen, and a commercial
enzyme-conjugated secondary antibody. The optimal conditions established for
the 3-PBA ELISA were 0.5 ng=mL of coating antigen, a 1:4000 dilution of anti-
PBA antibody, and a dilution of 1:6000 of the commercial enzyme-labeled secondary
antibody conjugate (goat anti-rabbit labeled with horseradish peroxidase). The
assay procedures were modified by preparing the standard solutions in a 10% metha-
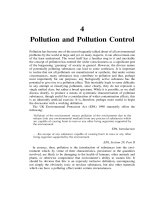
nol extract of 10% hydrolyzed drug-free urine in PBS. Calibration curves (Figure 4.3)
for 3-PBA were generated based on 10 concentration levels ranging from
0.00256 to 500 ng=mL (1:5 dilution series). The percent relative standard deviation
(%RSD) values of the triplicate analyses were <20% for the standard solutions.
Day-to-day variation for the quality control (QC) standard solution (1.0 ng=mL) was
within 13.1% (1.2 Æ 0.16 ng=mL) over a period of 4 months. The estimated assay
detection limit was 0.2 ng=mL. Quantitative recoveries of 3-PBA were achieved
by ELISA (92% Æ 18%) in the fortified urine samples. Approximately 100 human
urine samples were prepared and analyzed by the ELISA method. Different aliquots
of the urine samples were also analyzed by gas chromatography=mass spectrometry
(GC=MS). The GC=MS results indicated that 3-PBA was detected in 95% of the
samples, whereas FPBA was only detected in 8.4% (10 out of 119 samples) of
the samples. Similar results suggesting that FPBA was detected at much lower
rate than 3-PBA in human urine samples collected from residential settings was also
Concentration (ng/mL)
Mean OD (450 nm)
0.001 0.01 0.1 1 10 100
0.19
0.29
0.39
0.49
0.59
0.69
0.79
0.89
3-PBA standard curve
y = ((A Ϫ D )/(1 + (x /C )
B
)) + D: A B C D R
2
Std PBA Curve (Standards: Conc. (ng/mL) vs. Mean OD) 0.961 1.132 1.445 0.182 0.997
FIGURE 4.3 Calibration curve for 3-PBA immunoassay.
ß 2007 by Taylor & Francis Group, LLC.
reported in the CDC third National Report on Human Exposure to Environmental
Chemicals [62]. The ELISA-derived 3-PBA concentrations correlated well with
the GC=MS results. The Pearson correlation coefficient between the 3-PBA concen-
trations of the two methods was 0.952, which was statistically significant
( p < 0.0001). A nonsignificance outcome (p ¼ 0.756) was also observed from the
paired t-test indicating that there was no significant difference in measurements
between the two analytical methods (ELISA vs. GC=MS) for a given sample. This
study demonstrated that the ELISA method could be used as a monitoring tool for the
urinary biomarker, 3-PBA in human urine samples, for assessing human exposure to
pyrethroids.
As most fruit and vegetable baby food preparations generally contain a signifi-
cant amount (>80%) of water, ELISA methods have the advantage over instrumental
methods in determin ing pesticides in this aqueous sample matrix. We investigated
various sample preparation methods for determining pesticides in baby foods using
either GC=MS or ELISA methods [26]. A streamlined direct ELISA method con-
sisting of dilution, filtration, and ELISA was evaluated on spiked baby foods at 1, 2,
5, 10, or 20 ppb. Quantitative recoveries (90%–140%) were achieved for atrazine in
the nonfat baby foods (i.e., pear, apple sauce, carrot, banana=tapioca, green bean).
The performance of other ELISA testing kits was not as good as the atrazine-ELISA
testing kit. Over-recoveries were observed for carbofuran and metolachlor testing
kits in banana=tapioca and green bean. This was probably due to a sample matrix
interference that was not completely removed by dilution. An off-line coupling of
enhanced solvent extraction (ESE) with ELISA was developed to determine atrazine
in a more complex sample matrix of fatty baby foods. The results indicated that the
extraction temperature was an important factor to recover atrazine. The ESE-ELISA
method consisted of extracting the food at 1508C and 2000 psi with water and
performing ELISA on the aqueous extract.
In an on-going study, different sample preparation procedures are being inves-
tigated for a magnetic particle ELISA analysis for permethrin. Quantitative recover-
ies (>90%) were obtained when the fortified soil samples were extracted with
sonication using DCM, methyl-t-butyl ether (MTBE) or 10% ethyl ether (EE) in
hexane. Recoveries were <50% from the fortified soil samples when the shaking
method was employed (shaking with methanol for 1 h). A longer shaking time (16 h,
overnight) was evaluated, using methanol, yielding recoveries of over 200% by
ELISA. The longer shaking time extracted substances that interfered with the
ELISA detection. This interference was also detected in the GC=MS analysis and
persisted even after the SPE cleanup. Satisfactory recovery data (>90%) for post-
spiked dust samples and a spiked dust sample were obtained. DCM was selected as
the extraction solvent, as it was easily evaporated, facilitating the solvent-exchange
step. The collected field samples were extracted with DCM using sonication. The
DCM extract was concentrated and solvent exchanged into methanol. The methanol
extract was diluted with reagent water (1:1) before ELISA.
Interferences caused by sample matrix components are a concern for both
conventional instrument methods and ELISA methods. In immunoassays, sample
matrix effects may result from nonspecifi c binding of the analyte to the matrix as
well as the matrix to the antibody or enzyme or denaturation of the antibody or
enzyme. The matrix interferences can often be removed by a series of dilutions if
ß 2007 by Taylor & Francis Group, LLC.
a practical detection limit can still be achieved [23]. Alternatively, cleanup methods
for instrumental methods (e.g., SPE or column chromatographic separation) can
also be performed before ELISA detection. Another effective cleanup method is
immunoaffinity column chromatography that can be applied for the purification of
sample extracts for either instrumental or ELISA detection [2,63].
In a recent study [64], an effective bioanalytical method for atrazine in complex
sample media (soil, sediment, and duplicate-diet food samples) was developed. The
method consisted of an ASE procedure with DCM, followed by immunoaffinity
column cleanup with detection by a magnetic particle ELISA. Quantitative recover-
ies were achieved in fortified soil and sediment (93% Æ 17%) as well as in food
(100% Æ 15%) samples. The ELISA data were in good agreement with the GC=MS
data for these samples (the Pearson correlation coefficient was 0.994 for soil and
sediment and 0.948 for food). However, the ELISA values were slightly higher than
those obtained by GC=MS. This was probably the result of the solvent-exchange step
required for the GC=MS but not the ELISA. This bioanalytical approach is more
streamlined than the GC=MS analysis and could be applied to future large-scale
environmental moni toring and human exposure studies.
4.2.4 DATA ANALYSIS
Calculations of sample analyte concentrations in ELISA methods are similar to those
used in instrumental methods. A set of standard solutions covering the working
range of the method is used to generate the calibration curve, and the concentration
of target analyte is calculated according to the calibration data. For the 96-microwell
format, it is easy to include a standard curve on each plate along with the samples.
Thus, a calibration curve can be generated in the same 96-microwell plate along with
the samples. For test tube formats, a standard curve series can be interspersed
among the samples. Many mathematical models have been used to construct
ELISA calibration curves including four-parameter logistic-log, log–log transforms,
logistic-log transforms, and other models. The four- parameter logistic-log model is
commonly used for 96-microwell plate assays and is built into commercial data
analysis software [65]. The four-parameter logistic-log model is described as fol-
lows: y ¼ (AÀD)=(1 þ (x=C)
B
) þ D where x is the concentration of the analyte and y
is the absorbance for colorimetric end point determinati ons.
Specifications are determined from each calibration curve for an expected mid-
point on the curve at 50% inhibition (IC
50
), a maximum absorbance for the lower
asymptote (A), and a minimum absorbance for the upper asymptote (D). An estab-
lished ELISA method usually has well-documented historical data for the specifica-
tions of the curve-fit constants, such as the slope of the curve (B), and central point of
the linear portion of the curve (C). The specific curve-fit constants may vary from
day to day and the accepted ranges of such variations must be determined and
documented. Triplicate analyses of each stand ard, control, and sample are generally
performed for 96-microwell plate assays. The %RSD of measured concentrations
from triplicate analysis is usually within Æ30% and can be as low as Æ10%,
depending on the specific assay and required data quality objectives. Recoveries of
positive controls and back-calculated standard solutions typically range from 70% to
130% or better. If the results of the samples are outside the calibration range, the
ß 2007 by Taylor & Francis Group, LLC.
sample is diluted and reanalyzed. Effects of the sample matrix can be determined by
analyzing a number of samples at different dilutions. Typically, results from different
dilutions should be within Æ30%. Larger variations in the data sugges t a matrix
interference problem, indicating cleanup procedures may be necessary.
When a commercial ELISA testing kit is used as a quantitative ELISA method,
similar assay performance is expected as those previously described for laboratory-
based 96-microwell plate assays . The samples need to be diluted and reanalyzed if
the results of the samples are outside the calibration range. However , some of the
commercial magnetic particle ELISA testing kits have a small dynamic optical
density range (i.e., 1.0– 0.35 OD) and small changes in OD correlate to large changes
in derived concentrations. The differences between absorbance values and duplicate
assays are generally small, and are well within the acceptance requirement (<10%)
for the calibration standard solutions. However, the percent difference (%D) of the
derived concentrations of the standard solution from duplicate assays sometimes may
exceed 30%. The greater %D values obtained for some of the measured concentra-
tions for the standards and samp les may be due to a small volume of standard or
sample retained in the pipette tip during the transfer step [8]. If the ELISA testing kit
is to be used as a quantitative method, extreme care should be taken when transfer-
ring each aliquot of standard or sample. A trace amount of aliquot not delivered may
result in a large variation in the data from duplicate analyses. The analyst should be
alert in following the protocol when performing the assay.
To ensure the quality of the ELISA data, analytical quality control (QC) meas-
ures need to be integrated into the overall ELISA method. The QC samples may
include: (1) negative and positive control standard solutions, (2) calibration standard
solutions, (3) laboratory and field method blank, (4) fortified matrix samples, and (5)
duplicate field samples. The assay performance can be monitored by characterization
of the calibration curve and the data generated from the QC samples. The QC results
will provide critical information such as assay precision, accuracy, detection limit, as
well as overall method precision (including sample preparation and=or cleanup),
accuracy, and detection limit when evaluating and interpreting the ELISA data.
Before applying an ELISA method for field application, the ELISA method
needs to be evaluated and validated for its performance. The data generated from
the ELISA method are usually compared with the data generated by a conventional
instrument method (e.g., GC=MS). Various types of stat istical analyses have been
employed to compare the results between ELISA and GC=MS. For example, the
Pearson correlation coefficient, commonly used, measures the extent of a general
linear association between the ELISA and GC=MS data, and a parametric statistical
test is perfor med to determine whether the calculated value of this correlation
coefficient was significantly positive [66]. The slope of the established linear regres-
sion equation can also be used as guidance to determine if a 1:1 relationship exists
for the ELISA and GC=MS data. The paired t-test [67] can be used to determine
whether the measured ELISA and GC=MS concentrations differ significantl y for a
given sample at a 0.05 or 0.01 level of significance. Other nonparametric tests,
namely, the Wilcoxon signe d-rank test and the sign test, can also be performed
on the sample-specific differences between ELISA and GC=MS data. These non-
parametric tests can be used to determine if the median difference between the
ELISA and GC=MS measurem ents among the samples is significantly different
ß 2007 by Taylor & Francis Group, LLC.
from zero [68]. The Wilcoxon signe d-rank test is applied to diff erences betw een log-
trans formed meas uremen ts, as this test assumes that the diff erences hav e a symmet -
ric distrib ution. In contrast, the sign test does not make this assumpti on and therefore
do es not require log transform ations of the data. The McNemar ’ s test of associ ation
can also be perfor med to deter mine whether there is any signi fi cant diff erence
betw een the two met hods in the propor tion of samp les having measurabl e levels
that were at or above a speci fied thres hold. The fals e-negative and fals e-positive rates
can then be obtained at the speci fi ed concen tration level .
4.3 BIOSENSORS
Bio sensors are analytical probes compo sed of tw o c omponents : a biol ogical recog-
niti on e lement such as a selec tive anti body, enzyme, recept or, DNA, mic roorga nism,
or cell, and a transducer that convert s the biological recogniti on event into a
meas urabl e physi cal signa l to quanti tate the amoun t of analyt e presen t. Biosens ors
must rapid ly regener ate to provi de contin uous monitor ing data, yielding a respon se
in real time. Analyti cal consi derations such a s sample p reparation , mat rix effects,
and quality contr ol measures must also be addres sed in biose nsor d evelopment .
Matr ix effects and the effect of sample on the recogni tion element are key issues
for unattended sensor s. Sensors that are easily foule d have limite d reliabil ity and
app lication for envir onmen tal monitor ing. Since biosensors use a biological recog-
nition element, they may provide information on the effects of toxic substances as
well as analytical measurements. Sensors for biochemical responses may assist in
toxicity studies or human exposure assessments. Several pesticide biosensors have
bee n report ed for detecting va rious pesticide s. Tab le 4.3 illustrates the application of
biosensor technology to pesticide monitoring.
4.3.1 GENERAL DESCRIPTIONS
Biosensors can provide rapid and continuous in situ, measurements for on-site or
remote monitoring. Several different transducer types such as optical, electrochem-
ical, piezoelectric, and thermometric can be employed. Immunosensors contain
specific antibodies for biological recognition and a transducer that converts the
binding event of antibody to antigen to a physical signal.
Antibodies may be immobilized on membranes, magnetic beads, optical fibers;
or embedded in polymers, or placed on metallic surfaces. In some types of sensors,
such as those employing surface plasmon resonance (SPR), evanescent waves, or
piezoelectric crystals, the binding of antigen and antibody can be detected directly.
With other transducers, an indicator molecule (either a labeled antigen or labeled
secondary antibody) is required. An indicator may be fluorescent or it may be an
enzyme that alters a colorimetric or fluorescent signal or produces a change in pH
affecting the electrochemical parameters.
Optical biosensors may measure fluorescence, fluorescence transfer, fluores-
cence lifetime, time-resolved fluorescence, color (either by absorbance or reflect-
ance), evanescent waves, or an SPR response. Optical immunosensors are very rapid
as they detect the antigen=antibody bindi ng directly without requiring labeled
reagents. Data in real time can be generated with devices applied to continuous
ß 2007 by Taylor & Francis Group, LLC.
TABLE 4.3
Examples of Biosensors for Determining Pesticides and Metabolites in Biological and Environmental Samples
Analyte Sensor Type Matrix Range or LOD References
Atrazine Electrochemical immunosensor Orange juice 0.03 nmol=L [17]
Atrazine Electrochemical magnetoimmunosensor Orange juice 0.027 nmol=L [69]
Carbaryl, paraoxon Disposable screen-printed thick-film electrode Milk 20 mg=L (carbaryl) [70]
1 mg=L (paraoxon)
Carbofuran Flow-injection electrochemical biosensor Fruits, vegetables,
dairy products
1–100 nmol [71]
Dichlorvos Flow-injection calorimetric biosensor Water 1 mg=L [72]
Dichlorvos Electrochemical biosensor Wheat 0.02 mg=g [73]
Fenthion Dipstick electrochemical immunosensor Water 0.01–1000 mg=L [74]
Malathion, dimethoate Amperometric biosensor Vegetables Malathion: 0.01–0.59 mM [14]
Dimethoate: 8.6–520 mM
OP pesticides Fluorescence-based fiber-optic sensor Buffer 1–800 mM (paraoxon) [75]
2–400 mM (DFP
a
)
OP pesticides and nerve agents Electrochemical sensor using
nanoparticles (ZrO
2
) as selective sorbents
Water 1–3ng=mL [76]
OP pesticides and nerve agents Flow-injection amperometric biosensor using
carbon nanotube-modified glassy carbon electrode
Water 0.4 pM [77]
Thiabendazole Fluorescence-based optical sensor Citrus fruits 0.09 mg=kg [16]
a
Diisopropyl phosphorofluoridate (a nerve agent).
ß 2007 by Taylor & Francis Group, LLC.
moni toring situati ons such as ef fluent or runoff meas urem ents from hazardo us or
agric ultu ral was te stre ams. Opt ical immunos ensors based on SPR employ immobil-
ized speci fi c anti body on a met al layer . When antige n binds , there is a min ute change
in the refractiv e index that is meas ured as a shift in the angle of total absorp tion of
ligh t inci dent on the metal layer. This technique was used to develo p an SPR sensor
to detect atraz ine at 0.05 pp b in drinking water [78].
Fiber opti c biose nsors are based on the trans mission of light along silica glass or
plast ic fibers. The advant ages of fiber opti c sensor s are numer ous: they are not
subje cted to elect rical inte rference; a reference electrode is not ne eded; immobi lized
reagent does not have to be in contac t wi th the optical fiber; they can be miniat urized;
and they are highl y stable. A maj or advant age of these sensor s is that they can
respon d sim ultaneousl y to more than one analyt e and are useful for remotely
moni toring hazardo us environmen ts or municipal water suppl ies.
Electrochem ical biose nsors offer the advant ages of being effect ive with color ed
or opaque mat rices and do not contain light-s ensitive compo nents . In an immuno-
sensor form at, the bindi ng of antigen to anti body is visualize d as an electrica l signal.
The respon se may be couple d to signal ampl ifi cation systems such as an enzym e-
con jugated seconda ry a ntibody, confer ring very low detection limit s. Amperom etric
sensor s meas ure curren t when an elect roact ive speci es is oxidi zed or reduced at the
elect rode. Potent iometri c sensor s detect the c hange in charge of a n antibody when it
binds to an a ntigen. Org anophos phorus pesticide s may be detect ed in a numbe r of
ways incl uding potent iometric or amper ometric met hods. In bo th of these cases,
enz ymes such as organop hosphor us hydrol ase or urease may be employed. Depe n-
den t on the structure of the analyte, the relea se of hyd rogen ions can eith er be
meas ured via a pH change or a p-nit ropheno l (PNP) group may be produce d to
give a redox compo und for an elect ron shutt le.
Piezoelectr ic crystals are nonme tallic min erals (usual ly quartz), which conduct
elect ricity and which develo p a surfa ce charge when stre tched or compressed along an
axis. The crystals vibrate when placed in a n alternating elect ric field. The freque ncy of
the vibra tion is a funct ion of the mass of the crystal. Antibod ies can be immobi lized to
the surfa ce of piezoe lectric crystals and the new vibra tional freque ncy deter mine d as a
basel ine meas urem ent. The bindi ng of analyte to the imm obilized anti body alters the
mass and v ibrationa l frequency of the antibody –cryst al system. This change in
vibra tion ca n b e meas ured to determin e the amoun t of analyte detect ed.
Electroconduc tive polym er sensor s have a speci fic anti body embed ded in a
con ducting polymer matrix such as polypy rrole. When an analyte binds to the
antibody, the ions in the matrix are less free to move, which decreases the ability
of the polymer to conduct current. A reagentless electrochemical DNA biosensor has
been reported using an Au–Ag nanocomposit e mat erial adsorbed to a conducting
polymeric polypyrrole [79]. The detection limit was 5.0 3 10
À10
M of target oligo-
nucleotides with a response time of 3 s. The integration of nanotechnology and
sensor development will provide new analytical platforms and formats. Although
new designs may first appear for clinical applications, these advancements will
favorably impact the development of sensors for environmental measurements.
Tab le 4.3 summ arizes severa l pesti cide biose nsors that have been reported for
various monitoring situations [14,16,17,69–77].
ß 2007 by Taylor & Francis Group, LLC.
4.3.2 MICROARRAYS
Microarrays contain minute amounts of materials (DNA, proteins, aptamers, etc.)
that are placed onto a matrix in an array format. The matrix is a solid support onto
which a biological or organic material is placed. The solid support material can be
plastic, glass, complimentary metal oxide semiconductor (CMOS), gold, platinum,
membranes, or other substance on which the reagents can be atta ched and still
maintain function. The method of attachment can be covalent, hydrophobic, or
through some tight-affinity reagent, such as a biotin=streptavidin couple [80].
A microarray can be defined in terms of the number of spots (or electrodes) per
chip=slide. By this definition, a low-density array may contain as little as 16 spots or
as many as 96 spots. High-density arrays may have >500,000 spots. Lower density
arrays are considered to be sensors, as microsensor detection is typically at the lower
end of array density. Based on these classifications, there are several companies that
produce lower density microsensor arrays (Antara Biosciences, and Osmetech Inter-
national, among others).
There are numerous met hods used for array production. Arrays may result from
‘‘spotting’’ onto activated surfaces using robots to produce high-density arrays.
Proteins or DNA are spotted onto activated surfaces (aldehydes, amines, etc.) so
that either a chemical bond is formed or prote ins can adhere through hydrophobic
interaction. Another means of producing arrays is by photolithography using masks
or lasers. This method has been used to produce in situ DNA- or peptide-based
arrays. In this specific case, a photolabile group is used on the 5
0
-nucleotide end or
photolabile groups are used as amino protection groups (peptides). The use of lasers
or masks removes the labile group from a specific electrode or spot, promoting
peptide bond or oligonucleotide bond formation. Conversely, this can also be
accomplished using acid that is generated at a specific electrode. DNA and peptides
can also be synth esized in this manner. The protecting groups are removed only at
specific electrodes that generate acid resulting in an elongated nucleotide or peptide.
The oligomers or peptides can be used as aptamers to capture specific molecules,
such as pesticides, heavy metals, or other environmental contaminants. The method
can also be extend ed to any synthesis procedure, providing an acid- or base-labile
group is present. Products from Antara Biosciences and Osmetech traditionally use
cyclic voltammetry (CV). In this mode, a redox active species is used in conjunction
with the assay. In arrays sold by CombiMatrix, the electrochemical amplification is
enzyme-based and reli es on a charge build up at a capacitor near that electrode. The
capacitor is discharged and the quantity of charge is converted to nanoamps. As the
current is determined by the charge buildup over time, this is an indirect measure-
ment for the current developed.
In the early developmental stages of either a microarray or a large sensor
technique, the starting point is typically one or two electrodes. Much of the recorded
electrochemical sensor data are based on just a few electrodes, as a particular
technique may or may not be converted to a microarray. The decision to convert
to a high-density array is dependent on many parameters such as readi ng times and
hardwire issues. Detection methods in microarr ays employ vario us techniques
including fluorescence, luminescence, visible, electrochemical, Raman scattering,
ß 2007 by Taylor & Francis Group, LLC.
SPR, and electrochem ilumin escence, among others. The detection met hod used
dep ends on the mat rix and if the chip is hardw ired. Typ ically, the light-bas ed met hod
can accom modat e alm ost any matrix a nd product ion met hod. However , a laser
scanner or CCD camer a is requi red, whic h tends to be very expensive increasing
star t-up costs (wh ich may excee d $50K ). Electr ochem ical methods require chip
hardw ire in tandem wi th vario us detect ion methods. Amperom etric detection, cy clic
vo ltammetry, and the evaluation of a charge build up on the electrode surfa ce have
all been empl oyed.
4.3.3 B IOSENSORS METHODS FOR P ESTICIDES
Se veral types of biosensors h ave been develo ped for measuring pesticide s in va rious
samp le medi a. However , the use of biosensors for obtain ing envir onmental meas -
urem ents is not as common as for immunoa ssay. This section presen ts the applica-
tion of biosensor techni ques for d etecting pesticide s and illust rates the potential of
vario us sensor desig ns for environmen tal moni toring.
4.3 .3.1 Pot entiom etric, Light Addr essable Poten tiometri c Sen sor,
an d Amperome tric Dete ction
Mole cular device s e mploy the use of a ‘‘ Light Addr essable Potentiom etric Sensor ’’
(L APS) for d etection on large arrays . The samp les are captured on membranes via
vac uum fi ltration into discr eet spots on a mem brane [81]. The d etection is pH-based
using a sensi tive LAPS method that can detect the urease enzym e convers ion of urea
in a pH- sensiti ve manne r (potentio metric readi ngs). Thi s techni que has been ap plied
to the herbicide atraz ine. As atrazine is a smal l mol ecule, a c ompetitive assay format
was develo ped. Fluorescein -labe led anti-atr azine antibodies and atraz ine covale ntly
link ed to biot in-DNP were used as reagent s. When the fluoresc ein-label ed anti body
is bo und to the biotinylated atrazine, the complex will bind to the streptavi din-coated
mem brane. If nonbio tinylat ed atraz ine (from the samp le) is added to the mix , any
anti body bound to this species will be washed away . Thus, in this competit ive assay
form at, the fluoresc ein-label ed anti-atr azine antibody can eith er bind to the nonla-
beled or biotin-l abeled atraz ine. A speci es-speci fic seconda ry antibo dy label ed with
urease react s with the bound anti-atraz ine an tibody to generat e a pH flux, providing
the signal for the LAPS sensor. In this mode, there is an inverse relationship between
signal and amount of nonlabeled analyte found in solution. The largest signal output
is seen when there is no atrazine present and the lowest signal is observed when a
large quantity of nonlabeled atrazine is present. Thus, if there is a large amount of
environmental atrazine measured, the signal will be low. The result is a sigmoidal
curve sim ilar to the one show n in Figure 4.3 for the ELISA to detect 3-PBA. Note
that the detection range tends to be narrow using this format (due to the sigmoidal
curve) and the sensitivity can be limited. This assay would be classified as a
biosensor as eight simultaneous assays can be performed using this system.
In addition to using a fluorogenic substrate for detection, other means may be
used to detect the presence of pesticide analytes in environmental samples. One of
the simplest techniques is a potentiometric sensor based on pH changes. In this case,
a simple biosensor that is sensitive to changes in pH would be adequate. The enzyme
ß 2007 by Taylor & Francis Group, LLC.
organophosphorus hydrolase needs only to be attached to the electrode, encom-
passed in a polymer and attached to a bioresin over the electrode for OP detection.
Organophosphorus hydrolase catalyzes the hydrolysis of a wide range of OP pesti-
cides (e.g., coumaphos, diazinon, dursban, ethyl parathion, met hyl parathion, and
paraoxon). The attached or trapped hydrolase then acts on the OP compound to
produce an alcohol and an acid. The resulting acid compound is monitored as a pH
change at the electrode. This is a very simple system to use and is similar to LAPS
detection.
Mulchandani et al. [82] developed an assay where organophosphorus hydrolase
was placed onto an electrode. The phosphate hydrolysis product was monitored by
measuring the curren t produced at the electrode. The output of the amperometric
sensor could be correlated to the concentration of pesticide in sample solutions of
soil and vegetation. This detection method can be incorporated into large arrays,
such as the one used by CombiMatrix on electroactive electrode arrays.
Another biosensor method is applicable to other OP compounds that produce
PNP as a releasing compound. These compounds include ethyl parathion, methyl
parathion, paraoxon, fenithrothion, and O-ethyl O-(4-nitrophenyl) phenylphospho-
nothioate (EPN). The released PNP is oxidized at the anode to insert a hydroxyl
group that is ortho to the nitro group. In this case, the oxidation current is measured
amperometrically at a fi xed potential. The signal is linear to the concentration of PNP
present. The analysis relies on the OP compound to be trapped or conjugated to
material over the electrode.
4.3.3.2 Piezoelectric Measurements
Many pesticides (e.g., organophosphates and carbamates) or their metabolites are
cholinesterase inhibitors. This phenomenon can be used to develop sensors for the
detection of these types of compo unds. Using a piezoelectric sensor format, para-
oxon was bound to an electrode (gold on a piezo=quartz surface) as the recognition
element [83]. The analysis was performed by allowing a cholinesterase to interact
with the modified electrode surface and with free paraoxon in a standard or sample.
An oscillation change can be observed in terms of hertz or an electronic occurrence.
A competitive assay was developed that allowed competition for cholinesterase
between a cholinesterase inhibiting pesticide in solution and the inhibitor bound to
the electrode surface. The ability of cholinesterase to bind to the paraoxon immo-
bilized on the electrode is minimized or prevented in the presence of free inhibitor
(analyte) in solution . In this case, the cholinesterase remains in solution bound to the
pesticide in the sample. The sensing surface can be regenerated for reuse. The format
can be used to develop better inhibitors and to quantitate OP compounds in solutions
of environmental samples.
4.3.3.3 Surface Plasmon Resonance
SPR technology has been used in the biosensor field for some time and many sensors
of this type are commercially available. The technique depends on the change in the
reflectance angle (Plasmon) due to mass changes at the surface. Binding of proteins
and small materials change the mass number at the surface and the reflectance angle
ß 2007 by Taylor & Francis Group, LLC.
is altered [84,85]. SPR detection has demonstrated the usage of many types of
compounds. Initially, the technique was applied only to large molecules but as the
technology has matured so has its potential for monitoring various pesticides,
including photosynthetic inhibitors.
The crux of the system is a gold film on a glass surface. Attached to the gold
film are self-assembled monolayers (SAMs) and capture reagents. These capture
reagents may be antibodies, receptors, enzymes, ssDNA, streptavidin, and protein
A or G (dependent on the type of antibody used) as well as other reagents. As the
specific species is captured, the mass on the chip surface increases and changes
the specificreflection angle. In this technique, a herbicide such as atrazine may be
detected in several modes. The simplest mode would be to attach an anti-atrazine
antibody (as a whole or in parts) to the chip surface. If the solution under test shows
the presence of atrazine, a signal response on the chip would be detected.
Another option would be to attach the photosynthetic reaction center (RC) from
a purple bacterium to the sensing chip. This can be accomplished in a number of
ways, but literat ure evidence suggests that histidine (His) tags can be conveniently
used. The system can easily be reused as the RC can be removed and the chip
regenerated once the assay is completed. Samples of atrazine are introduced and the
signal is monitored. A positive response can be quantitated and the chip can be
reactivated for the next sample.
4.3.3.4 Conductive Polymers
One way to increase the use of electrochemical detection methods is to use conduct-
ive polymers [86]. The concept is that the interference from sample components is
limited and many conductive polymers can be formed in situ directly over the
electrode. Most of the polymers that have been used are electrochemically derived
(synthesized in situ), formed by a host of starting materials. Additionally, many can
be tethered to electrochemical conducting wires or even be encapsulated in a
biopolymer matrix such as microgels [86–91]. A sensor using an electrodeposited
conductive layer was able to detect the herbicide diruo n [92] and could be applied to
other substituted urea compounds.
For this technique to function, an enzymatic system is often used, such as
glucose oxidase. Other enzymes may be employed, dependent on the nature of the
biosensor developed and the anticipated monitoring applications. One application
that appears to dominate for commercial development is that of a glucose sensor.
Glucose is converted to gluconic acid and amperometric signals are observed based
on the production of hydrogen peroxide. The polymer may encapsulate the electrode
or be placed on the electrode using microparticle slurries.
Another polymer that can be used is a water-soluble Os-poly(vinyl imidazole)
redox hydrogel. Again, the electron transfer is very efficient and necessitates a redox
enzyme placed in the gel. A polypyrrole film has also been used in conjunction with
NADH
þ
ferro-=ferricyanide redox chemistries. An enzyme is required whose func-
tion is to use NADP
þ
in conjunction with an enzymatic substrate to release a product
and the cofactor, NADPH. The ferricyanide is present to efficiently shuttle the
electrons.
ß 2007 by Taylor & Francis Group, LLC.
There are also reports on the use of PVPOs(bpy) polymer and poly(mercapto-
p-benzoquinone) on gold electrodes or within conducting hydrogels. For these
systems, the redox enzyme horseradish peroxidase is used or the CV of the substrate,
sulfo-p-benzoquinone (SBQ) is monitored. The types of solid supports and electro-
chemical methods are almost limitless.
4.4 CURRENT DEVELOPMENTS
Immunochemical methods can either be performed independently or coupled with
other analytical techniques to produce powerful tandem met hods for pesticide
analysis. Currently, our laboratory is investigating immunoaffinity separation tech-
niques coupled to immunoassay and instrumental methods to support environmental
monitoring studies including:
.
Immunoaffinity chromatographic separation of a group of structurally simi-
lar pesticides. This may be accomplished by using either the high cross-
reactivity of an antibody to a certain group of pesticides or using mixed
antibodies that possess a combined affinity to a pesticide group.
.
Hybrid affinity separation of multiple pesticides based on the integration of
immunoaffinity chromatography and surface imprinting techniques. Hybrid
affinity columns can be prepared by mixing one or more antibodies with
one or more types of molecularly imprinted polymers.
Other methods this laboratory is investigating are the online combination of immu-
noaffinity separation with liquid chromatography-mass spectrometry (LC-MS) to
provide rapid separation and detection of pesticides with a high degree of selectivity
and sensitivity. Similar combinations can also be performed between immunoaffinity
separation and flow-injection analysis. The online c ombination of immunoassay and
sample preparation techniques such as SPE, or the online integration of SPE and
immunoaffinity cleanup can provide efficient analytical methods.
4.5 FUTURE TRENDS
Immunoassay is a mature analytical technology with broad application to pesticide
analysis. Extensive fundamental investigations as well as technical improvements
will make immunoassay methods more powerful tools for the identification and
determination of a variety of pesticides. New breakthroughs in the development
and application of immunoassays will result from the integration of future state-
of-the-art research in several key areas including antibody production, new platforms
and detection systems, and nanotechnology.
Future research that may enhance the use of immunoassays and immunosensors
for pesticide analysis is the development of novel antibodies for individual pesticide
compounds. This includes the design and synthesis of new haptens using the latest
concepts and techniques, better understanding and control of the combination
of hapten molecules and macromolecular carriers, and improving the efficiency of
ß 2007 by Taylor & Francis Group, LLC.
existing laboratory procedures to increase the yield of antibodies having the desired
characteristics.
Molecularly imprinted polymers (MIPs) and aptam ers are emerging as possible
reagents (i.e., artificial antibodies) for pesticide immunoassays and immunosensors.
These reagents have the potential to provide large amounts of reagents for the
development of methods and to support their widespread use. Some MIP-based
affinity separation methods and biosensors have already been developed for the
extraction and determination of pesticides in aqueous samples. Aptamers are artifi-
cial nucleic acid ligands that can be generated to detect biomacromolecules, such as
proteins, and small molecules, such as amino acids, drugs, and pesticides. Currently,
aptamer-based bioanalytical methods are mainly employed for clinical applications.
Additional studies of molecular recognition-based MIPs and aptamers could facili-
tate the development of more cost-effective methods including immunoaffinity
separation techniques for pesticides.
Future research may also be directed to new immunoassay formats. The devel-
opment of microimmunoassays, using compact discs (CDs) as an analytical plat-
form, has recently drawn much attention from researchers. An indirect competitive
procedure is conducted on the polycarbonate surface of a CD and a modified CD
reader performs as a laser scanner for the detection of microscopic reaction products
[93–95]. These test systems hold promise for the simultaneous determination of
multiple pesticide residues in environmental samples in a rapid and cost-effective
format. New platforms may also be integrated with new labels such as more robust
enzymes or highly sensitive visualization techniques, such as laser-induced fluores-
cence detection (LIF) to produce even lower limits of detection.
Nanotechnology is a rapidly growing discipline of scientific research and is
applied to a wide variety of fields. Nanomaterials with dimensions of <100 nm
have physical and chemical properties that make them attractive for many applica-
tions requiring high strength, conductivity, durability, and reactivity. The application
of nanotechniques in immunoassays is also of great interest to researchers [93,96].
New detection strategies based on gold and silver particles have been successfully
demonstrated for immunoassay labeling to meet the needs of diverse detection
methods. These particles have been used for various techniques such as scanning
and transmission electron microscopy, Raman spectroscopy, and sight visualization
due to their easily controlled size distribution, and long-term stability and compati-
bility with biomacromolecules.
Initial studies on nanoparticle-labeled microfluidic immunoassays have shown
their unique advantages over conventional immunoassay formats for the detection of
small molecules, macromolecules, and microorganisms. Submicron-sized striped
metallic rods intrinsically encoded through differences in reflectivity of adjacent
metal stripes have been used in autoantibody immunoassays. These bar-coded
particles act as supports with antigens attached to the surface providing a permanent
tag for the tracking of analyte [97].
Nanomaterials including gold, zirconia (ZrO
2
), and carbon nanotubes have
been applied as biosensors for monitoring OP pesticides [76,77,98]. An optical
sensor based on fumed silica gel functionalized with gold nanoparticles has also
been reported for OP pesticides [98]. Nanoparticles possess extraordinary optical
ß 2007 by Taylor & Francis Group, LLC.
properties that may offer alternative strategies for the development of optical sensors.
An electrochemical sensor for detection of OP pesticides has been developed using
ZrO
2
nanoparticles as selective sorbents, possessing a strong affinity for the phos-
phoric group. The nitroaromatic OPs strongly bind to the ZrO
2
surface. A square-
wave voltammetric analysis was used to monitor the amount of bound OP pesticide.
Another sensitive flow-injection amperometric biosensor for OP pesticides and nerve
agents was developed using self-assembled acetylchol inesterase (AchE) on a carbon
nanotube (CNT)-modified glassy carbon electrode [77]. The CNTs have two main
functions for the biosensor; first, as platforms for AchE immobilization by providing
a microenvironment that can maintain the bioactivity of AchE, and second, as a
transducer for amplifying the electrochemical signal of the product of the enzymatic
reaction. The integration of nano- and biomaterials could be extended to other
biological molecules for future biosensor or immunoa ssay research.
Advancements in biosensor technology will continue with expansion of multi-
analyte detection and more rapid analytical capability. For example, a chip contain-
ing 92,000 electrodes with a 30 ms read is already investigated. With a 30 ms read
time, enzymatic kinetic reads could be performed directly on the chip. However, the
capability of 92,000 electrodes 3 1000 reads presents storage, data acquisition, and
conversion issues. The limiting factor at this time is computer capability. Other
technologies such as a 40 s kinetic read of 12,000 electrodes with 4 or 8 electrodes
discharged at one time in microsecond intervals are near realization.
Through future research, immunoassays and biose nsors for pesticides may find
critical applications related to in vitro and in vivo studies in the diverse field of
environmental science and human exposure.
REFERENCES
1. Baker, S.R. and Wilkinson, C.F. The effects of pesticides on human health, Vol. XVIII,
in Advances in Modern Environmental Toxicology, Princeton Scientific Publishing,
Princeton, NJ, pp. 438, 1990.
2. Van Emon, J.M., Ed. Immunoassay and Other Bioanalytical Techniques, CRC Press,
Taylor & Francis Group, Boca Raton, FL, 2007.
3. NRC, National Research Council, Pesticides in the Diets of Infants and Children,
National Academy Press, Washington, D.C., p. 386, 1993.
4. FQPA, Food Quality Protection Act of 1996. Public Law, 104–170, 1996.
5. Hammock, B.D. and Mumma, R.O. Potential of immunochemical technology for pesti-
cide analysis, in Pesticide Analytical Methodology, Harvey, J.J., and Zweig, G., Eds.,
American Chemical Society, Washington, D.C., pp. 321–352, 1980.
6. Van Emon, J.M. and Lopez-Avila, V. Immunochemical methods for environmental
analysis. Anal. Chem., 64(2), 79A–88A, 1992.
7. Chuang, J.C., Miller, L.S., Davis, D.B., Peven, C.S., Johnson, J.C., and Van Emon, J.M.
Analysis of soil and dust samples for polychlorinated biphenyls by enzyme-linked
immunosorbent assay (ELISA). Anal. Chim. Acta, 376, 67–75, 1998.
8. Chuang, J.C., Van Emon, J.M., Chou, Y L., Junod, N., Finegold, J.K., and Wilson, N.K.
Comparison of immunoassay and gas chromatography–mass spectrometry for measure-
ment of polycyclic aromatic hydrocarbons in contaminated soil. Anal. Chim. Acta, 486,
31–39, 2003.
ß 2007 by Taylor & Francis Group, LLC.
9. Khosraviani, M., Pavlov, A.R., Flowers, G.C., and Blake, D.A. Detection of heavy metals
by immunoassay: optimization and validation of a rapid, portable assay for ionic cad-
mium. Environ. Sci. Technol., 32, 137–142, 1998.
10. Nichkova, M., Park, E., Koivunen, M.E., Kamita, S.G., Gee, S.J., Chuang, J.C., Van
Emon, J.M., and Hammock, B.D. Immunochemical determination of dioxins in sediment
and serum samples. Talanta, 63, 1213–1223, 2004.
11. Van Emon, J.M. and Gerlach, C.L. A status report on field-portable immunoassay.
Environ. Sci. Technol., 29(7), 312A–317A, 1995.
12. Rodriguez-Mozaz, S., Lopez de Alda, M.J., and Barcelo, D. Fast and simultaneous
monitoring of organic pollutants in a drinking water treatment plant by a multi-analyte
biosensor followed by LC-MS validation. Talanta, 69(2), 377–384, 2006.
13. Marco, M. and Barcelo, D. Environmental applications of analytical biosensors. Meas.
Sci. Technol., 7, 1547–1562, 1996.
14. Yang, Y., Guo, M., Yang, M., Wang, Z., Shen, G., and Yu, R. Determination of
pesticides in vegetable samples using an acetylcholinesterase biosensor based on nano-
particles ZrO
2
=chitosan composite film. Int. J. Environ. Anal. Chem., 85(3), 163–175,
2005.
15. Zhang, J. Tube-immunoassay for rapid detection of carbaryl residues in agricultural
products. J. Environ. Sci. Health, Part B, 41(5), 693–704, 2006.
16. Garcia-Reyes, J.F., Llorent-Martinez, E.J., Ortega-Barrales, P., and Molina-Diaz, A.
Determination of thiabendazole residues in citrus fruits using a multicommuted fluores-
cence-based optosensor. Anal. Chim. Acta, 557(1–2), 95–100, 2006.
17. Zacco, E., Galve, R., Marco, M.P., Alegret, S., and Pividori, M.I. Electrochemical
biosensing of pesticide residues based on affinity biocomposite platforms. Biosens.
Bioelectron., 22(8), 1707–1715, 2007.
18. Van Emon, J.M. and Gerlach, C.L. Environmental monitoring and human exposure
assessment using immunochemical techniques. J. Microbiol. Methods, 32, 121–131,
1998.
19. Van Emon, J.M. Immunochemical applications in environmental science. J. AOAC Int.,
84(1), 125, 2001.
20. Voller, A., Bidwell, D.E., and Bartlett, A. Microplate enzyme immunoassays for the
immunodiagnosis of virus infections, in Manual of Clinical Immunology, Rose, N., and
Friedman, H., Eds., American Society for Microbiology, Washington, D.C., pp. 506–512,
1976.
21. Gee, S.J., Hammock, B.D., and Van Emon, J.M. A User ’ s Guide to Environmental
Immunochemical Analysis. EPA=540=R-94=509, March 1994.
22. Jaeger, L.L., Jones, A.D., and Hammock, B.D. Development of an enzyme-linked
immunosorbent assay for atrazine mercapturic acid in human urine. Chem. Res. Toxicol.,
11, 342–352, 1998.
23. Chuang, J.C., Van Emon, J.M., Durnford, J., and Thomas, K. Development and evalu-
ation for an enzyme-linked immunosorbent assay (ELISA) method for the measurement
of 2,4-dichlorophenoxyacetic acid in human urine. Talanta, 67, 658–666, 2005.
24. Thurman, E.M., Meyer, M., Pomes, M., Perry C.A., and Schwab, A.P. Enzyme-linked
immunosorbent assay compared with gas chromatography=mass spectrometry for the
determination of triazine herbicides in water. Anal. Chem., 62, 2043–2048, 1990.
25. Wong J.M., Li, Q.X., Hammock, B.D., and Seiber, J.N. Method for the analysis of
4-nitrophenol and parathion in soil using supercritical fluid extraction and immunoassay.
J. Agric. Food Chem., 39, 1802–1807, 1991.
26. Chuang, J.C., Pollard, M.A., Misita, M., and Van Emon, J.M. Evaluation of analytical
methods for determining pesticides in baby food. Anal. Chim. Acta, 399, 135–
142, 1999.
ß 2007 by Taylor & Francis Group, LLC.
27. Ahn, K.C., Ma, S., and Tsai, H. An immunoassay for a urinary metabolite as a biomarker
of human exposure to the pyrethroid insecticide permethrin. Anal. Bioanal. Chem., 384,
713–722, 2006.
28. Koivunen, M.E., Dettmer, K., Vermeulen, R., Bakke, B., Gee, S.J., and Hammock, B.D.
Improved methods for urinary atrazine mercapturate analysis—assessment of an enzyme-
linked immunosorbent assay (ELISA) and a novel liquid chromatography–mass spec-
trometry (LC-MS) method utilizing online solid phase extraction (SPE). Anal. Chim.
Acta, 572, 180–189, 2006.
29. Chuang, J.C., Van Emon, J.M., Finegold, K., Chou, Y L., and Rubio, F. Immunoassay
method for the determination of pentachlorophenol in soil and sediment. Bull. Environ.
Contam. Toxicol., 76(3), 381–388, 2006.
30. Van Emon, J.M., Hammock, B., and Seiber, J.N. Enzyme-linked immunosorbent assay
for paraquat and its application to exposure analysis. Anal. Chem., 58, 1866–1873, 1986.
31. Van Emon, J.M., Seiber, J.N., and Hammock, B.D. Application of an enzyme-linked
immunosorbent assay to determine paraquat residues in milk, beef, and potatoes. Bull.
Environ. Contam. Toxicol., 39, 490–497, 1987.
32. Van Emon, J.M., Seiber, J.N., and Hammock, B.D. Immunoassay techniques for pesti-
cide analysis in analytical methods for pesticides and plant growth regulators, in
Advanced Analytical Techniques, Vol. XVII, Sherma, J., Ed., Academic Press, New
York, pp. 217–263, 1989.
33. Nam, K. and King, J.W. Supercritical fluid extraction and enzyme immunoassay for
pesticide detection in meat products. J. Agric. Food Chem., 42, 1469–1474, 1994.
34. Richman, S.J., Karthikeyan, S., Bennett, D.A., Chung, A.C., and Lee, S.M. Low-level
immunoassay screen for 2,4-dichlorophenoxyacetic acid in apples, grapes, potatoes,
and oranges: circumventing matrix effects. J. Agric. Food Chem., 44, 2924–2929,
1996.
35. Yeung, J.M., Mortimer, R.D., and Collins, P.G. Development and application of a rapid
immunoassay for difenzoquat in wheat and barley products. J. Agric. Food Chem., 44,
376–380, 1996.
36. Bashour, I.I., Dagher, S.M., Chammas, G.I., and Kawar, N.S. Comparison of gas
chromatography and immunoassay methods for analysis of total DDT in calcareous
soils. J. Environ. Sci. Health, Part B: Pestic. Food Contam. Agric. Wastes, B38(2),
111–119, 2003.
37. Botchkareva, A.E., Eremin, S.A., Montoya, A., Marcius, J.J., Mickova, B., Rauch, P.,
Fini, F., and Girotte, S. Development of chemiluminescent ELISAs to DDT and its
metabolites in food and environmental samples. J. Immuno. Methods, 283(1–2), 45–57,
2003.
38. Chuang, J.C., Van Emon, J.M., Reed, A.W., and Junod, N. Comparison of immunoassay
and gas chromatography-mass spectrometry methods for measuring 3,5,6-trichloro-
2-pyridinol in multiple sample media. Anal. Chim. Acta, 517(1–2), 177–185, 2004.
39. Lee, J.K., Ahn, K.C., Stoutamire, D.W., Gee, S.J., and Hammock, B.D. Development of
an enzyme-linked immunosorbent assay for the detection of the organophosphorus
insecticide acephate. J. Agric. Food Chem., 51, 3695–3703, 2003.
40. Lee, J.K., Kim,Y.J., Lee, E.Y., Kim, D.K., and Kyung, K.S. Development of an ELISA
for the detection of fenazaquin residues in fruits. Agric. Chem. Biotech
., 48(1), 16–25,
2005.
41. Kolosova, A.Y., Park, J., Eremin, S.A., Park, S., Kang, S., Shim, W., Lee, H., Lee, Y.,
and Chung, D. Comparative study of three immunoassays based on monoclonal anti-
bodies for detection of the pesticide parathion-methyl in real samples. Anal. Chim. Acta,
511(2), 323–331, 2004.
ß 2007 by Taylor & Francis Group, LLC.