Analysis of Pesticides in Food and Environmental Samples - Chapter 9 doc
Bạn đang xem bản rút gọn của tài liệu. Xem và tải ngay bản đầy đủ của tài liệu tại đây (275.43 KB, 26 trang )
9
Determination of
Pesticides in Water
Jay Gan and Svetlana Bondarenko
CONTENTS
9.1 Introduction 232
9.1.1 Method Classificati on 232
9.1.2 Objectives 233
9.2 Liquid–Liquid Extraction 233
9.2.1 Standard LLE 233
9.2.1.1 General Procedures 234
9.2.1.2 Advantages 234
9.2.1.3 Disadvantages 235
9.2.2 Micro-LLE 235
9.2.2.1 Principles and Procedures 235
9.2.2.2 Advantages 236
9.2.2.3 Disadvantages 236
9.3 Solid-Phase Extraction 236
9.3.1 Standard SPE 236
9.3.1.1 Principles 236
9.3.1.2 General Procedures 237
9.3.1.3 Advantages 238
9.3.1.4 Disadvantages 238
9.3.1.5 Trends 238
9.3.1.6 Applications 239
9.3.2 SPE Disks 240
9.3.2.1 Principle and Procedur es 240
9.3.2.2 Advantages 240
9.3.2.3 Disadvantages 241
9.3.2.4 Trends 241
9.3.2.5 Applications 241
9.3.3 Solid-Phase Microextraction 242
9.3.3.1 Principles and Procedures 242
9.3.3.2 Advantages 242
9.3.3.3 Disadvantages 243
9.3.3.4 Trends 243
9.3.3.5 Applications 243
ß 2007 by Taylor & Francis Group, LLC.
9.4 Capillary Electrophoresis 244
9.4.1 Principles 244
9.4.2 Advantages 245
9.4.3 Disadvantages 245
9.4.4 Trends 245
9.4.5 Applications 245
9.5 Immunoassays 246
9.5.1 Principles 246
9.5.2 Advantages 247
9.5.3 Disadvantages 247
9.5.4 Trends 247
9.5.5 Applications 248
9.6 Detection Methods 248
9.6.1 Background 248
9.6.2 GC Detection Methods 249
9.6.3 LC Detection Methods 250
9.6.4 Comparison between GC and LC Methods 251
References 252
9.1 INTRODUCTION
Concerns over the contamination of water by pesticides generally arise from two
scenarios, that is, concern over human health risks when water (e.g., groundwater) is
used for drinking and concern over ecotoxicological effects when nontarget organ-
isms (e.g., aquatic organisms and amphibians) are exposed to water in their habitats.
Both the European Union (EU) and the United States have adopted stringent limits
for pesticide presence in drinking water. For instance, EU regulations for drinking
water quality set a limit of 0.5 mg=L for the sum of all pesticides and 0.1 mg=L
for each compound. However, when acute or chronic toxicities or other ecological
effects (e.g., bioaccumulation) are implied, water quality limits can be much
lower than those for drinking water. For instance, in the total maximum daily
loads (TMDL) established for diazinon and chlorpyrifos for a watershed in Orange
County, California, the numerical targets for diazinon were set at 80 ng=L for acute
toxicity and 50 ng=L for chronic toxicity, and those for chlorpyrifos at 20 ng=L for
acute toxicity and 14 ng=L for chronic toxicity [1]. Regulatory requirements such as
these have driven the development of increasingly more sensitive and rigorous
methods for the analysis of pesticides in water.
9.1.1 METHOD CLASSIFICATION
A complete method for pesticide analysis in water, as in other matrices, always
includes a sample preparation method and a pesticide detection method. The need for
detecting pesticides at trace levels means that a water sample must be reduced many
times in size so that a small aliquot of the final sample may provide adequate
sensitivity for detection. The concentration magnification is achieved through
phase transfer by using liquid–liquid extraction (LLE) or solid-phase extraction
ß 2007 by Taylor & Francis Group, LLC.
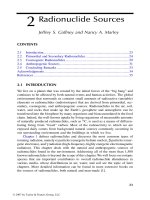
(SPE). Many other methods may be considered as variations of the tradi tional LLE and
SPE metho ds (Figure 9.1). For instance, micro-LLE or single-drop extraction can be
considered as a miniaturization of the standard LLE procedure. Variations of cartridge
SPE include SPE disks and solid-phase mic roextraction (SPME). Methods can also
be classified based on the mechanisms used for pesticide detection. However, as
detection methods are usually common among different sample matrices and are not
limited only to water, this chapter will mostly focus on sample preparation methods
for water analysis, with exceptions made only for immunoassays and capillary
electrophoresis (CE) because of their significant deviations from conventional chro-
matographic methods.
9.1.2 OBJECTIVES
Advancements and challenges in pesticide analysis in water are periodically updated
in the form of journal review articles [2–6]. It must be noted that the number
of publications on this topic is enormous, and that it is infeasible to thoroughly
review all published studies. In this chapter, only a limited number of publications
since 1990 are cited. The purpose is to evalua te and compare some of the most
commonly used methods, and to provide the reader with condensed information on
method principles, procedures, advantages, disadvantages, and trends. A few appli-
cations are further included in each method, which may lead the reader to more
concrete details.
9.2 LIQUID–LIQUID EXTRACTION
9.2.1 S
TANDARD LLE
LLE is one of the earliest methods used for analyzing pesticides in water samples.
Because of its simplicit y and also its inclusion in EPA methods, LLE is still probably
Water sample
LLE SPE
Standard LLE
Micro-LLE
Cartridge SPE
Disk SPE
SPME
On-column SPE
Immunoaffinity SPE
Large volume injection
Single-drop extraction
FIGURE 9.1 A general diagram describing preparation methods used for analysis of pesti-
cides in water.
ß 2007 by Taylor & Francis Group, LLC.
the most used method for pesticide analysis in water. Depending on the types of
analytes, different solvents or other conditions may be used. In the United States,
LLE procedures for different classes of pesticides are given in different EPA
methods and are routinely used by commercial laboratories. The foll owing method
is a brief description of EPA method 8141, using separatory funnels for preparation
of water samples containing organophosphate or carbamate residues.
9.2.1.1 General Procedures
.
Measure out 1000 mL water sample using a 1 L graduated cylinder or by
weighing in a container.
.
Spike 100 mL of the surrogate spiking solution into each sample and mix well.
.
For the sample in each batch selected for use as a matrix spike sample, add
100 mL of the matrix-spiking standard.
.
Quantitatively transfer the sample to a 2 L glass separatory funnel, adding
50 g of sodium chloride. Use 100 mL of methylene chloride to rinse the
sample container and transfer this rinse solvent to the separatory funnel.
.
Seal and shake the separatory funnel vigorously for 1–2 min with periodic
venting to release excess pressure.
.
Allow the organic layer to separate from the water phase for a minimum of
10 min. If the emulsion interface between layers is more than one-third the
size of the solvent layer, the analyst must employ mechanical techniques to
complete the phase separation. The optimum technique depends upon the
sample and may include stirring, filtration of the emulsion through glass
wool, centrifugation, or other physical methods. Dry the extract by passing
it through a drying funnel containing about 50 g of anhydrous sodium
sulfate. Collect the solvent extract in a round bottom flask.
.
Repeat the extraction two more times using fresh portions of solvent.
Combine the three solvent extracts.
.
Rinse the separation flask, which contained the solvent extract, with 20–30 mL
of methylene chloride and add it to the drying column to complete the
quantitative transfer.
.
Perform the concentration, if necessary, using a vacuum evaporator. For
further concentration, nitrogen blow down technique is used to adjust the
extract to the final volume required.
.
The extract may now be analyzed for the target analytes using the appro-
priate determinative technique(s).
9.2.1.2 Advantages
Standard LLE is a mature method that has been well used and tested. Its advantages
include relatively minimal requirements for equipment and low demand on
the analyst’s skills, compatibility for a broad range of pesticide s, and reliability.
Variations in analyte recovery may be addressed by using a surrogate prior to the
extraction. The surrogate can be either a similar compound or a stable-isotope
labeled form of the target analyte, if detection is to be made by a selective detector
such as mass spectrometry (MS).
ß 2007 by Taylor & Francis Group, LLC.
9.2.1.3 Disadvantages
A number of drawbacks may be easily iterated regarding the standard LLE; Most
notable is the consumption of large quantities of organic solvents, which makes LLE
methods less environment-friendly. Analysis of a 1 L water sample typically needs
about 300–500 mL solvent. The heavy use of solvents in LLE may pose a health
concern to the analyst, and also produce large amounts of wastes. LLE is generally
labor intensive, time consuming, and physically demanding. Extraction and prepar-
ation of 6–8 samples may easily take one day of the analyst’s time. LLE is generally
not suitable for analysis of polar pesticide compounds. LLE can also be less effective
for water samples containing high levels of organic matter or suspended particles,
such as runoff effluents and other surfa ce water samples, because heavy emul sion
often forms between the aqueous and solvent phases. This may prolong phase
separation and make recovery variable.
9.2.2 MICRO-LLE
9.2.2.1 Principles and Procedures
Micro-LLE is a miniaturization of standard LLE in that only a very small amount of
solvent is used for extraction. For instance, Zapf et al. [7] developed a micro-L LE
method for the analysis of 82 various pesticides in tap water. Briefly, a 400 mL tap
water sample in a 500 mL narrow-necked bottle was saturated with 150 g NaCl and
buffered to a pH value of 6.5–7.0. The water sample was spiked with analyte
mixtures in 100 mL methanol to achieve concentrations of 50, 100, and 500 ng=L.
After addition of 500 mL toluene, the bottle was seale d and shaken for 20 min at
420 rpm. After phase separation, the solvent layer was brought up to the bottleneck
by addition of a saturated NaCl solution using a Pasteur pipette connected to a
separating funnel. About 150 mL of the toluene phase was transferred into 200 mL
vials and 2 mL was injected into a gas chromatograph (GC) with electron capture
detector (ECD) or nitrogen phosphorus detector (NPD) for detection. For 68 com-
pounds, the recoveries were higher than 50%. The mean relative standard deviations
(RSD) at spiking level s of 50, 100, and 500 ng=L were 7.9%, 6.6%, and 5.2%,
respectively. In most cases, compounds were reproducibly detected at concent rations
well below 0.1 mg=L.
de Jager and Andrews [8] have described a micro-LLE method, in which a
single drop of water-immiscible solvent is attached to the tip of a syringe needle,
for the analysis of organochlorine pesticides in water samp les. This method is also
called solvent microextraction (SME) or single-drop microextraction (SDME) [9].
In this method, a 2 mL drop of hexane containing 100 ng=mL of decachlorobiphenyl
as internal standard was used as the extraction solvent and immersed in the
stirred sample solution for a 5 min extraction time. The sample solution was stirred
at a rate of 240 rpm, and a Hamilton 10 mL 701SN syringe fitted with a Chaney
adapter (Hamilton, Reno, NV, USA) was used in all extractions and injections.
By using the Chaney adapter, the maximum syringe volume was set to 2.2 mL and
the delivery volume was set to 2.0 mL. For the extraction, 2.2 mL of hexane was
drawn into the syringe and the plunger was depressed with the stop button engaged,
ß 2007 by Taylor & Francis Group, LLC.
causing 0.2 mL to be expelled. The microsyringe was then positioned in the
extraction stand in such a way that the tip of the extraction needle protruded to a
depth of about 8 mm below the surface of the aqueous solution. The syringe plunger
was then completely depres sed causing a 2 mL drop to form on the needle tip. The
drop was suspended from the needle for 5 min at which time the plunger was
withdrawn to 2.2 mL with the needle tip still submerged in the sample solution.
The contents of the syringe were then injected into the GC for analysis. Total
analysis time was less than 9 min, allowing 11 samples to be screened per hour.
This method was therefore useful for quick screen ing of organochlorine compounds
in water. Using a similar method, Liu et al. [9] was able to detect fungicides such as
chlorothalonil, triadimefon, hexaconazole, and diniconazole in water at 0.006–0.01
mg=L with RSD < 8.6%.
9.2.2.2 Advantages
Micro-LLE is advantageous over the conventional LLE in that only a very small
amount of organic solvent is used. As a significant fraction or all of the organic phase
is used for detection, good sensitivity may be achieved. Micro-LLE is therefore far
less time consuming and inexpensive.
9.2.2.3 Disadvantages
Micro-LLE operates at a phase ratio that does not favor pesticide enrichment into the
organic phase. It is difficult to automate, and performance is likely dependent on
the analyst’s skills. The solvent chosen must be completely immiscible with water,
and therefore micro-LLE is suitable only for nonpolar pesticides. Inconsistency in
recovery may be overcome by using an internal standard at the extraction step. This
method is more appropriate for rapid screening, rather than for routine analysis.
9.3 SOLID-PHASE EXTRACTION
9.3.1 S
TANDARD SPE
9.3.1.1 Principles
The trend in pesticide analysis in water has moved away from LLE to SPE. This is
due to the better extraction efficiencies, ease of use, less use of solvents, potential
for automation, and better selectivity of SPE. Compared with most other methods,
SPE is a widely used and mature method. In SPE, the analyte is transferred from the
aqueous phase onto a sorbent phase, which can then be recovered for analysis.
Sorbents available in standard SPE include the common inorganic adsorbents used
in liquid chromatography (LC), such as silica gel, as well as activated charcoal,
bonded silica phases, and polymers [10]. The most popular phases are octadecyl
(C18) and octyl-silica (C8), styrene-divinylbenzene copolymers, and graphitized
carbon black.
Alkyl-bonded silica sorbents: The peak tailing and poor selectivity of silica gel led to
the development of silica-based phases with an alkyl- or aryl-group substituted
ß 2007 by Taylor & Francis Group, LLC.
silanol. The functionality properties of the sorbent depend on the percentage of
carbon loading, bonded-silica porosity, particle-size, and whether the phase is end-
capped. Endcapping is used to reduce the residual silanols, but the maximum
percentage of endcapping is 70%. The most popular sorbents from this group are
C18 and C8.
Carbon sorbents: An important gain of graphitized carbon black (GCB) as the
sorbent is that the recoveries do not decrease when environmental waters with
dissolved organic carbon (DOC) are extracted. This is due to the fact that fulvic
acids, which represent up to 80% of the DOC content in surface waters, are adsorbed
on the anion-exchange sites of the GCB surface, and therefore they cannot compete
with nonacidic pesticides for adsorption on the nonspecific sites of the sorbent. GCB
has three main disadvantages: the collapsing of the sorbent, desorption problems
during elution, and the possibility of reactions between the analytes and the sorbent
surface, leading to incomplete sorption and desorption.
Polymeric resins: With these sorbents, the retention behavior of the analytes is
governed by hydrophobic interactions similar to C18 silica, but, owing to the
aromatic rings in the network of the polymer matrix, one can expect strong electro-
donor interactions with aromatic rings of solutes.
Mixed phases: The advantages of each sorbent can be combined in the form of a
mixture of sorbents used in the same SPE column.
9.3.1.2 General Procedures
A typical SPE sequence includes the activation of the sorbent bed (wetting), removal
of the excess of activation solvent (conditioning), application of the sample,
removal of interferences (cleanup) and water, elution of the sorbed analytes, and
reconstitution of the extract [10]. Exact conditions are usually specified by the
manufacturer, and may vary significantly in types of solvents used for conditioning
and elution. A general procedure for using SPE cartridges is as follows [11]:
.
Wash the cartridge with a small amount of relatively nonpolar solvent
(e.g., ethyl acetate, acetone), followed by a relatively polar solvent (e.g.,
methanol), and finally water.
.
Without letting the cartridge become dry, pass the water sample (e.g., 1 L)
through the column under vacuum at a relatively fast rate (e.g., 15 mL=min).
.
If the water sample contains an appreciable amount of suspended solids,
filter the sample to remove suspended solids before loading.
.
After the sample is loaded, wash the cartridge with a small amount of water
and dry the cartridge by passing air for a short time.
.
Elute the SPE cartridge with the same solvents used at the preparation step,
except in a reversed order.
.
The eluate is dried with a small amount of anhydrous sodium sulfate and
further evaporated to dryness under a gentle stream of nitrogen.
.
The residue is recovered in a small amount of solvent appropriate for GC or
LC analysis.
ß 2007 by Taylor & Francis Group, LLC.
9.3.1.3 Advantages
Compared with conventional LLE methods, SPE has several distinctive advantages.
SPE generally needs a shorter analysis time, consumes much less organic solvents,
and may be less costly than LLE [11]. SPE also offers the great advantage for easier
transportation between laboratories or from the field to the laboratory, and for
easier storage. For example, water samples can be processed at a remote site, and
only the cartridges need to be transported back to the laboratory, which makes
sampling at remote sites feasible. Automation or semiautomation may be potentially
achieved for either off-line or on-line use of SPE, although manual, off-line is likely
the dominant form that has been used.
9.3.1.4 Disadvantages
There are many different types of sorbents and configurations (e.g., mass of sorbent
per tube), and each SPE is inherently best suited for a specific class of pesticide
compounds. This, when combined with operational factors such as flow rate, con-
ditioning, and elution, and the effect of sample matrix, can make the recovery of
pesticides highly variable [11]. In addition, suspended solids and salts are known to
cause blockage of SPE cartridges. Samples compatible with SPE must be relatively
clean (e.g., groundwater). When surface water samples are analyzed, prefiltration is
generally necessary to remove the suspended solids. This may not be desirable for
hydrophobic compounds, because a significant fraction of the analyte is associated
with the suspended solids.
Both low and enhanced recoveries have been observed when SPE is used for
extracting pesticides from water samples. For instance, when using C18 SPE c art-
ridges for the determination of 23 halogenated pesticides, Baez et al. [11] found that
recoveries depended on the pesticides, and losses occurred with heptachlor, aldrin,
and captan. Recoveries for vinclozolin and dieldrin from groundwater were lower
than those obtained from nanopure water. In river water, losses of these compounds
were higher. High losses were also observed for trifluralin, a-BHC, g-BHC, tri-
allate, and chlorpyrifos. In a follow-up study, Baez et al. [12] evaluated the use of
C18 SPE columns for the determination of organophosphorus, triazine, and triazole-
derived pesticides, napropamide, and amitraz. Under general extraction conditions,
losses were found for amitraz, prometryn, prometon, dimethoate, penconazole, and
propiconazole. At 100 ng=L, enhanced responses were observed for mevinphos,
simazine, malathion, triadimefon, methidathion, and phosmet, which was attributed
to matrix effects.
9.3.1.5 Trends
Current trends include the use of SPE on-line, coupling with selective or sensitive
detectors, the use of stable isotopes to overcome the issue of variable recoveries,
and automation. Bucheli et al. [13] reported a method for the simult aneous iden-
tification and quantification of neutral and acidic pesticides (triazines, acetamides,
and phenoxy herbicides) at the low ng=L level. The method included the
ß 2007 by Taylor & Francis Group, LLC.
enrichment of the compounds by SPE on GCB, followed by the sequential elution
of the neutral and acidic pesticides and derivatization of the latter fraction with
diazomethane. Identificati on and quantification of the compounds was performed
with GC–MS using atrazine-d5, [
13
C6]-metolachlor, and [
13
C6]-dichlorprop as
internal standards. Absolute recoveries from nanopure water spiked with 4–50
ng=L were 85 Æ 10%, 84 Æ 15%, and 100 Æ 7% for the triazines, the acetamides,
and the phenoxy acids, respectively. Recoveries from rainwater and lake water
spiked with 2–100 ng=L were 95 Æ 19%, 95 Æ 10%, and 92 Æ 14% for the tria-
zines, the acetamide s, and the phenoxy acids, respec tively. Average method
precision determined with fortified rainwater (2–50 ng=L) was 6.0 Æ 7.5% for the
triazines, 8.6 Æ 7.5% for the acetamides, and 7.3 Æ 3.2% for the phenoxy acids.
MDLs ranged from 0.1 to 4.4 ng=L. Crescenzi et al. [14] reported the coupling of
SPE and LC=MS for determining 45 widely used pesticides having a broad range
of polarity in water. This method involved passing 4, 2, and 1 L, respectively,
of drinking water, groundwater, and river water through a 0.5 g GCB cartridge
at 100 mL=min. In all cases, recoveries of the analytes were better than 80%,
except for carbendazim (76%). For drinking water, MDLs ranged between
0.06 (malathion) and 1.5 (aldicarb sulfone) ng=L. Kampioti et al. [15] reported
a fully automated method for the multianalyte determination of 20 pesticides
belonging to different classes (triazines, phenyl ureas, organophosphates, anil ines,
acidic, propanil, and molinate) in natur al and treated waters. The method, based
on on-line SPE-LC-MS, was highly sensitive with MDLs between 0.004
and 2.8 ng=L, precise with RSDs between 2.0% and 12.1%, reliable, and rapid
(45 min per sample).
9.3.1.6 Applications
Fernandez et al. [16] performed a comparative study between LLE and SPE with
trifunctional bonding chemistry (tC18) for 22 organochlorine and 2 organophos-
phorus pesticides, 2 triazines, and 7 PCBs. Mean recovery yields were higher
with the LLE method, although SPE for most of the 33 analytes surpas sed 70%.
The MDLs for both techniques were below 5 ng=L, except for parathion (7 ng=L),
methoxychlor (8 ng=L), atrazine (35 ng=L), and simazine (95 ng=L). Patsias and
Papadopoulou-Mourkidou [17] reported a rapid multiresidue method for the analy-
sis of 96 target analytes in field water samples. Analytes were extracted from 1 L
filtered water samples by off-line SPE on three tandem C18 cartridges. The sorbed
analytes eluted with ethyl acetate were directly analyzed by GC-ion trap MS
(GC–IT–MS). The mean recover ies, at the 0.5 mg=L level, for two-thirds of the
analytes ranged from 75% to 120%; the recoveries for less than one-third of
the analytes ranged from 50% to 75% and the recoveries for the 10 relatively
most polar analytes ranged from 12% to 50%. The MDLs for 69 analytes were
below 0.01 mg=L; the MDLs for 18 analytes were below 0.05 mg=L; for captan,
carbofenothion, deltamethrin, demeton-S -methyl sulfone, fensulfothion, deisopro-
pylatrazine, and metamitron, the MDL was 0.1 m
g=L and for chloridazon and
tetradifon, the MDL was 0.5 mg=L.
ß 2007 by Taylor & Francis Group, LLC.
9.3.2 SPE D ISKS
9.3.2.1 Principle and Procedures
In a special form of SPE, the sorbent is bonded to a solid support that is configured
as a disk. During filtration, using SPE disks, the pesticides sorb to the stationary
phase and then are eluted with a minimal amount of organic solvent. Empore disks
(3 M, St. Paul, MN), bonded with a C18 or C8 solid phase, have been the most
commonly used SPE disks [18]. The general procedure for using Empore disks is as
follows, although details may vary for specific applications and for the types of SPE
disks used [19].
.
Before use, condition Empore disks by soaking in a solvent (e.g., acetone).
.
Pass the water sample through the disk under vacuum on an extraction
manifold. In some applications, a small amount of solvent modifier
(e.g., methanol) is added to the water sample to improve pesticide recovery
[20]. It is usually recommended that the disk should not be allowed to
become dry during the extraction.
.
After sample extraction, elute the disks with a small amount of solvent (e.g.,
dichloromethane–ethyl acetate mixture) or extract the disk by mixing the
disk in an extracting solvent in a closed vessel.
.
Evaporate the solvent extract to a small volume, and an aliquot of the final
sample extract is injected into GC or LC for detection.
9.3.2.2 Advantages
Like SPE cartridges, the use of SPE disks also greatly reduces the volume of
solvents, decreases sample preparation time and labor, and sometimes increases
extract purity from water samples [21–23]. SPE disks can also be used for temporary
pesticide storage [24,25], field extraction of pesticide s [26], and shipping pesticides
from one location to another [27,28].
Field extraction capability adds a new dimension to the sampling of natural water
samples. When using the conventional approach, water samples are collected in glass
containers and transported or shipped to a laboratory for extraction and analysis.
With SPE disks, it is possible to extract pesticides from water in the field and
transport only the disks to the laboratory for elution and analysis [26]. This elimin-
ates the risk of glass breakage during collection, transport, and shipping, in addition
to great ly reducing freight costs, and preserves some pesticides that are prone to
hydrolysis. Numerous studies have shown that SPE disks can be used to extract
pesticides from water and to preserve sample integrity until laboratory analysis
[18,28–30]. Pesticide stability studies using Empore disks show that some pesticides
have greater stability on C18 disks than in water at 48C [25]. For instance, Aguilar
et al. [27,31] stored SPE cartridges at room temperature, 48C, and 208C for 1 week or
3 months, and found minimal losses of pesticide for the lowest temperature at both
time intervals. A multistate regional project showed that the pesticides atrazine,
chlorpyrifos, and metolachlor could be retained on SPE disks and shipped to another
laboratory for analys is with little pesticide losses [27].
ß 2007 by Taylor & Francis Group, LLC.
9.3.2.3 Disadvantages
The main difficulties encountered with any kind of SPE configurations are caused by
the presence of suspended particles in the sample. The particles of the alkyl bonded
silica act as a mechanical filter that retains suspended soil or sediment particles, and
the result is a loss of filtration due to clogging. This is very inconvenient when large
volumes of sample are processed. To resolve this problem, acidification to a pH
value of 2 is widely applied. Alternatively, the water sample is filtered prior to
extraction. However, this treatment may not be desirable if the purpose of the
analysis is to determine the total chemical concentration. In addition, although
many studies have demonstrated the stability and good recovery of many pesticides
from SPE disks, recoveries may vary with pesticide chemistry. It has also been
shown that pesticide recovery from turbid water samples is less than that from
deionized water samples [32]. Recoveries for compounds such as chlorpyrifos can
be low and variable [29]. Therefore, field spikes, surrogates, and other quality
assurance measures must be considered when using SPE disks for fi eld samples.
9.3.2.4 Trends
A couple of problems may be encountered when using Empore SPE disks for
pesticide extraction at one site followed by shipment to another site for elution and
analysis. Once removed for shipping, it is impossible to perfectly realign disks onto
another laboratory’s extraction manifold so that the entire impregnated portion of
the disk is exposed to the elution solvent. Realignment problems can result in
reduced recovery from incomplete pesticide elution. This problem can be solved
by combining the disks with the elution solvent in screw cap tubes, which are mixed
on a shaker to extract pesticides from the disks [27]. In addition, surface water with
high levels of particulates clogs disks and requires a filtration step prior to passing
the water sample through the disk. Speedisks (J.T. Baker, Phillipsburg, NJ) offer an
alternative to the use of traditional Empore SPE disks. Speedisks contain the
extraction sorbent in a plastic housing, which is placed directly onto an extraction
manifold, eliminating the realignment problems as noted earlier. The combination
provides one-step filtration and extraction.
9.3.2.5 Applications
Numerous studies have reported the use of SPE disks for extracting or preserving
pesticides from water samples. C18 Empore disks have been reported to extract
some fungicides [33], carbamates and herbi cides [34], or polar pesticides and
herbicides [20] from waters. C8 Empore disks have been used to recover organo-
chlorine pesticide s, triazine herbicides, and other compounds from spiked water
samples [35], and organochlorine, organophosphorus insecticides, triazine, and
neutral herbicides from drinking water [23]. For instance, in Ref. [36], Empore
C18 disks were used to extract a range of organophosphate compounds, including
bromophos ethyl, bromophos methyl, dichlofenthion, ethion, fenamiphos, feni-
trothion, fenthion, malathion, parathion ethyl, and parathion methyl. Using
GC=MS or GC=FTD, MDLs were in the range of 0.01–0.07 mg=L and the recovery
was from 60.7% to 104.1%.
ß 2007 by Taylor & Francis Group, LLC.
9.3.3 SOLID-PHASE MICROEXTRACTION
9.3.3.1 Principles and Procedures
Although SPE methods use less amount of solvents, they are multiple-step proced-
ures and are still somewhat time consuming. In 1990, an alternative extraction
procedure employing SPME was introduced by Pawliszyn and coworkers [37,38].
In SPME, a thin fiber is coated with a sorbent and is exposed to the aqueous solution
or the headspace of an aqueous sample to cause partitioning of some of the target
analyte into the sorben t phase of the fiber. The fiber is then withdrawn, and
introduced directly into a GC inlet to thermally desorb the enriched analyte into
the GC column or eluted with the mobile phase in the mode of LC analysis. This
technique fuses sample extraction and analysis into a single, continuous step, is
compatible with GC and LC, and eliminates the use of any solvent for extraction.
SPME is an equilibrium process that involves the partitioning of analytes between
the sample and the extraction phase. Sampling conditions must therefore be system-
atically optimized to increase the partitioning of analytes in the coated fiber. Besides
sampling conditions and analyte properties, the type of fiber coating is one of the
most important aspects of optimization. Supelco (Bellefonte, PA, USA) is the main
supplier of commercialized SPME fibers. Depending on the coating phase, the
commercially available SPME fibers can be divided into absorbent- and adsorbent-
type fibers. Absorbent-type fibers extract the analytes by partitioning of analytes into
a ‘‘liquid-like’’ phase (e.g., polydimethylsiloxane or PDMS) whereas adsorbent-type
fibers (e.g., activated carbon) extract the analytes by adsorption.
SPME consists of two extraction modes. One is the direct immersion mode, in
which analytes are extracted from the liquid phase onto an SPME fiber, and the
other is the headspace mode (HS–SPME), in which analytes are extracted from
the headspace of a liquid sample onto the SPME fiber [39]. In general, direct SPME
is more sensitive than HS–SPME for analytes present in a liquid sample, although
HS–SPME gives lower background than direct SPME [40].
SPME can be coupled with either GC or LC. Coupling of SPME–GC is
suitable for nonpolar and volatile or semivolatile pesticides. However, thermal
desorption at high temperature creates practical problems such as degradation of
the polymer, and furtherm ore, many nonvolatile compounds cannot be completely
desorbed from the fiber. Solvent desorption is thus proposed as an alternative
method through SPME–LC coupling. An organic solvent (static desorption mode)
or the mobile phase (dynamic mode) is used to desorb the analytes from the
SPME fiber.
9.3.3.2 Advantages
Several advantages can be pointed out in relation to SPME: it is solvent free, uses the
whole sample for analysis, and requires only small sample amoun ts. The fibers are
highly reusable (up to more than 100 injections). The success of SPME is based on
its combining sampling, isolation, and conce ntration into a conti nuous step, and its
compatibility with GC or LC.
ß 2007 by Taylor & Francis Group, LLC.
9.3.3.3 Disadvantages
SPME suffers drawbacks such as sample carry-over, high co st, and a decline in
performance with increased usage. The reluctance to adopting SPME in some cases
can be also due to the steep learning curve expected for new users. To achieve good
reproducibility, conditions such as fiber exposure time, solution stirring speed, fiber
immersion depth, and fiber activation time and temperature must be precisely con-
trolled, which may prove to be difficult if a manua l assembly is used. In general, the
use of manual SPME is tedious and gives low sample throughput. However, precise
and easy handling of SPME can be realized using an automated SPME sampler such as
the Combi-PAL autosampler made by Varian (Palo Alto, CA, USA).
9.3.3.4 Trends
In addition to the general purpose PDMS and polyacrylate (PA)-coated fibers, a large
number of fiber coatings based on solid sorbents are available, namely the PDMS–
divinylbenzene (PDMS–DVB), Carbowax–DVB (CW–DVB), CW–templated resin
(CW–TR), Carboxen–PDMS, and DVB–Carboxen PDMS coated fibers [41]. SPME
fibers with bipolar characteristics can be very useful for the simultaneous analysis of
pesticides representi ng a wide range of polarities.
In-tube SPME is a new variation of SPME that has recently been developed
using GC capillary columns as the SPME device instead of the SPME fiber. In-tube
SPME is suitable for automation, and automated sample handling procedures not
only shorten the total analysis time but also usually provide better accuracy and
precision relative to manual SPME. In Ref. [42], an autom ated in-tube SPME
method coupled with LC=ESI–MS was developed for the determination of chlorin-
ated phenoxy acid herbicides. A capillary was placed between the injection loop and
the injection needle of the autosampler. A metering pump was used to repeatedly
draw and eject sample from the vial, allowing the analytes to partition from the
sample matrix into the stationary phase. The extracted analytes were directly des-
orbed from the stationary phase by mobile phase, transported to the LC column, and
then detected. The optimum extraction conditions were 25 draw=eject cycles of
30 ml of sample in 0.2% formic acid (pH ¼ 2) at a flow rate of 200 ml=min using
a DB-WAX capillary. The herbicides extracted by the capillary were easily desorbed
by 10 ml acetonitrile. The calibration curves of herbicides were linear in the range
0.05–50 mg=L with correlation coefficients above 0.999. This method was success-
fully applied to the analysis of river water samples without interference peaks. The
MDL was in the range of 0.005–0.03 mg=L. The repeatability and reproducibility
were in the range of 2.5%–4.1% and 6.2%–9.1%, respectively.
9.3.3.5 Applications
Choudhury et al. [43] evaluated the use of SPME–GC analysis of 46 nitrogen- and
phosphorus-containing pesticides defined in the EPA Method 507. Effects of pH,
ionic strength, methanol content, and temperature on extraction were determined.
Analytes were extracted into a PDMS fiber and then thermally desorbed in a GC
ß 2007 by Taylor & Francis Group, LLC.
injector and analyzed. When analyzed by SPME GC=NPD or by SPME GC=MS,
34 and 39 pesticides, respectively, were measured at levels lower than the EPA
MDLs and precision requirements. This method was applied to the analysis of
contaminated well water, watershed, and stream water and compared to U.S. EPA
Method 507 findings. The results demonstrated that SPME was a valuable tool for
the rapid screening of 39 EPA Method 507 nitrogen- and phosphorus-containing
pesticides in water.
Jackson and Andrews [44] evaluated the use of SPME under nonequilibrium
conditions for analysis of organochlorine pesticides. SPME is typically performed
for a length of time that nears the equilibrium time of the analyte in the sample.
However, equilibrium times for organochlorines fall in the range of 30–180 min.
Studies show that linear responses having good precision are possible by using
extraction times well short of equilibrium times [37,45]. With a 2 min extraction
time and 100 mm PDMS fiber, analysis of a sample took less than 10 min, with
MDLs in the order of 10 ng=L.
Chafer-Pericas et al. [46] compared the advantages and disadvantages of two
different configurations for the extraction of triazines from water samples, on-fiber
SPME coupled to LC, and in-tube SPME coupled to LC. In-tube SPME used a
packed column or an open capillary column. In the on-fiber SPME configuration, the
fiber coating was PDMS–DVB. The MDLs obtained with this approach were
between 25 and 125 mg=L. The in-tube SPME approach with a C18 packed column
(35 mm 3 0.5 mm I.D., 5 mm particle size) connected to a switching microvalve
provided the best sensitivity; under such configuration, the MDLs were between
0.025 and 0.5 mg=L. The in-tube SPME approach with an open capillary column
coated with PDMS (30 cm 3 0.25 mm I.D., 0.25 mm of thickness coating) connected
to the injection valve provided MDLs between 0.1 and 0.5 mg=L.
9.4 CAPILLARY ELECTROPHORESIS
9.4.1 P
RINCIPLES
CE is a relatively new analytical technique that is complementary to GC and LC.
CE is a microvolume separation technique characterized by its relatively short
analysis time, and nanoliter to picoliter sample volumes. In CE, a fused-silica
capillary is filled with an electrolytic solution, known as the running buffer or
background electrolyte. An electric field is applied to the capillary to cause migration
of charged molecules in opposite directions. The mobility of the ion is governed
by its charge-to-size ratio, and the size is dependent on the molecular weight, the
three-dimensional structure, and the degree of solvation. The most common mode
of CE is known as micellar electrokinetic chromatography (MEKC), which was
introduced by Terabe et al. [47] in an effort to extend the use of CE to neutral
molecules. In MEKC, surfactants are added to the background electrolyte to produce
micelles, which will allow nonpolar compounds to interact with the micelles to cause
separation. The most common surfactant is sodium dodecyl sulfate (SDS). Smith
and coworkers [48– 50] have introduced in situ charged micelles that are based on
the complexation of borate or borate ions with the neutr al surfactant that have
polyolic polar head groups. The surface charge density of the micellar phases can
ß 2007 by Taylor & Francis Group, LLC.
be varied by either altering the borate or boronate concentration and pH of
the running buffer, which further optimi zes the resolution and peak capacity during
MEKC analysis.
9.4.2 ADVANTAGES
CE offers several advantages over conventional chromatographic techniques, includ-
ing use of little solvents, high resolution, small sample volume, and short run time.
In addition, CE may be complementary to GC when the thermal lability of the
analyte is a concern. CE is more efficient at separation when compared with common
LC and GC techniques due to its maximum theoretical plate number. CE is espe-
cially applicable to the analysis of water samples as preconcentration treatments such
as SPE or field amplification can be easily used to enhance the detection sensitivity.
9.4.3 DISADVANTAGES
The largest drawback to CE is its relatively low sensitivities, which is caused by the
extreme degree of miniaturization involved in CE, and the limited availability of
sensitive detection systems. For instance, when a UV detector is used, the sensitivity
of CE is comparable to that of LC. This problem is slowly being resolved with the
introduction of high flow cell capillaries and new detectors. For instance, coupling
with MS enhances the sensitivity because of the decreased matrix interference.
Preconcentration techniques such as sample stacking and SPE greatly enhance the
sensitivity of CE, and this sample manipulation approach is suitable especially for
water samples.
9.4.4 TRENDS
In general, CE application for routine analysis of pesticides is restricted by the
relatively few developed methods, partly because of its short history. Sample
pretreatment techniques such as SPE and on-column preconcentration methods
such as sample stacking are used in CE to achieve better sensitivity for pesticide
analysis in water. There are two types of stacking. The first stacking method involves
the stacking of sample into a shorter zone during CE separation. The second method
is known as field-amplified sample stacking, involving stacking with reversed
polarity [51–53]. In addition, more sensitive and selective detectors have been
coupled with CE to improve sensitivity. For instance, laser-induced fluorescence
and photothermal systems offer enhanced sensitivities for certain compounds. MS
with a proper interface has also been shown to provide much better sensitivities.
9.4.5 APPLICATIONS
Fung and Mak [54] used a two-step sample preconcentration (SPE and field-
amplified sample stacking) and applied MEKC for the analys is of 14 pesticides
(including aldicarb, carbofuran, isoproturon, chlorotoluron, metolachlor, mecoprop,
dichlorprop, MCPA, 2,4-D, methoxychlor, TDE, DDT, dieldrin, and DDE) in
drinking water. Good recoveries of pesticides were obtained using SPE with sample
pH adjusted to 2–3. Field-amplified sample stacking was found to give additional
ß 2007 by Taylor & Francis Group, LLC.
enrichment up to 30-fold. The optimized background electrolyte consisted of 50 mM
sodium dodecyl sulfate (SDS), 10 mM borate buffer, 15 mM b-cyclodextrin (b-CD),
and 22% acetonitrile at pH 9.6, and running was performed under 25 kV with
detection at 202 nm. Good linearity was obtained for all pesticides with detection
limits down to 0.04–0.46 mg=L. Song and Budde [55] applied CE with electrospray
negative ion MS (CE–ENI–MS) for the determination of chlorinated acid herbicides
and several phenols in wat er. Sixteen acid herbicides were separated as anions
in less than 40 min with a buffer consisting of 5 mM ammonium acetate in
isopropanol–water (2:3, v=v) at pH 10. A sample stacking technique was used to
achieve lower detection limits, along with selected ion monitoring (SIM) and internal
standardization. Safarpour et al. [56] reported the use of CE–MS for the analysis of
imazamox in water. Residues of imazamox were extracted from the water samples
using revers ed-phase SPE. Pesticide measurement was accomplished by CE–MS
using electrospray ionization with SIM in the positive-ion mode. The MDL was
0.02 mg=L.
9.5 IMMUNOASSAYS
9.5.1 P
RINCIPLES
Immunoassays (IAs) are based on the interaction of antibodies (Abs) with antigens
(Ags). Antibodies are polymers containing hundreds of individual amino acids
arranged in a highly ordered sequence. These polypeptides are produced by immune
system cells (B lymphocytes) when exposed to antigenic substances or molecules. In
Abs, there are recognition=binding sites for specific molecular structures of the Ags.
According to the ‘‘key–lock’’ model, an Ab interacts in a highly specific way with its
unique Ag. This feature constitutes the key to IA [57]. In most IAs, the antibodies
(or the antigens) are immobilized on a solid support and a measurement of the
binding sites by the antigens (or the antibodies) is made because the antibody
occupancy reflects the concentration of analytes in the medium [58]. However,
since the binding reaction does not produce a signal, a tracer must be added to
allow estimation of the occupancy by measuring the tracer signal. The labels capable
of detecting the immunological reaction with the purpose of quantitation can be
fluorescent, chemilum inescent enzymes or radioisotopes.
Immunobased kits make possible the performance of analysis in different
laboratories and also in field under standard conditions, owing to their reproducibil-
ity, ease of use, and good shelf life [59]. Approximately 90% of the developed IAs
for pesticide residue analyses use the enzyme-linked immunosorbent assay (ELISA).
In this technique, the analyte from the sample and a known amount of enzyme-
tagged analyte compete for a limited number of antibody binding sites. Quantifica-
tion is achieved by comparing the signal generated by an unknown sample with a
standard curve. Immunoassay test kits include antibodies, reagents, standard, and
substrates in field transportable units that are ready to use. Immunoassay kits are
suitable for use under field conditions because they are fast, and many of the standard
documentary and sample-handling procedures can be avoided. In general, no sample
treatment is necessary. In some cases, only a filtration step is required.
ß 2007 by Taylor & Francis Group, LLC.
9.5.2 ADVANTAGES
IAs are specific, sensitive, easy to perform, fast, relatively inexpensive, and highly
portable [59]. Compared with chromatographic techniques, IAs are advantageous if
large series of samples have to be analyzed. Also, no complex or sophisticated
instrumentation is required and the use of organic solvents is minimal. IAs may be
useful for polar pesticides that are difficult to analyze by standard techniques [60].
Immunoaffinity chromatogr aphy (IAC) is based on the use of antibodies, not on
differences in polarity. Antibodies raised against a specific target pesticide can be
immobilized on a solid phase and will selectively retain the pesticide, thus effecting
both a preconcentration and a cleanup.
9.5.3 DISADVANTAGES
While numerous studies have shown excellent correlation between the results of IAs
and the conventional chromatographic methods, there are also many instances sug-
gesting that IAs can cause under- or overestimation of the true pesticide concentrations
because of matrix interference and cross activity. Acceptance of IAs is dependent
upon several factors, including the demonstration of quality and validity compared
with more traditional methods. IAs are considered as a supplementary method for
other more reliable methods or as a semiquantitative method for initial screening.
9.5.4 TRENDS
The earlier IAs dealt with single pesticides, but there is clearly a trend for developing
class-specific assays [58]. Simultaneous detection of a plurality of analytes by IAs
would answer many of the requirements of pesticide pollution monitoring. Further
developments in ELISA include the automation of both plate and tube assays. Great
efforts have been made to achieve the miniaturization and automation of immuno-
assay techniques. Also, an important premise in ELISA kits is their application in
field assays, and a very interesting approach would be the introduct ion of stable
immunoreagents. In this sense, there is a need for the development of new tracers,
such as fluorescent labels, that avoid the drawbacks inherent to enzyme use (stability,
cost, handling, and storage). Finally, new strategies for antibody production to
increase sensitivity and selectivity through the use of recombinant anti bodies and
molecular-imprinted polymers are promising and attractive alternatives to conven-
tional approaches for the development of antibodies.
One extension of IA is the development of immunosensors as prescreening
techniques in environmental monitoring [61]. Immunosensors are based on the
principles of solid-phase IA. They combine the power of antibodies as recognition
agents and an appropriate physicochemical transduction mechanism to convert the
recognition events to signals. The working principle of an immunosensor is based on
the formation of an immunochemical interaction step that produces a physicochem-
ical change in the system, which can be converted into a readabl e signal. To meet
the requirement of continuous monitoring, the principles of flow injection
analysis have been incor porated into the biosensor manufacturing, leading to the
development of flow-through immunosensors. The bioactive surface of the biosensor
ß 2007 by Taylor & Francis Group, LLC.
can be regenerated to enable continual monitoring of the measured signal. Regener-
ation of the sensing surface is usually performed by displacement of the immuno-
reaction, using agents that are able to break the antibody–analyte association, such as
organic solvents with acidic buffers, chaotropic agents, or digesting enzymes, or a
combination of two or more of these methods.
Another application of IA is the development of immunoaffinity columns that
can be coupled with MS for the determination of analytes. Zhang et al. [62] reported
the use of IA–LC–MS–MS for analysis of diuron in water. This method used a sol–
gel immunoaffinity column (20 mm 3 4 mm I.D.) for on-line sample cleanup and
enrichment, a monolithic analytical column (100 mm 3 4.6 mm I.D.) for separation,
and a triple quadrupole MS for quantitation. The optimized on-line protocol was
emphasized by the observation that low MDL of 1.0 ng=L was achieved with only
2.5 mL sample. In addition, a satisfactory accuracy (about 90% of recovery) and
precision (<6% RSD) at 50 ng=L concentration were also obtained.
9.5.5 APPLICATIONS
Bruun et al. [63] reported an IA met hod for the triazine metabolites hydroxypropa-
zine, hydroxyatrazine, and hydroxysimazine. The assay was based on covalent
immobilization of antigen in combination with an enzyme-labeled anti-hydroxy-
s-triazine monoclonal antibody. This system enabled the development of an assay
with variation coefficients below 3% and MDL below 0.01 mg=L hydroxyatrazine
and hydroxypropazine. Analysis of hydroxyatrazine-spiked water of three different
types yielded an average recovery of 102% at 0.1 mg=L hydroxyatrazine. Relative to
hydroxyatrazine, assay cross-reactivity was 148% towards hydroxypropazine and
67% towards hydroxysimazine.
Schraer et al. [64] compared ELISA data from a surface water reconnaissance to
GC data on cyanazine and metolachlor. A total of 535 surface water samples from
locations in Mississippi, Louisiana, Arkansas, and Tennessee were collected. When
ELISA analyses were duplicated, cyanazine and metolachlor detection was found to
have highly reproducible results; adjusted R
2
s were 0.97 and 0.94, respectively.
When ELISA results for cyanazine were regressed against GC results, the models
effectively predicted cyanazine concentrations from ELISA analyses (adjusted R
2
s
ranging from 0.76 to 0.81). The intercepts and slopes for these models were not
different from 0 and 1, respectively. This indicates that cyanazine analysis by ELISA
gave the same results as analysis by GC. However, regressing ELISA analyses for
metolachlor against GC data provided more variable results (adjusted R
2
s ranged
from 0.67 to 0.94). Regression models for metolachlor analyses had two of three
intercepts that were not different from 0. Slopes for all metolachlor regression
models were significantly different from 1. This indicates that as metolachlor
concentrations incre ased, ELISA over- or underestimated the concentration.
9.6 DETECTION METHODS
9.6.1 B
ACKGROUND
Following sample preparation, a wide range of methods can be used for analysis of
pesticides in water samples. These methods include mainstream methods such as
ß 2007 by Taylor & Francis Group, LLC.
various GC and LC met hods, an d other met hods such as imm unoassays and CE
analysis. Pr inciples and applications of immunoa ssays and CE are descri bed in the
previou s sections. In this secti on, discu ssion will be focuse d on the princ iples,
advant ages and disad vantag es, and trend s in GC and LC metho ds that are used for
quantitat ive meas uremen t of pesticide s in water.
It is importan t to realize that pesticide types have chang ed throu gh the years, going
from persisten t and more nonpol ar pesticide s (e.g., organoc hlori ne insectici des) to
more polar and some times therm al-labile compo unds. In particula r, the heavy use of
herbicides such as sulf onylureas, imidazol inones , tri azines, chlor ophenoxy acids, and
phenyl ureas has promp ted the de velopment of met hods suit able for more thermola bile
and low-vol atility compo unds. This trend has apparen tly d riven the develo pment of
some new and more robust methods, incl uding e specially LC–MS based met hods.
9.6.2 GC DETECTION METHODS
From the early 1970s to the early 1990s, most routine pesti cide residue analys is were
conduct ed by GC in combi nation with ECD , NPD , flame ionizati on de tector (F ID) or
flame photom etric detect ion (FPD) [65]. The sensiti vity o f these convent ional GC
detectors is highl y speci fic to the types of pesticide s being ana lyzed. While ECD can
be highl y sensi tive for haloge nated pesticide s, FID is general ly less sensiti ve and
NPD lies somewhe re in between for N- or P-con taining pesticide s. These conven-
tional GC detect ors are not u niversal and are not desire d for multiresid ue analys is.
More imp ortantly, these detect ion methods do not provi de any quali tative infor ma-
tion on the structure s being analyzed . Con firmation often requires the use of a second
column of a different polar ity. However , combinati on of GC wi th MS enable s
simultan eous determin ation and con firmation of pesticide resi dues with one inst ru-
ment in one analyt ical run. In the scan mode, the sensi tivity of MS approximat es that
of FID an d poorer than ECD , while in the SIM or MS=MS mode, much better
sensiti vity can usually be obtained bec ause of the greatly imp roved selec tivity that
suppresses the matrix background.
In GC–MS, ionization of pesticides can be achieved by electron impact ionization
(EI) or positive or negative chemical ionization (PCI, NCI). Most of the published
studies on residue analysis by GC–MS report on results obtained by singl e quadrupole
instruments and EI [65]. Compared with EI, positive or negative CI–MS gives
better selectivity for some pesticides. This is due to reduced matrix interference [66].
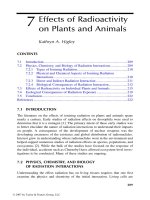
Figure 9.2 shows two chromatograms from the same surface water sample analyzed by
GC–ECD or GC–MS (NCI) (with methane as the CI gas). Because of its much better
selectivity, it is clear that GC–MS (NCI) was 1–2 orders of magnitude more sensitive
at detecting pyrethroid pesticides in the same water sample than GC–ECD.
As in GC–MS (CI), a good suppression of matrix background can also be
obtained by GC–MS=MS systems [67]. Some limitations in GC–MS=MS arise
from the absence of a universal soft ionization mode that may be used for producing
dominant molecular ions. CI generates high-intensity ions of only some pesticide
classes, while the total ion current of EI is spread on many fragments, resulting in a
low intensity of parent ions. In general, both GC–MS (CI) and GC–MS=MS are more
advantageous than any of the conventional GC detection methods, because they
provide both high sensitivity and the capability for structure confirmation.
ß 2007 by Taylor & Francis Group, LLC.
9.6.3 LC DETECTION METHODS
Until a decade ago, methods based on LC were applied much less frequently than
GC for pesticide residue analysis, because traditional UV and fluorescence detectors
are less sensitive than the various GC detection methods [65]. However, in the last
decade, the availability of atmospheric pressure ionization (API) made possible the
coupling of LC with MS. Compared with traditional detectors, electrospray (ESI) or
atmospheric pressure chemical ionization (APCI) in combination with MS has
increased the sensitivity of LC detection by several orders of magnitude. Singl e
quadrupole was the predominant configuration of LC–MS in the early 1990s.
A disadvantage of single quadrupole LC–MS is the high intensity of background
signals produced from sample matrix and LC solvent clusters. Because of this
chemical noise in real samples, detection sensitivity was relatively poor, even though
the instrumental sensitivity was good [68]. The chemical background can be reduced
significantly if tandem MS in combination with selected reaction monitor ing (SRM)
is applied. Even if a coextracted matrix component has the molecular mass of a
pesticide, usually both isobaric ions can be separated in SRM, because their
fragmentation in the collision cell most often results in different product ions.
Therefore, LC–MS=MS offers excellent sensitivity and unsurpassed selectivity.
Moreover, when LC–MS=MS is operated in the SRM mode, it is unnecessary to
perform LC column switching or extensive sample cleanup [68,69].
Time-of-flight (TOF)–MS in combination with LC is more often used in the
high-resolution mode, which provides better discrimination of background [70].
(a)
Bifenthrin
Bifenthrin
Permethrin
Permethrin
Cyfluthrin
Cyfluthrin
Cypermethrin
λ-Cyhalothrin
λ-Cyhalothrin
(b)
FIGURE 9.2 GC chromatograms from the urban runoff water sample subjected to two
different analyses. (a) GC–ECD and (b) GC–MS (NCI).
ß 2007 by Taylor & Francis Group, LLC.
The main advantage of this type of instrument is the identification of unknown peaks
in a sample even if analytical standards are not available [71].
9.6.4 COMPARISON BETWEEN GC AND LC METHODS
Alder et al. [65] recently reviewed applications of GC–MS and LC–MS methods for
pesticide residue analysis and made several important observations. LC–MS=MS
was shown to be better suited for sulfonyl or benzoyl ureas, carbamates, and triazines
than GC–MS. For the remainder pesticides, the application scope of LC– MS=MS
was also wider than that of GC–MS. Both GC–MS and LC–MS based methods
revealed a significant variation in sensitivity, covering at least a range of 3–4 orders
of magnitude, depending on the pesticide analyzed. However, a comparison of the
median of MDLs clearly showed much higher sensitivity if determinations
were based on LC–MS=MS. The better perfor mance of LC–MS=MS is probably
determined by several reasons. Among them the larger injection volume used in
LC–MS=MS (20 mL vs. 1 mL) and the lower amount of fragm entation during
ionization (ESI vs. EI) may explain some of these differences.
Table 9.1 lists some of the most commonly used GC and LC methods for
analysis of pesticides in water samples. These methods are also roughly ranked
according to their sensitivity, selectivity, universal applicability, and ability for
structure identification. An important factor to consider when selecting a detection
method is whether the analysis is for screening of a wi de range of pesticides or target
analysis of a predefined set of compounds. For the screening of a wide range of
TABLE 9.1
Frequently Used GC and LC Methods for Analysis of Pesticides in Water
and Their Relative Ranking in Detection Sensitivity, Universal Applicability,
Matrix Background Suppression, and Ability for Structural Confirmation
Detection Method Sensitivity
Universal
Applicability
Matrix
Suppression
Confirmation
Capability
Gas Chromatography (GC)
GC–FID ? ??? ? ?
GC–NPD ?? ? ? ?
GC–ECD ??? ? ?? ??
GC–FPD ?? ? ? ?
GC–MS (SIM) ? ??? ??? ???
GC–MS (CI) ???? ??? ???? ????
GC–MS=MS ??? ??? ???? ????
Liquid Chromatography (LC)
LC–UV ???? ?
LC–fluoroscence ?? ? ? ??
LC–MS ?? ???? ??? ???
LC–MS=MS ???? ???? ???? ????
ß 2007 by Taylor & Francis Group, LLC.
ana lytes, as often requi red in monitor ing studies, univer sal methods such as GC –MS,
GC –MS=MS, or LC –MS=MS will be superior to the other more speci fi c methods.
On the o ther hand, a speci fic method may be selected for targe t analysis of a know n
group o f pe sticides. Las t b ut not least, facto rs such as cost, availabilit y of instru-
ment s, and skil ls of analysts can also contr ibute to the method s selec ted for pesticide
ana lysis in water samples.
REFERENCES
1. U.S. Environmental Protection Agency, Diazinon and chlorpyrifos TMDL for San
Diego Creek and Newport Bay watershed. http:==www.waterboards.ca.gov=santaana=
pdf=03-39.pdf 2003.
2. Hatrik, S., Tekel, J., Extraction methodology and chromatography for the determination
of residual pesticides in water. Journal of Chromatography A 1996, 733(1–2), 217–233.
3. Liska, I., Slobodnik, J., Comparison of gas and liquid chromatography for analysing
polar pesticides in water samples. Journal of Chromatography A 1996, 733(1–2),
235–258.
4. Wan, H.B., Wong, M.K., Minimization of solvent consumption in pesticide residue
analysis. Journal of Chromatography A 1996, 754(1–2), 43–47.
5. van der Hoff, G.R., van Zoonen, P., Trace analysis of pesticides by gas chromatography.
Journal of Chromatography A 1999, 843(1–2), 301–322.
6. Hogendoorn, E., van Zoonen, P., Recent and future developments of liquid chromato-
graphy in pesticide trace analysis. Journal of Chromatography A 2000, 892(1–2),
435–453.
7. Zapf, A., Heyer, R., Stan, H.J., Rapid micro liquid–liquid-extraction method for trace
analysis of organic contaminants in drinking water. Journal of Chromatography A 1995,
694(2), 453–461.
8. de Jager, L.S., Andrews, A.R.J., Development of a rapid screening technique for organo-
chlorine pesticides using solvent microextraction (SME) and fast gas chromatography
(GC). Analyst 2000, 125(11), 1943–1948.
9. Liu, Y., Zhao, E.C., Zhou, Z.Q., Single-drop microextraction and gas chromatographic
determination of fungicide in water and wine samples. Analytical Letters 2006, 39(11),
2333–2344.
10. Soriano, J.M., Jimenez, B., Font, G., Molto, J.C., Analysis of carbamate pesticides and
their metabolites in water by solid phase extraction and liquid chromatography: A review.
Critical Reviews in Analytical Chemistry 2001, 31(1), 19–52.
11. Baez, M.E., Lastra, O., Rodriguez, M., Solid phase extraction of halogenated pesticides
from ground and surface waters and their determination by capillary gas chromatography.
HRC-Journal of High Resolution Chromatography 1996, 19(10), 559–563.
12. Baez, M.E., Rodriguez, M., Lastra, O., Contreras, P., Solid phase extraction of organo-
phosphorus, triazine, and triazole-derived pesticides from water samples. A critical study.
HRC-Journal of High Resolution Chromatography 1997, 20(11), 591–596.
13. Bucheli, T.D., Gruebler, F.C., Muller, S.R., Schwarzenbach, R.P., Simultaneous deter-
mination of neutral and acidic pesticides in natural waters at the low nanogram per liter
level. Analytical Chemistry 1997, 69(8), 1569–1576.
14. Crescenzi, C., DiCorcia, A., Guerriero, E., Samperi, R., Development of a multiresidue
method for analyzing pesticide traces in water based on solid-phase extraction and
electrospray liquid chromatography mass spectrometry. Environmental Science &
Technology
1997, 31(2), 479–488.
ß 2007 by Taylor & Francis Group, LLC.
15. Kampioti, A.A., da Cunha, A.C.B., de Alda, M.L., Barcelo, D., Fully automated multi-
analyte determination of different classes of pesticides, at picogram per litre levels
in water, by on-line solid-phase extraction-liquid chromatography-electrospray-
tandem mass spectrometry. Analytical and Bioanalytical Chemistry 2005, 382(8),
1815–1825.
16. Fernandez, M.J., Garcia, C., GarciaVillanova, R.J., Gomez, J.A., Evaluation of liquid–
solid extraction with a new sorbent and liquid–liquid extraction for multiresidue pesti-
cides. Determination in raw and finished drinking waters. Journal of Agricultural and
Food Chemistry 1996, 44(7), 1790–1795.
17. Patsias, J., Papadopoulou-Mourkidou, E., Rapid method for the analysis of a variety of
chemical classes of pesticides in surface and ground waters by off-line solid-phase
extraction and gas chromatography ion trap mass spectrometry. Journal of Chromato-
graphy A 1996, 740(1), 83–98.
18. Riley, M.B., Dumas, J.A., Gbur, E.E., Massey, J.H., Mattice, J.D., Mersie, W., Mueller,
T.C., Potter, T., Senseman, S.A., Watson, E., Pesticide extraction efficiency of two solid
phase disk types after shipping. Journal of Agricultural and Food Chemistry 2005,
53(13), 5079–5083.
19. Lambropoulou, D.A., Konstantinou, I.K., Albanis, T.A., Determination of fungicides in
natural waters using solid-phase microextraction and gas chromatography coupled with
electron-capture and mass spectrometric detection. Journal of Chromatography A 2000,
893(1), 143– 156.
20. Brouwer, E.R., Lingeman, H., Brinkman, U.A.T., Use of membrane extraction disks for
online trace enrichment of organic-compounds from aqueous samples. Chromatographia
1990, 29(9–10), 415–418.
21. Markell, C., Hagen, D.F., Bunnelle, V.A., New technologies in solid-phase extraction.
LC GC-Magazine of Separation Science 1991, 9(5), 332–337.
22. Hagen, D.F., Markell, C.G., Schmitt, G.A., Blevins, D.D., Membrane approach to solid-
phase extractions. Analytica Chimica Acta 1990, 236(1), 157–164.
23. Davi, L.M., Baldi, M., Penazzi, L., Liboni, M., Evaluation of the membrane approach to
solid-phase extractions of pesticide-residues in drinking-water. Pesticide Science 1992,
35(1), 63–67.
24. Johnson, W.G., Lavy, T.L., Senseman, S.A., Stability of selected pesticides on solid-
phase extraction disks. Journal of Environmental Quality 1994, 23(5), 1027–1031.
25. Senseman, S.A., Lavy, T.L., Mattice, J.D., Myers, B.M., Skulman, B.W., Stability of
various pesticides on membranous solid-phase extraction media. Environmental Science
& Technology 1993, 27(3), 516–519.
26. Mattice, J.D., Senseman, S.A., Walker, J.T., Gbur, E.E., Portable system for extracting
water samples for organic analysis. Bulletin of Environmental Contamination and Toxi-
cology 2002, 68(2), 161–167.
27. Mueller, T.C., Senseman, S.A., Wauchope, R.D., Clegg, C., Young, R.W., Southwick, L.M.,
Riley, M.B., Moye, H.A., Dumas, J.A., Mersie, W., Mattice, J.D., Leidy, R.B., Recovery of
atrazine, bromacil, chlorpyrifos, and metolachlor from water samples after concentration on
solid-phase extraction disks: Interlaboratory study. Journal of AOAC International 2000, 83
(6), 1327–1333.
28. Mersie, W., Clegg, C., Wauchope, R.D., Dumas, J.A., Leidy, R.B., Riley, M.B., Young,
R.W., Mattice, J.D., Mueller, T.C., Senseman, S.A., Interlaboratory comparison of
pesticide recovery from water using solid-phase extraction disks and gas chromato-
graphy. Journal of AOAC International 2002, 85(6), 1324
–1330.
29. Senseman, S.A., Mueller, T.C., Riley, M.B., Wauchope, R.D., Clegg, C., Young, R.W.,
Southwick, L.M., Moye, H.A., Dumas, J.A., Mersie, W., Mattice, J.D., Leidy, R.B.,
ß 2007 by Taylor & Francis Group, LLC.
Interlaboratory comparison of extraction efficiency of pesticides from surface and
laboratory water using solid-phase extraction disks. Journal of Agricultural and Food
Chemistry 2003, 51(13), 3748–3752.
30. Cobb, J.M., Mattice, J.D., Senseman, S.A., Dumas, J.A., Mersie, W., Riley, M.B., Potter,
T.L., Mueller, T.C., Watson, E.B., Stability of pesticides on solid-phase extraction disks
after incubation at various temperatures and for various time intervals: Interlaboratory
study. Journal of AOAC International 2006, 89(4), 903–912.
31. Aguilar, C., Ferrer, I., Borrull, F., Marce, R.M., Barcelo, D., Monitoring of pesticides
in river water based on samples previously stored in polymeric cartridges followed
by on-line solid-phase extraction liquid chromatography diode array detection and
confirmation by atmospheric pressure chemical ionization mass spectrometry. Analytica
Chimica Acta 1999, 386(3), 237–248.
32. Johnson, W.E., Fendinger, N.J., Plimmer, J.R., Solid-phase extraction of pesticides from
water—Possible interferences from dissolved organic material. Analytical Chemistry
1991, 63(15), 1510–1513.
33. Salau, J.S., Alonso, R., Batllo, G., Barcelo, D., Application of solid-phase disk extraction
followed by gas and liquid-chromatography for the simultaneous determination of the
fungicides Captan, captafol, carbendazim, chlorothalonil, ethirimol, folpet, metalaxyl and
vinclozolin in environmental waters. Analytica Chimica Acta 1994, 293(1–2), 109–117.
34. Chiron, S., Barcelo, D., Determination of pesticides in drinking-water by online solid-
phase disk extraction followed by various liquid-chromatographic systems. Journal of
Chromatography 1993, 645(1), 125–134.
35. Krautvass, A., Thoma, J., Performance of an extraction disk in synthetic organic-chemical
analysis using gas-chromatography mass-spectrometry. Journal of Chromatography
1991, 538(2), 233–240.
36. Lambropoulou, D., Sakellarides, T., Albanis, T., Determination of organophosphorus
insecticides in natural waters using SPE-disks and SPME followed by GG=FTD and
GC=MS. Fresenius Journal of Analytical Chemistry 2000, 368(6), 616–623.
37. Arthur, C.L., Pawliszyn, J., Solid-phase microextraction with thermal-desorption using
fused-silica optical fibers. Analytical Chemistry 1990, 62(19), 2145–2148.
38. Zhang, Z.Y., Yang, M.J., Pawliszyn, J., Solid-phase microextraction. Analytical Chem-
istry 1994, 66(17), A844–A853.
39. Sakamoto, M., Tsutsumi, T., Applicability of headspace solid-phase microextraction to
the determination of multi-class pesticides in waters. Journal of Chromatography A 2004,
1028(1), 63–74.
40. Kataoka, H., Lord, H.L., Pawliszyn, J., Applications of solid-phase microextraction in
food analysis. Journal of Chromatography A 2000, 880(1–2), 35–62.
41. Goncalves, C., Alpendurada, M.F., Comparison of three different poly(dimethylsil-
oxane)-divinylbenzene fibres for the analysis of pesticide multiresidues in water samples:
Structure and efficiency.
Journal of Chromatography A 2002, 963(1–2), 19–26.
42. Takino, M., Daishima, S., Nakahara, T., Automated on-line in-tube solid-phase micro-
extraction followed by liquid chromatography=electrospray ionization-mass spectrometry
for the determination of chlorinated phenoxy acid herbicides in environmental waters.
Analyst 2001, 126(5), 602–608.
43. Choudhury, T.K., Gerhardt, K.O., Mawhinney, T.P., Solid-phase microextraction of
nitrogen and phosphorus-containing pesticides from water and gas chromatographic
analysis. Environmental Science & Technology 1996, 30(11), 3259–3265.
44. Jackson, G.P., Andrews, A.R.J., New fast screening method for organochlorine pesticides
in water by using solid-phase microextraction with fast gas chromatography and a pulsed-
discharge electron capture detector. Analyst 1998, 123(5), 1085–1090.
ß 2007 by Taylor & Francis Group, LLC.
45. Page, B.D., Lacroix, G., Application of solid-phase microextraction to the headspace
gas chromatographic analysis of semi-volatile organochlorine contaminants in aqueous
matrices. Journal of Chromatography A 1997, 757(1–2), 173–182.
46. Chafer-Pericas, C., Herraez-Hernandez, R., Campins-Falco, P., On-fibre solid-phase
microextraction coupled to conventional liquid chromatography versus in-tube solid-
phase microextraction coupled to capillary liquid chromatography for the screening
analysis of triazines in water samples. Journal of Chromatography A 2006, 1125(2),
159–171.
47. Terabe, S., Otsuka, K., Ichikawa, K., Tsuchiya, A., Ando, T., Electrokinetic separations
with micellar solutions and open-tubular capillaries. Analytical Chemistry 1984, 56(1),
111–113.
48. Smith, J.T., Nashabeh, W., Elrassi, Z., Micellar electrokinetic capillary chromatography
with in-situ charged micelles.1. Evaluation of N-
D-gluco-N-methylalkanamide surfactants
as anionic borate complexes. Analytical Chemistry 1994, 66(7), 1119–1133.
49. Smith, J.T., Elrassi, Z., Micellar electrokinetic capillary chromatography with in situ
charged micelles. 3. Evaluation and comparison of octylmaltoside and octylsucrose
surfactants as anionic borate complexes in the separation of herbicides. Journal of
Microcolumn Separations 1994, 6(2), 127–138.
50. Smith, J.T., Elrassi, Z., Micellar electrokinetic capillary chromatography with in-situ
charged micelles. 4. Influence of the nature of the alkylglycoside surfactant. Journal of
Chromatography A 1994, 685(1), 131–143.
51. Albin, M., Grossman, P.D., Moring, S.E., Sensitivity enhancement for capillary electro-
phoresis. Analytical Chemistry 1993, 65(10), A489–A497.
52. Chien, R.L., Burgi, D.S., On-column sample concentration using field amplification in
CZE. Analytical Chemistry 1992, 64(8), A489–A496.
53. Aebersold, R., Morrison, H.D., Analysis of dilute peptide samples by capillary zone
electrophoresis. Journal of Chromatography 1990, 516(1), 79–88.
54. Fung, Y.S., Mak, J.L.L., Determination of pesticides in drinking water by micellar
electrokinetic capillary chromatography. Electrophoresis 2001, 22(11), 2260–2269.
55. Song, X.B., Budde, W.L., Determination of chlorinated acid herbicides and related
compounds in water by capillary electrophoresis-electrospray negative ion mass spec-
trometry. Journal of Chromatography A 1998, 829(1–2), 327–340.
56. Safarpour, H., Asiaie, R., Katz, S., Quantitative analysis of imazamox herbicide in
environmental water samples by capillary electrophoresis electrospray ionization mass
spectrometry. Journal of Chromatography A 2004, 1036(2), 217–222.
57. Marco, M.P., Gee, S., Hammock, B.D., Immunochemical techniques for environmental
analysis. 1. Immunosensors. Trac-Trends in Analytical Chemistry 1995, 14(7), 341–350.
58. Hennion, M.C., Barcelo, D., Strengths and limitations of immunoassays for effective and
efficient use for pesticide analysis in water samples: A review. Analytica Chimica Acta
1998, 362(1), 3–34.
59. Gabaldon, J.A., Maquieira, A., Puchades, R., Current trends in immunoassay-based
kits for pesticide analysis. Critical Reviews in Food Science and Nutrition 1999, 39(6),
519–538.
60. Houben, A., Meulenberg, E., Noij, T., Gronert, C., Stoks, P., Immune affinity extraction of
pesticides from surface water. Analytica Chimica Acta 1999, 399(1–2), 69–74.
61. Mallat, E., Barcelo, D., Barzen, C., Gauglitz, G., Abuknesha, R., Immunosensors for
pesticide determination in natural waters. TRAC-Trends in Analytical Chemistry 2001,
20(3), 124–132.
62. Zhang, X.L., Martens, D., Kramer, P.M., Kettrup, A.A., Liang, X.M., On-line immuno-
affinity column-liquid chromatography-tandem mass spectrometry method for trace
ß 2007 by Taylor & Francis Group, LLC.