Analysis of Pesticides in Food and Environmental Samples - Chapter 10 pdf
Bạn đang xem bản rút gọn của tài liệu. Xem và tải ngay bản đầy đủ của tài liệu tại đây (1.24 MB, 30 trang )
10
Sampling and Analysis
of Pesticides in the
Atmosphere
Maurice Millet
CONTENTS
10.1 Introduction 257
10.2 Monitoring of Pesticides in the Atmosphere 261
10.2.1 Sampling and Extraction of Pesticides in Ambient Air 261
10.2.1.1 Sampling of Pesticides in Ambient Air 261
10.2.1.2 Extraction of Pesticides in Ambient Air 263
10.2.1.3 Cleaning of Traps for the Sampling of Pesticides
in Ambient Air 264
10.2.2 Sampling and Extraction of Pesticides in Rainwater Samples 264
10.2.2.1 Sampling of Rainwater 264
10.2.2.2 Extraction of Pesticides from Rainwater 265
10.2.3 Evaluation of Soil=Air Transfer of Pesticides
(Spray Drift and Volatilization) 270
10.2.3.1 Method Performances 273
10.2.4 Indoor Air 277
10.2.4.1 Sampling of Pesticides for Indoor Air Studies 277
10.2.4.2 Extraction of Pesticides for Indoor Air Studies 278
10.3 Analysis of Pesticides in the Atmosphere 280
10.3.1 Analysis by Gas Chromatography 280
10.3.1.1 Analysis by GC–ECD and GC–NPD 280
10.3.1.2 Analysis by GC–MS 281
10.3.2 Derivatization 281
10.3.3 Analysis by High Performance Liquid Chromatography 282
10.3.3.1 Analysis by LC–UV or LC–DAD 282
10.3.3.2 Analysis by LC–MS 282
References 283
10.1 INTRODUCTION
The intensive use of pesticide leads to the contamination of all compartments of the
environment. The atm osphere is known to be a good pathway for the worldwide
ß 2007 by Taylor & Francis Group, LLC.
dissemination of pesticides. Pesticides can enter into the atmosphere by ‘‘spray drift’’
during application, postapplication volatilization from soils and leaves, and by wind
erosion when pesticides are sorbed to soil particles and entrained into the atmosphere
on windblown particles.
1
There are few data on the significance of this pathway, and
on the quantitative effects of soil and environmental factors that influence this
process.
2
This process is most important for herbicides as they are applied either at
pre-emergence or postemergence at an early growth stage of the crops (e.g., summer
cereals, maize) when there is low soil coverage.
3
Spray drift phenomenon can be defined as the proportion of the output from an
agricultural crop sprayer that is deflected out of the target area by the action of wind.
Drift losses can occur either as vapor or as droplets.
4
These particles are so small that
they do not reach the target area and cannot be effectively captured by drift
collectors. The proportion of a pesticide spray application that exists in the gas
phase and as aerosol is therefore a loss, and should be considered in addition to drift.
Vapor drift could be a problem with volatile active substances, with applications at
high temperatures and strong wind conditions to nontarget aquatic and terrestrial
organisms. Other factors such as spray droplet size, the height of spraying, the
direction of the wind, and development of the vegetation can influence strongly
the drift of pesticides to nontarget areas during application. In general the drift
reduces when the development of the vegetation is high. Some authors state that
losses of pesticides through spray drift can vary between 1% and 30% of the
quantities applied.
5
Drift can be calculated using drift tables.
6
Volatilization is defined as the physicochemical process by which a compound is
transferred to the gas phase. It can result from evaporation from a liquid phase,
sublimation from a solid phase, evaporation from an aqueous solution, or desorption
from the soil matrix. Volatilization of pesticides from soil is governed by a combin-
ation of several factors
2
such as the physicochemical properties of the compounds
(vapor pressure, solubility, adsorption coefficient, molecular mass, chemical
nature, and reactivity), the soil properties (water content, soil temperature, soil
density, organic matter content, clay content=texture, pH), the meteorological con-
ditions (air temperature, solar radiation, rain=dew, air humidity, wind=turbulences),
and agricultural practices (application rate, application date, ploughing=incorporation,
type of formulation). Most of these parameters are closely linked and interact with
each other. Their combined effects on the volatilization process are therefore far
from linear.
7
Pesticide volatilization from plant surfa ces may occur very quickly after treat-
ment. Volatilization of more than 90% of the application dose was observed. Even
though the rate of volatilization from plants seems to be higher than that from soil,
little data are available, as pointed out by many authors.
7
Volatilization from plant
volatilization is up to three times as high as soil volatilization under similar meteoro-
logical conditions.
Vapor pressure is a key factor driving volatilization and is therefore a good
trigger for screening compounds in a tiered risk assessment scheme. Another import-
ant factor is Henry’s law coefficient (H), mostly given as the result of (V
p
3 M)=S
where V
p
is the vapor pressure, M is the molecular weight, and S is the water
ß 2007 by Taylor & Francis Group, LLC.
solubility. Under liquid conditions, H may also be used as a trigger and is therefore
only effective directly after spraying, when the spraying solution has not yet dried.
The FOCUS Air group
8
has defined that substances that are applied to plants and
have a vapor pressure less than 10
À5
Pa (at 208C), or are applied to soil and have a
vapor pressure less than 10
À4
Pa (at 208C), need not be considered in the short-range
risk assessment scheme. Substances that exceed these triggers require evaluation at
the second tier, which is done by modelling.
When in the atmosphere pesticides can be distributed between the gas and
particle phases depending on their physical and chemical properties (vapor pressure,
Henry’s law constant, etc.) and of environmental and climatic conditions (concen-
tration of particles, temperature, air humidity, etc.). The knowledge of the gas=parti-
cle partitioning of pesticides is important since this process affects the potential
removal of pesticides by wet and dry deposition and by photolysis. It can also,
together with photolysis, play a role in the atmospheric trans port of pesticides to
short or long distances.
Compounds adsorbed to particulate matter are mostly found in wet deposition.
9
Compounds mostly in the vapor phase are likely to be more evenly divided between
wet and dry deposition. Pesticides in the gas phase generally have longer atmos-
pheric residence time. In this case, the rate of removal is strongly influenced by
Henry’s law constant (H). Compounds with a low H value will be more selectively
washed out by rain.
On the other hand, the gaseous organic compounds with high H values will
demonstrate long atmospheric residence time since they will not be removed neither
by precipitation nor by particle deposition.
10
The capacity for pesticides to be transported over long distances is also a function
of their atmospheric lifetime, which is the result of emission and removal processes. In
fact long-range transport of pesticides will occur when compounds have a significant
lifetime.
11
Photooxidative processes (indirect photolysis) and light-induced reactions
(direct photolysis) are the main transformation pathways for pesticides in the atmos-
phere. According to Finlayson-Pitts and Pitts,
12
four processes can be considered (the
first three being photooxidat ive processes and the fourth being direct photolysis):
reactions with OH-radicals, which are considered to be the major sink for most air
pollutants, including pesticides,
13,14
due to the reaction with double bonds, the H
abstractive power of hydroxyl, and its high electrophilicity,
15–17
reactions with O
3
(ozone), which are only efficient with molecules with multiple bonds,
13
reactions with
NO
3
-radicals, which are potentially important for compounds containing double
bonds,
11
and direct photolysis, which acts only with molecules absorbing at
l > ~290 nm which corresponds to the cutoff region of sunlight UV radiation.
Pesticides are present in the atmosphere in the gas phase (from volatilization
processes) and in the particle phase (including aerosols). For pesticides in the gas
phase, removal by chemical transformation processes involves photolysis, reactions
with OH radicals, NO
3
radicals, O
3
, and possibly with HNO
3
in polluted urban areas.
In the particle phase, reactions with OH-radicals, O
3,
and photolytic reactions are
assumed to be the major chemical transformation processes based on information
from the gas phase.
11
ß 2007 by Taylor & Francis Group, LLC.
‘‘Deposition’’ is defined as the entry path for transport of airborne substances
from the air as an environmental compartment to the earth’s surface, i.e., to an
aquatic or terrestrial compartment. It is also a loss pathway for substances from the
air. Dry and wet deposition should be considered separately because they are subject
to different atmospheric physical processes. In essence, wet deposition is the removal
of pesticides in precipitation, while dry deposition of particulates is due to a settling
out effect (often referred to as the deposition velocity). Indeed, the removal rate of
pesticides from the atmosphere by dry and wet deposition depends partly on the
Henry’s law coef ficient, to some extent on their diffusivity in air, and on meteoro-
logical conditions (wind speed, atmospheric stability, precipitation) and on the
conditions of the surface (for dry deposition only).
The presence of modern pesticides, such as 2,4-D, in rainwat er was first reported,
in the mid 1960s, by Cohen and Pinkerton
18
but until the late 1980s, no special
attention was given to this problem. Van Dijk and Guicherit
18
and Dubus et al.
19
published, in the beginning of the 2000s, reviews on monitoring data of current-used
pesticides in rainwater for European countries. Some other measurements were also
performed in the United States
20,21
and in Japan
22
and more recently in France,
23
Germany,
24,25
Poland,
26
Belgium,
27
and Denmark.
28
Pesticides are generally present in precipitation from few ng L
À1
to several
mgL
À118
and the highest concentrations were detected during application of
pesticides to crops.
Generally, local contamination of rainwater by pesticides was observed, but
some data show contamination of rainwater by pesticides in regions where the
pesticides are not used.
18
These data suggest the potentiality of transport and
consequently the potentiality of the contamination of ecosystems far from the site
of the pesticide application.
The actual concentration of a pesticide in rainwater or wet deposition of a
pesticide does not only depend on its properties and the meteorological conditions
at the observational site, but also on the geographical distribution of the amount of
pesticide applied, the type of surface onto which it is applied, and the meteorological
conditions in the area of which the emissions contribute to the concentration at the
measuring site.
From studies preformed on the monitoring of the contamination of the atmos-
phere by pesticides, it appears that atmospheric concentrations were function of
applied quantities, physical–chemical properties of pesticides, climatic and soil
conditions, and site localization.
In general all of the year, residues of pesticides in the atmosphere were very low
in comparison with volatile organic compounds (VOCs) or PAHs in atmospheric
concentrations. Some very punctual peaks of pollution have been observed with
levels sometimes higher than other pollutants during application periods. However,
this strong contamination remains very short in terms of duration. These assumptions
are in accordance with EPCA report,
29
which concludes that extremely low levels of
Crop Protection Products can be detected in rain and fog, redeposition rates are about
1000 times lower than normal application rates less than 1 g per year, levels detected
in precipitation and air pose no risk to man and any environmental impact, particu-
larly to aquatic organisms, is extremely unlikely.
ß 2007 by Taylor & Francis Group, LLC.
Pesticides can also contaminate indoor air as a result of indoor as well as outdoor
applications (residential and occupational uses). It has been demonstrated that
pesticide residues may translocate from their original points of application as
vapors, bound to particles, or through physical transport processes. The principal
factors that influence their movement are the compounds’ physicochemical prop-
erties, the substrates contacted, and the physical activities of humans and their
pet animals.
30
Bouvier et al.
31
state that domestic pesticide uses include pet treatments, exter-
mination of household pests, removal of lice, and garden and lawn treatments while
professional uses include crop, greenhouse, cattle and pet treatments, but also pest
control operations in buildings.
Barro et al.
32
used pyrethroids because they are widely applied as insecticides in
households and greenhouses, as well as for the protection of crops. Releases into the
air represent the most important emission pathway for these insecticides. Because of
that, inhalation is an important route of exposure for humans, especially just after
spraying application in domestic indoors or agricultural close areas. The Occupa-
tional Safety and Health Administration (OSHA) has established the occupational
exposure limit for an 8 h workday, 40 workweek, at 5 mg of pyrethrins and
pyrethroids per cubic meter of workplace air (5 mg m
À3
).
Bouvier et al.
31
summarized the exposure studies of the general population,
conducted in different countries, including residential and personal measurements.
The results from these studies suggest that people were exposed at home to various
insecticides, such as organochlorines, organophosphates, and pyrethroids and also to
wood preservatives, some herbicides and fungicides.
10.2 MONITORING OF PESTICIDES IN THE ATMOSPHERE
Pesticides are present in the atmosphere at very low concentrations, except when
measurements are performed directly near the field where treatments are performed.
Because of the low concentrations, high volumes of air, rain, or fog are needed to
assess the atmospheric levels together with concentration and purification steps
before analysis.
10.2.1 SAMPLING AND EXTRACTION OF PESTICIDES IN AMBIENT AIR
Methods used for the sampling and extraction of pesticides in the atmosphere are not
diverse. Generally, the sampling is carried out by pumping the air onto traps and
extraction of pesticides on traps are performed by solid–liquid extraction.
10.2.1.1 Sampling of Pesticides in Ambient Air
Pesticides in ambient air are sampled by conventional high-volume samplers on
glass fiber or quartz filters followed by solid adsorbents, mainly polyurethane foam
(PUF) or polymeric resin (XAD-2 or XAD-4), for the collection of particle and gas
phases, respectively.
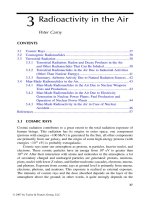
Depending on the high- volume sampler used, length or diameter of filters varied
generally between 200 3 250 mm (Andersen sampler), 102 mm diameter (PS-1 Tisch
ß 2007 by Taylor & Francis Group, LLC.
Environmental, Inc., Village of Cleves, OH) to 300 mm (LPCA collector, home made)
diameter (Figure 10.1). Generally 10–20 g of XAD-2 resin, a styrene–divinylbenzene
sorbent that retains all but the most volatile organic compounds, is employed to
trap the gaseous phase and is used alone or sandwiched between PUF plugs
(75 mm 3 37 mm). White et al.
33
used 100 g of XAD-2 resin between 2 PUF plugs.
XAD has been previously used to collect a variety of pesticides including diazinon,
chlorpyrifos, disulfoton, fonofos, mevinphos, phorate, terbufos, cyanazine, alachlor,
metolachlor, simazine, atrazine, deethyl atrazine, deisopropyl atrazine, molinate,
hexachlorobenzene, trifluralin, methyl parathion, dichlorvos, and isofenphos.
34
In a recent study, the efficiency of trapping gaseous current-used pesticides on
different traps, including PUF, XAD-2 resin, XAD-4 resin, and PUF=XAD-2=PUF
and PUF=XAD-4=PUF sandwich, was determined.
35
From this study, it appears that
XAD-2 and PUF=XAD-2=PUF are the better adsorbent for current-used pesticides
(27 pesticides tested) and the sandwich form is slightly more efficient than XAD-2
alone while PUF plugs is the less efficient.
Filter holder
XAD-2 resin holder
Rain protection
Flow meter
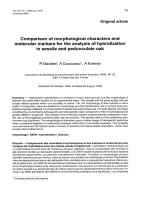
FIGURE 10.1 High-volume sampler developed in the LPCA. (From Scheyer, A., PhD thesis,
University of Strasbourg, 2004.)
ß 2007 by Taylor & Francis Group, LLC.
The duration of sampling depends mainly on the purpose of the sampling and
on the detection limits of the analytical method used. Generally, sampling
varied between 24 h and 1 week and the total air pumped varied between
250 m
3
,
36,37
525–1081 m
3
,
33
and 2500 m
3
of air.
38
A sampling time of about 24 h
is generally sufficient to reach the detection limit of pesticides in middle latitude
atmosphere and avoid cloggi ng-up the filters.
39–41
10.2.1.2 Extraction of Pesticides in Ambient Air
After sampling, traps are separately extracted by using Soxhlet extraction with
different solvents used alone, such as acetone,
38
or as a mixture, such as 36% ethyl-
acetate in n-hexane,
42
(85:15) n-hexane=CH
2
Cl
2
,
40,43
25% CH
2
Cl
2
in n-hexane,
44
(50:50) n-hexane=acetone,
34
or (50:50) n-hexane=methylene chloride
36,37
for 12–24
h. In some studies, the ASTM D4861–91 method was followed.
33
After Soxhlet extraction, extracts were dried with sodium sulfate and reduced to
0.5 mL using a Kuderna Danish concentrator followed by nitrogen gas evaporation
42
or were simply concentrated to about 1 mL by using a conventional rotary evapor-
ator.
36,37,41
Depending on the authors and on the analytical method used, a cleanup procedu re
can be performed after concentration. Foreman et al.
42
passed extracts through a
Pasteur pipet column containing 0.75 g of fully activated Florisil overlain with 1 cm
of powdered sodium sulfate. Pesticides were eluted using 4 mL of ethyl acetate into a
test tube containing 0.1 mL of a perdeuterated polycyclic aromatic hydrocarbon used
as internal standard. The extract was evaporated to 150 mL using nitrogen gas,
transferred to autosampler vial inserts using a 100 mL toluene rinse. Sauret et al.
41
and Scheyer et al.
36,37
used GC–MS–MS for the analysis of airborne pesticides and
they do not perform a cleanup procedure.
Badawy,
44
who used GC–ECD for the analysis of pesticides in particulate
samples, concentrated Soxhlet extracts to 5 mL and firstly removed elemental
sulphur by reaction with mercury. After that, extracts were quantitatively trans ferred
to a column chromatography for separation into two fractions using 3 g of 5%
deactived alumina. Fraction one (FI), which contains chlorobiphenyls, chloroben-
zenes, and hexachlorocyclohexa ne, was eluted with 16 mL of n-hexane. Second
fraction (FII), includes permethrin, cypermethrin, deltamethrin, and chloropyrophos
(rosfin), was eluted with 6 mL of 20% ether in hexane.
In the 1990s, a method using fractionation by HPLC on a silica column was used
for the cleanup of atmospheric extracts.
45,46
After extraction, samples were fraction-
ated on a silica column using an n-hexane=MTBE gradient for isolating nonpolar,
medium-polar, and polar pesticides, which were analyzed by specific methods
including GC–ECD and HPLC–UV. In the met hod developed by Millet et al.,
46
three fractions were obtained; the first one contains pp
0
DDT, pp
0
DDD, pp
0
DDE,
aldrin, dieldrin, HCB, fenpropathrin, and mecoprop, the second one contains methyl-
parathion, and the third one contains aldicarb, atrazine, and isoproturon. This step
was necessary since fractions 2 and 3 were analyzed by HPLC–UV, a nonspecific
method.
ß 2007 by Taylor & Francis Group, LLC.
10. 2.1.3 Cleaning of Traps fo r the Sampl ing of Pe sticides in Amb ient Air
Tr aps (XAD and PUF foam ) were precleaned before use by So xhlet succes sive
cleani ng steps or by one cleaning step dependi ng on authors. Scheyer et al.
36,37
precl eaned the filters and the XAD -2 resi n by 24 h Soxhlet (50:5 0) with n-hexane=
CH
2
Cl
2
and store d them in clean bags before use, whi le Peck and Hornbuckl e
34
precl eaned the XAD-2 resin with succes sive 24 h Soxhlet extra ctions wi th methanol,
ace tone, dichl oromethane , hexane, and 5 0=50 hexane=ac etone prior to samplin g.
Some author s (i.e., Cou pe et al.
21
) used a hea ter to clean fi lters (backi ng at 450 8 C
for examp le). In all cases, a blank analys is is requi red to check the ef ficiency of the
cleani ng and storage before use.
The ultr asonic bath is poorly used for the extra ction of filters and resins a fter
samp ling . Har aguchi et al.
39
used this technique for thei r study of pesticide s in the
atm ospher e in Japan.
10.2.2 S AMPLING AND E XTRACTION OF P ESTICIDES IN R AINWATER SAMPLES
10. 2.2.1 Sampling of Rainwa ter
Rai nwater samples are c ollected using diff erent syste ms dependi ng on studies and
author s. Asman et al.
47
and Epple et al.
24
used for thei r study on pesticide s in
rainw ater in Denmark and Ger many, respec tive ly, a cooled wet-onl y collec tor of
the type NSA 181=KE made by G.K. W alter Eigenbr odt Env ironment al Measu re-
ment s Systems (Konigs moor , Germany) . It consi sts of a glass 2(D uran) funnel of
~500 cm diam eter conne cted to a g lass bottle that is kept in a dark refrigerat or
below the funnel at a const ant temperat ure of 48C –88 C. A conductivi ty sensor is
acti vated when it starts to rain and then the lid on top of the funnel is remo ved.
At the end of the rain period the lid is again moved back onto the funnel. With
this system, no dry deposit to the funnel during dry periods is collected. Millet
et al.
48
and Scheyer et al.
49,50
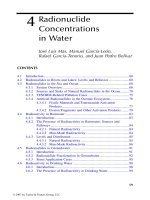
used also a wet-only rainwater sampler built by
Précis Mécanique (France). This collector is agreed by the French Meteorological
So ciety (Figure 10.2). It consi sts of a PVC funnel of 250 mm diam eter connect ed to
a glass bottle kept in the dark. No freezing of the bottle was installed and the
stability of the sample was checked for one week in warm months. This collector
is equipped with a moisture sensor which promotes the opening of the lid when
rain occurs.
Quaghebeur et al.
27
used for their study in Belgium, a bulk collector made
in stainless steel by the FEA (Flemish Environmental Agency, Ghent, Belgium).
The sampler consists of a funnel (D ~ 0.5 m) the sides of which meet at an
angle of 1208. The outlet of the funnel is equipped with a perforated plate
(D ~ 0.05 m). The holes have a diameter of 0.002 m. The funnel is connected with
a collecting flask.
Haraguchi et al.
22
and Grynkiewicz et al.
26
used a very simple bulk sampler
which consists of a stainless steel funnel (40 cm or 0.5 m
2
diameter, respectively)
inserted in a glass bottle for their study of pesticides in rainwater in Japan and
Poland, respectively.
ß 2007 by Taylor & Francis Group, LLC.
10.2.2.2 Extraction of Pesticides from Rainwater
Extraction of pesticides was made using the conventional method used for water;
liquid–liquid extraction (LLE), solid-phase extraction (SPE), and solid-phase
microextraction (SPME).
10.2.2.2.1 Liquid–liqu id extraction
This method was used by many authors. Chevreuil et al.
51
extracted pesticides from
rainwater by LLE three times with a mixture of 85% n -hexane=15% methylene
chloride. Recoveries obtained were higher than 95% except for atrazine degradation
metabolites (>75%). Depending on the chemical nature of the pesticide, Quaghe-
beur et al.
27
used different LLE extraction methods. Organochlorine pesticides,
polychlorinated biphenyls, and trifluralin were extracted from the rainwater sample
using petroleum ether (extraction yield > 80%) while organophosphorous and
organonitrogen compounds (i.e., atrazine) were extracted with dichloromethane
(extraction yield > 80%).
Rain sensor
Collection cone
Sampling bottle
Protection cover
FIGURE 10.2 Wet-only rainwater collector. (From Scheyer, A., PhD thesis, University of
Strasbourg, 2004.)
ß 2007 by Taylor & Francis Group, LLC.
Kumari et al.
52
for their study of pesticides in rainwater in India used the
following procedure to extract pesticides from rainwater. Representative (500 mL)
sample of water was taken in 1 L separatory funnel and 15–20 g of sodium chloride
was added. Liquid–liquid extraction (LLE) with 3 3 50 mL of 15% dichloromethane
in hexane was performed. The combined organic phases were filtered through
anhydrous sodium sulphate and this filtered extract was concentrated to near dryness
on rotary vacuum evaporator. Complete removal of dichloromethane traces was
ensured by adding 5 mL fractions of hexane twice and concentrating on gas manifold
evaporator since electron capture detection (ECD) was used for the analysis of some
pesticides.
All these authors do not use a cleanup procedure after LLE of rainwater samples
mainly since they used very specific methods such as GC–ECD, GC–NPD, and
GC–MS.
10.2.2.2.2 Solid-phase extraction
Solid-phase extraction (SPE) was used by Haraguchi et al.,
22
Millet et al.,
46
Coupe
et al.,
21
Grynkiewicz et al.,
26
Bossi et al.,
53
and Asman et al.
28
These authors used XAD-2 resin or C
18
cartridges and they follow the classical
procedure of SPE extraction consisting of conditioning of the cartridge, loading of
the sample, and elution of pesticides by different solvents. Haraguchi et al.
22
used
dichloromethane for the elution of pesticides trapped on XAD-2 cartridge while
Asman et al.
28
used 5 mL of ethylacetate=hexane mixture (99:1 v=v) for the elution
of pesticides from Oasis HLB 1000 mg cartridges (Waters) before GC–MS analysis.
A 200 mL volume of isooctane was added to the extract as a keeper to avoid losses of
more volatile compounds during evaporation. For LC–MS–MS analysis, these
authors used Oasis HLB 200 mg cartridges (Waters) and pesticides were eluted
with 8 mL methanol. The extracts were evaporated to dryness and then redissolved in
1 mL of a Millipore water=methanol mixture (90:10 v=v) before LC–MS–MS in ESI
mode analysis.
Grynkiewicz et al.
26
used Lichrolut EN 200 mg cartridges (Merck) for the
extraction of pesticides in rainwater. Pesticides were eluted with 6 mL of a mixture
of methanol and acetonitrile (1:1). After it, a gentle evaporation to dryness under
nitrogen was performed before analysis by GC–ECD (organochlorine pesticides) and
GC–NPD (organophosphorous and organonitrogen).
Epple et al.
24
have compared two kinds of SPE cartridges for the extraction of
pesticides in rainwater samples and their analysis by GC–NPD: Bakerbond C
18
solid-phase extraction cartridges (Baker, Phillipsburg, NJ, USA) and Chromabond
HR-P SDB (styrene–divinyl–benzene copolymer) cartridges 200 mg (Macherey-
Nagel, Duren, Germany). The latter one is more efficient for polar compounds,
such as the triazine metabolites. Prior to SPE extraction, rainwater samples wer e
filtered by a glass fiber prefilter followed by a nylon membrane filter 0.45 nm. After
that, filtered rainwater was filled with 5% of tetrahydrofuran (THF).
Elution was carried out with 5 mL of THF, the solve nt evaporated, and the
residue dried with a gentle stream of nitrogen and then dissolved in 750 mL of ethyl
acetate. The sample was then cleaned by small silica-gel columns to remove polar
components from precipitation samples. For this , 3 mL silica-gel columns
ß 2007 by Taylor & Francis Group, LLC.
(5 3 0.9 cm boro silicate glass) with Teflon frits were used. The silica-gel type (60,
70–230 mesh, Merck) was d ried overnight at 1308C, mixed with 5% by weight of
water, and transferred into glass tubes as a mixture with ethyl acetate, so that each
column contained 0.8 g of silica gel. The sample (750 mL) was transferred to the
column and eluted with 4 mL of ethyl acetate before GC–NPD analysis.
Recoveries of the method for all the pesticides studied are summarized in
Table 10.1.
TABLE 10.1
Relative Standard Deviations, RSD, Recoveries, Rec., and Determination
Limits, DL, (n ¼ 10, P ¼ 95%) for Determination of Pesticides in
Wet-deposition Samples
Bakerbond C
18
Chromabond HR-P SDB
Pesticide
RSD
(%)
Rec.
(%)
DL
(ng L
À1
)
RSD
(%)
Rec.
(%)
DL
(ng L
À1
)
Desethyl atrazine 2 1.64 31 15 1.39 102 13
Desethyl terbuthylazine 2 1.91 95 19 1.20 102 12
Simazine 2 1.09 98 10 1.15 98 11
Atrazine 2 1.10 99 10 1.19 99 11
Propazine 2 1.38 101 13 1.56 98 15
Terbuthylazine 2 1.84 97 18 1.48 97 15
Diazinon 1 2.58 89 5 3.62 87 6
Triallate 3 2.64 106 110 3.36 85 130
Sebuthylazine 2 1.23 96 11 —— —
Metribuzin 3 4.21 81 95 3.35 79 75
Parathion-methyl 1 3.14 105 6 2.21 83 4.5
Metalaxyl 4 1.04 99 75 1.82 93 120
Prosulfocarb 3 2.48 100 60 3.81 94 90
Metolachlor 4 1.35 104 105 1.03 98 80
Parathion 1 3.11 103 6 3.16 82 6
Metazachlor 3 1.36 98 30 1.03 103 25
Pendimethalin3 2.17 90 50 52.8 41 1300
Triadimenol 3 1.45 100 60 1.82 87 75
Triadimenol 3 1.42 101 60 2.44 88 100
Napropamide 3 1.13 101 35 —— —
Flusilazol 3 1.70 97 40 2.52 81 60
Propiconazol 3 1.90 94 75 2.74 77 110
Propiconazol 3 1.25 98 50 1.52 92 60
Tebuconazole 3 2.26 93 50 3.46 74 75
Bifenox 4 0.95 83 210 —— —
Pyrazophos 1 6.10 103 25 3.31 95 15
Prochloraz 4 3.32 86 300 —— —
Source: From Epple, J. et al., Geoderma, 105, 327, 2002. With permission.
Concentration ranges: (1) 5–50 ng L
À1
; (2) 20–200 ng L
À1
; (3) 100–1000 ng L
À1
; (4) 250–2500 ng L
À1
.
Enantiomeric pairs numbered in the order of their elution times.
ß 2007 by Taylor & Francis Group, LLC.
Millet et al.
48
used also SPE extractio n on Sep-Pak C
18
cartridges (Wat ers) and
elut ion with met hanol for the ana lysis of pesti cides in rainwat er. Before analysis,
they perfor med a HPLC fract ionation as descri bed earli er.
46
10. 2.2.2.3 S olid-phase microext raction
Am ong studies on pesticide s in precipita tion, extra ction of pesticide s was performed
using classical develo ped met hods for surfa ce wat er. No speci al develo pment was
speci ficall y done for atm ospheric water. More recently, Scheyer et al.
49,50
used
SPM E for the analys is of pesticide s in rainwat er by GC– MS –MS. The y used direct
extra ctio n for stable pesti cides and a deriv atizatio n step couple d to SPME extrac tion
for highly polar pesticide s or therm o labi le pesticide s. These develo pments wer e
deriv ed from studies in wat er. SPME is a very interesting met hod for a fast and
inexpe nsive deter minati on of organic pollutant s in water, including rainwat er. The
mai n a dvantage of SPM E techniques is that it integrate s samp ling , extra ction, and
con centratio n in one step. This met hod is actually poorly used for the extra ction of
organi c pollutant s in atmospher ic water probably because of low levels commonl y
found in precipita tion.
For the evaluation of the spatial and temporal variation s of pesticide s ’ concen tra-
tion s in rainwat er between urban (Stra sbourg, Eas t of France) and rural (Erst ein, Eas t of
Fra nce) areas, Scheyer et al.
49
have develo ped a method using SPME and ion trap GC –
MS –MS for the analysis of 20 pesticide s (alac hlor, atrazine, azinph os-ethyl, azinph os-
met hyl, captan , chlor fenvi nphos, dichl orvos, di flufenican, a and b-endos ulfan ,
iprod ione, lindane, metolachl or, mevinphos , parat hion-met hyl, phosalone, phosmet,
tebuco nazole , tria dimefon, and tri fluralin) easily a nalyzable by gas c hromatogr aphy
(GC) . For some seven other pe sticides (bromo xynil, chlorotol uron, diuro n, isopro-
turon , 2,4-MCPA , MCPP , and 2,4-D), Scheyer et al.
50
used SPME and GC –MS –MS
bu t they add, prior to GC ana lysis, a deriv atizatio n step. SPME was chosen because it
perm its wi th accuracy a rapid extractio n and analys is of a great number o f samples and
MS –MS enable s the analys is of pesticide s at trace level in the presence of inte rfering
compo unds wi thout losing ident i fication capabi lity because of a drast ic reduction of
the backgro und noise .
The fi rst step in develo ping a met hod for SPME is the choice of the type of
fi ber. To do that , all other param eters are fixed (temperatu re, pH, ionic strength, etc.).
The fiber dep th in the inje ctor was set at 3.4 cm and the tim e of the thermal
desorp tion in the spli t–spli tless injector was 5 min at 250 8 C, as recom mende d by
Su pelco and con fi rmed by Scheyer et al.
49
Deep er fiber in the injector gave rise to
carryo ver effect s and less deepe r fi ber caused loss of respon se. The liner purge
was closed during the desorption of the analytes from the SPME fiber in the split–
splitless injector (2 min delay time). A blank must be carried out with the same
fiber to confirm that all the compounds were desorbed within 5 min of thermal
desorption.
In the method of Scheyer et al.,
49
extractions were performed by immersion of the
fiber in 3 mL of sample, with permanent stirring and tem perature control at 408C,
during 30 min. Indeed, a headspace coating of the fiber is possible but, in the case of
pesticides, this method cannot be used with efficiency because of the general low
vo latility of pesticide s from wat er (Figure 10.3). How ever, for some volat ile pesticide s
ß 2007 by Taylor & Francis Group, LLC.
such as some organophosphorous pesticides, headspace coating of the fiber can be
developed.
Since the SPME technique depends on an equilibrium process that involves the
adsorption of analytes from a liquid sample into the polymeric phase according to
their partition coefficient, the determination of the time (duration of extraction)
required to reach this equilibrium for each compound is required.
The equilibration rate is limited by the mass transfer rate of the analyte through a
thin static aqueous layer at the fiber–solution interface, the distribution constant of
the analyte, and the thickness and the kind of fiber coating
54
Moreover analytes with
high molecular masses are expected to need longer equilibrium times because of
their lower diffusion coefficient since the equilibrium time is inversely proportional
to the diffusion coefficient.
55
The temperature and the duration of extraction are associated since when increas-
ing the temperature, it is possible to reach the equilibrium faster. Temperature can also
modify the partition coefficient of the fiber and consequently decrease the amount of
extracted compound.
54
A compromise has to be determined between the temperature
and the duration of the extraction in order to obtain a sensitive method for the analysis
of pesticides in rainwater.
To increase the extraction efficiencies, it is possible to add some salts which have
for effect to modify the ioni c strength and to decrease the solubility of the molecules
in the water.
SPME of Pesticides in Rainwater with a Derivatisation Step. The SPME tech-
nique, firstly developed for GC analysis, integrates sampling, extraction, and con-
centration in one step followed by GC analysis, even the use of HPLC is possible.
However, many pesticides such as phenyl ureas (PUHs) , phenoxy acids, or
carbamates cannot be analyzed directly by GC because of their low volatility
or thermal instability. GC analysis of these molecules requires a derivatization step
to stabilize or increase their volatilities.
Immersion mode
Headspace mode
Stirrer
Sample
Fiber
exposed
Septum
SPME holder
Needle
Heating block
Split
/Splitless
injector
Capillary GC column
FIGURE 10.3 Principle of SPME extraction. (From Scheyer, A., PhD thesis, University of
Strasbourg, 2004.)
ß 2007 by Taylor & Francis Group, LLC.
The use of SPME with derivatization is not commonly used for pesticides,
especially in the simultaneous determination of many class of pesticides such as
phenyl ureas, phenoxy acids, phenolic herbicides, etc.
Derivatization (sylilation, alkylation, acylation) is employed for molecules
where properties ca nnot permit their direct analysis by GC.
56,57
Alkylation with PFBBr is a very common reaction and permits the derivatization
of molecules containing NH groups (chlorotoluron, diuron, and isoproturon),
–OH groups on aromatic ring (bromoxynil) and –COOH groups (MCPP, 2,4-D,
2,4-MCPA). The mechanism of reaction on a molecule containing a hydrogen acid is
a bimolecular nucleophile substitution (SN
2
).
58
After extraction, samples present in organic solvents are derivatized by addition
of a small amount of derivatizing agent. In the case of SPME, no solve nt is present
and some approaches have been tested for combining derivatization and SPME.
54
Derivatization directly in the aqueous phase followed by SPME extraction
(direct technique).
Derivatization on the fiber. This method consists of headspace coating of
PFBBr for 10
0
of the fiber followed by SPME extraction. In this case,
extraction and derivatization are made simultaneously.
Extraction of the analytes present in water followed by derivatization on the
fiber or onto the GC injector.
For the direct technique, it is necessary to adjust the pH of the water below of the
pKa of the molecules to be derivatized (i.e., <2.73, which is the lowest pKa value for
2,4-D) since in this case they are protonated and consequ ently derivatization
becomes possible.
Scheyer et al.
50
clearly showed that the exposure of the fiber to the derivatization
reagent followed by extraction gave the better results and this method was used for
the analysis of the seven pesticides, which required derivatization before analysis by
GC, in rainwater.
10.2.3 EVALUATION OF SOIL/AIR TRANSFER OF PESTICIDES
(SPRAY DRIFT AND VOLATILIZATION)
As shown in the precedent paragraph, pesticides in ambient air are commonly
sampled by high-volume samplers on filters and adsorbents (PUFs, XAD-2). After
sampling, compounds trapped on the adsorbent must be released before determin-
ation. For this, a solvent for desorption with Soxhlet or ultrasonic extraction,
followed by a concentration step, is commonly used. It is generally time consuming
and the different steps (extraction, cleanup, concentration, etc.) induced many losses
and subsequently increased detection limits.
Even if the association of high-volume sampling and solvent extraction is
accurate for the measurem ent of ambient level of trace contaminants, this method
cannot be applied to assess spray drift and volatilization processes. Indeed, this kind
of study required a short sampling periodicity to be close to the variation of
atmospheric dissipation processes.
ß 2007 by Taylor & Francis Group, LLC.
As quoted by Majewski,
59
estimation of volatilization rate in the field is classically
carried out using the aerodynamic profile. It gives an estimate of this mass transfer
under actual field conditions and its variation with time. This method, based on the
measurements of vertical profiles of pesticide concentrations in the atmosphere, needs
a good precision for the estimation of these concentrations. Also, the determination of
concentration gradients requires the measurements of concentrations at four heights at
least and consequently greatly increases the number of samples to analyze.
Thermal desorption can present a novel approach since it substantially simplifies
analyses (no concentration step is needed) and increases sensitivity (a large part of
the preconcentrated material may be recovered for determination), and detection
limits and background noise are lower because of the disappearance of solvent
components. Moreover, this technique is easily automatable. Because of these
aspects, it seems to be an interesting alternative to solvent extraction to assess
atmospheric transfer of pesticides during and after application. Thermal desorption
has often been used for the analysis of VOCs in indoor and outdoor atmospheres.
Thermal desorption for the analysis of pesticides has already been described for the
volatile and stabl e pesticides trifluralin and triallate
60,61
in field measurements and
atrazine in laboratory volatilization experiments.
62
Thermal desorption was extended to six pesticides in order to evaluate atmos-
pheric transfer of pesticides following applicati on (spray drift and volatilization).
63
To
the best of my knowledge, this was the first time that a thermal desorption unit–GC
was interfaced with a mass selective detector to provide both pesticide quantification
and confirmation. From the first results obtained in this study, it appears that thermal
desorption followed by GC–mass spectroscopy (MS) analysis is accurate and sensi-
tive but presents some limitations, especially as a result of the physicochemical
properties of pesticides such as thermal stability and low volatility.
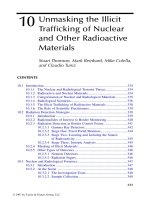
The principle of thermal desorption is detailed in Figure 10.4. It consists of two
steps: (1) primary desorption, which consists of desorption of pesticides adsorbed on
PRIMARY DESORPTION
Cold
trap
Cold
trap
Mass
spectrometer
Sampling
tube
Split
He
Mass
spectrometer
Thermal desorption
of sampling tube
(300°C during 15 min)
Thermal
desorption of cold
trap
Cold trap
re-condense
compound
GC
column
Detection and
identification
Ϫ30°C
40°C
Ϫ1
.s
390°C
↓
ADVANTAGES
• Automatisation
•
Decrease of manipulations of
samples
• Increase of sensitivity (no step
between sampling and analysis)
DISADVANTAGES
• Only one injection
• Decomposition of compound
possible with temperature
• Storage stability
Advantages and
disadvantages of this
technique:
Sampling
tube
He
He
SECONDARY DESORPTION
FIGURE 10.4 Principle of thermal desorption.
ß 2007 by Taylor & Francis Group, LLC.
the resin of the sampling tube and accumulation on a trap maintained at À 308Cby
peltier effect and (2) secondary desorption, which consists of the rapid heating of the
trap before introduction on the GC column maintained at 508C.
Application of thermal desorption for pesticides presents some difficulties
mainly because of the very low volatility of some of them. Briand et al.
64
have
extended the method developed by Clément et al.
63
to deethylatrazine (DEA),
deisopropylatrazine (DIA), carbofuran, cyprodinil, epoxyconazole, iprodione,
3,5-dichloroaniline, lindane, a-HCH, metolachlor, terbuconazole, and trifluralin.
The main problem dealing with the extraction of pesticides is the memory effects
on the thermal desorption system. This problem was located on the cold trap
containing glass wool.
To visualize an eventual memory effect for the 10 pesticides and metabolites
under study, first experiments were performed as follows: A 400 ng amount of each
compound was deposited at the end of a tube which was placed in the thermal
desorption unit followed by four empty tubes (tubes without adsorbent) which were
analyzed following the spiked tube.
To check the influence of the amount of pesticides accumulated on the cold trap,
two parameter s can be modified in the ATD system, the inlet-split flow rate (initially
at 0 mL min
À1
), situated between the tube and the trap and the outlet-split flow rate
(initially at 20 mL min
À1
), located after the cold trap just before injection into the
analytical column. This last flow rate imposed the gas velocity in the cold trap.
To evalua te the memory effect, two kinds of experiments were performed: one
modifying inlet-split flow rate of 10 mL min
À1
(outlet-split flow rate 20 mL min
À1
)
and second modifying outlet-split flow rate (inlet-split flow rate 0 mL min
À1
). From the
first experiment (inlet-split flow rate of 10 mL min
À1
), a strong decrease of the
memory effect in all empty tubes, analyzed after sample tube, was observed since it
remained only for cyprodinyl (0.93%) and tebuconazole (1.70%). Thus, the amount
of pesticides reaching the cold trap seems to be the reason for the observed
memory effect. However, a strong loss of sensitivity (20%–60%) especially for the
most volatile compounds (DIA, DEA, a-HCH, trifluralin, carbofuran, lindane,
atrazine, and alachlor) was observed. Thus, increasing the inlet-split flow rate
cannot be used to resolve the memory effect problem. Experiments conduct ed with
increasing outlet-split flow rate (30 and 35 mL min
À1
) induced a strong decrease of
the memory effect: 0.90% for cyprodynil with 30 mL min
À1
, 1% for iprodione with
35 mL min
À1
in the first empty tube. Percentages obtained in the second tube were
not significant and can be neglected.
From these experiments, it appeared that increasing the outlet-split flow rate
from 20 to 30 mL min
À1
limit the memory effect. These outlet splits correspond to
5% and 3.3%, respectively, of the total amount of spiked compound in the tube
actually injected into the GC-column. Increasing the outlet-split flow rate to 35 mL
min
À1
will not be accurate, since a too great loss of sensitivity was observed.
Loss of sensitivity when incre asing outlet-split can be compared to the principle
of GC split=splitless injector, in which more volatile compounds (especially solvent)
are preferentially removed before entering in the column.
Experiments were conducted without glass wool in the cold trap to remo ve the
memory effect completely. These experiments showed that the memory effect was
ß 2007 by Taylor & Francis Group, LLC.
very low (maximum 0.10% for epoxyconazole) and disappeared completely in the
second empty tube. The resolution and sensitivity of each pesticide and metaboli te
under study were not affected by this removal since no significant decrease of areas
was observed.
An experiment was performed by changing desorption rate of the cold trap from
>40 to 58Cs
À1
. This change greatly improved the peak resolution. From the
different tests performed, it appeared that the memory effect was located in the
cold trap, and that it could be partially removed by u sing an empty trap. Following
these observations, complementary tests were performed with decreased outlet-split
flow rates (25 and 20 mL min
À1
) to increase the method sensitivity. Tests performed
with spiked tube at 400 ng showed recurrence of the memory effect with an outl et-
split flow rate under 25 mL min
À1
; therefore, no more tests were conducted.
Decreasing the outlet-s plit flow rate could be envisaged for very low amounts of
pesticides to improve method performances.
ATD optimal conditions for the quantitative desorption of the 10 pesticides and
metabolites under study are presented in Table 10.2.
This study used an ATD 400 from Perkin-Elmer Corp. (Norwalk, CT, USA)
where some temperature ranges are limited (transfer line, valve). With Turbomatrix
new systems, temperature can be increased and can improve the efficiency of thermal
desorption for pesticides analysis.
10.2.3.1 Method Performances
10.2.3.1.1 ATD–GC=MS repeatability and calibration range
For repeatability experiments, five assays were conducted successively with condi-
tions defined in Table 10.2. From this experiment, it appears that repeatability
(determined by five replicati ons) was good for each compound, with a relative
standard deviation of 9% – 12% (deviation due to the manual tube spiking step is
included in this result).
TABLE 10.2
ATD Conditions
Parameter Initial Conditions Optimal Conditions
Oven temperature for tube 3508C 3508C
Desorb flow and time for tube 60 mL min
À1
; 15 min 60 mL min
À1
Inlet-split 0 mL min
À1
0 mL min
À1
Temperature of cold trap À308C À308C
Temperature of desorption for the trap 3908C 3908C
Desorb time for the trap 15 min 15 min
Trap fast (À308C to 3908C) Yes (>408Cs
À1
)No
Outlet-split 20 mL min
À1
25 mL min
À1
Temperature of the transfer valve 2508C 2508C
Temperature of the transfer line 2258C 2258C
Source: From Briand, O. et al., Anal. Bioanal. Chem., 374, 848, 2002.
ß 2007 by Taylor & Francis Group, LLC.
A calibration range was performed between 1 and 100 ng deposited on tubes.
Linear range was observed as listed below:
.
1–100 ng for carbofuran and epoxyconazole
.
2–100 ng for alachlor and cyprodinyl and ÀHCH and trifluralin
.
4–100 ng for atrazine, iprodione, metolachlor, and tebuconazole
.
10–100 ng for desethylatrazine, disopropylatrazine, and 3,5-dichloroaniline
Detection limits were determined as two times lower than values of the quantification
limit. No memory effect was observed in these range of concentrations.
10.2.3.1.2 Pesticides recoveries from Tenax
The optimal temperature for sampling tube desorption was 3508C. No trace of
compounds had been observed during the second desorption of the tube. Recovery
efficiencies obtained from Equation 10.1 equal 100%.
R:Ei (%) ¼
A
i,1
À A
Bi
(A
i,1
þ A
i,2
) À A
Bi
 100%, (10:1)
where
R.E
i
is the recovery efficiency for the analyte i
A
i,1
is the peak area of analyte i for the first desorption of the spiked tube
A
i,2
is the peak area of analyte i for the second desorption
A
Bi
is the count of analyte i from the adsorbent blank (if any)
No additional peak was observed in GC=MS, which seems to indicate that no
thermal degradation occurs during tube desorption. Recovery efficiencies obtained at
the other temperatures were lower than those at 3508C and were directly correlated to
desorption temperature. Recovery efficiencies ranged from 17%, 22%, and 35% at
2258C for low volatile pesticides (iprodione, epoxyconazole, and tebuconazole,
respectively) to more than 90% at 3008C. The other compounds gave recovery
efficiencies of 60%–95% at 2258C–3008C.
10.2.3.1.3 Resin efficiency
Performance of Tenax TA to retain pesticides under study was tested by an experi-
ment with three tubes in series and a GC oven. This technique offers some advan-
tages such as simplicity and low cost, or the possibil ity to investigate two parameters
at the same time, to evaluate adsorbent performances or reliabilities, retention
efficiency, and breakthrough percentage.
For this, three tubes were connected in series. A heating system was combined
with a stream of gas to sweep volatile pesticides from solid (125 mg of Tenax
1
enclosed in tube 1) into the vapor phase. Pesti cides were then adsorbed on sample
tubes (tubes 2 and 3), also packed with 125 mg of Tenax
1
.
Tube number 1, located in GC oven, spiked with a known amount of pesticides,
was connected with Teflon tubes to a pump at one extremity and to two precondi-
tioned Tenax
1
tubes (kept at room temperature) on the other. The tube 1 was then
ß 2007 by Taylor & Francis Group, LLC.
heated in GC oven at the same temperature than the first step of the ATD (3508C).
After 15 min, the temperature of GC oven was brought down to and maintained at
608C for 2 h 45 min. During all experiments, a stream of clean air was continuously
passed through the first tube to carry volatiles in subsequent tubes 2 and 3. In total,
300 L of air were passed through tubes for 3 h to simulate field conditions. Tubes 2
and 3 were maintained at ambient temperature (208C–258C) with a stream of
compressed air on their surface.
At the end of the experiment, tubes were separated and analyzed by ATD–
GC=MS. For each compound, peak areas were then compared to a reference value
(achieved by direct injection on the top of Tenax
1
tube just before analysis).
With this experiment, it was possible to calculate the actual quantity of pesticides
which was volatilized (Equation 10.2, Tenax
1
retention efficiency Equation 10.3)
and to collect nonret ained pesticides with the third tube in order to estimate break-
through percentage (Equation 10.4).
VÁE
i
(%) ¼
A
i,ref
À A
i,T1
A
i,ref
 100%, (10:2)
where
VÁE
i
is the volatilization efficiency for the analyte i
A
i,ref
is the peak area of analyte i for the reference desorption (20 ng injected)
A
i,T1
is the peak area of analyte i for the tube 1 analyzed
T
R
ÁE
i
(%) ¼
A
i,T2
A
i,ref
 VÁE
i
 100%; (10:3)
where
T
R
ÁE
i
is the Tenax
1
retention efficiency for the analyte i
A
i,T2
is the peak area of analyte i for the tube 2
A
i,ref
3 VÁE
i
represents the actual volatilized quantity
BÁP
i
(%) ¼
A
i,T3
A
i,ref
 VÁE
i
 100%, (10:4)
where
BÁP
i
is the breakthrough percent age for the analyte i
A
i,T3
is the peak area of analyte i for the tube 3
10.2.3.1.4 Tenax
1
TA retention efficiency
Testing the capacity of an adsorbent to quantitatively retain all molecules present in
the air during the sampling duration is fundamental in terms of accuracy and
precision of the method.
Determining the maximum quantity of air passed through the adsorbent with
100% retention of molecules or breakthrough volume is required when air
sampling is performed. Generally, breakthrough is determined by using two
ß 2007 by Taylor & Francis Group, LLC.
sampling tubes in series. Molecules going to the second indicate the limit of
the sampling method.
To test the Tenax
1
TA retention efficiency, the same device as the one used for
the resin efficiency was used. This experiment refers to the physical interaction
between a molecule of gas, coming from the tube 1, and a solid surface, the porous
polymer of the adsorbent. The sorption capacity was determined by passing a known
amount M
i
of analyte i through the sorbent bed and then an alyzing the tube and
measuring the amount of retained pesticides.
Vapor pesticide mixture comes from tube 1, where compounds that were first in
adsorbed form were volatilized by heating action, and transferred to tube 2.
In lack of suitable standard gaseous mixtures, this test was an alternative from a
direct liquid injection on the cartridge, and must be more representative of field
experiments where pesticides are in vapor phase or coming as an aerosol. Values of
efficiency obtained ranged between 68.4% and 99.1%. Two phenomenon could
explain this variability: a competitive adsorption (the molecules with the highest
affinity for Tenax
1
displace those of lowest affinity previously adsorbed and
produce a migration in the sorbent bed) or kinetics of capture (which are different
for each compound).
Presence of pesticide s in the third tube indicated that some of them had pene-
trated through the front section. Thus, in the first tube, adsorption capacity was
exceeded so that some layers of the sorbent bed must be partially or completely
saturated and breakthrough occurs.
However, breakthrough percentage gives an indicative value of nonretained
pesticides for a known volume of gas passed through the tube but cannot replace
breakthrough volume or breakthrough time measurements using stable standard
atmosphere and a continuous effluent monitoring with an appropriate detector.
These conditions are rarely obtained for pesticides studies.
Breakthrough percentage was never more than 0.75%, whatever the compound,
for about 300 L passed through the tubes. This appeared to be very low and have a
direct application on field experiment since this volume covers greatly all field-
sampling volumes.
Nevertheless, an increase to 10% of the breakthrough in relation with increasing
ambient temperature from 208Cto608C was observed.
10.2.3.1.5 Recoveries and method detection limits
From the previous results described (resin retention efficiency and recoveries from
Tenax
1
), no corrections of the atmospheric concentrations were needed.
According to the type of studies, determination of spray drift or characterization
of postapplication transfers, or determinatio n of volatilization fluxes, sampling
periods can be very different and conduct variable detection limits of the method.
For spray drift, sampling perio ds are short, about a few minutes. Detection limits
ranged from 50 to 500 ng m
À3
(carbofuran, epoxyconazole, and metabolites,
respectively) based on a 20 L air volume sampled.
In postapplication, on account of night–day cycles, sampling periods are longer;
generally a few hours. For this study, they were fixed at 4 h so that detection limits
ranged from 2 to 20 ng m
À3
, based on a 500 L air volume sampled.
ß 2007 by Taylor & Francis Group, LLC.
These results illustrate the effectiveness of this present method to assess atmos-
pheric pesticide concentrations. Performances could be compared to conventional
method (liquid extraction). For example, Demel et al.
65
have obtained detection
limits between 1 and 9 mgm
À3
based on 1 m
3
air volume sampled (trapping on
Tenax
1
of propiconazole, deltamethrine, etc.). These differences confirm the interest
of thermodesorption to analyze atmospheric pesticides in exposed area.
10.2.4 INDOOR AIR
To evaluate the population exposure to pesticides from indoor air, some monitoring
studies are needed. These studies used mainly the same techniques that were used for
outdoor air but adapted to confined atmosphere.
10.2.4.1 Sampling of Pesticides for Indoor Air Studies
Stout and Mason
30
for their study on the distributio n of chlorpyrifos following a
crack and crevice type application in the framework of the US EPA Indoor Air
Quality Research House program used commercially available sampling tubes.
These tubes consist of polyurethane foam open faced tube with no particle cutoff
inlet (76 3 20 mm PUF plug in glass filter housing) and of OSHA versatile sampler
or OVS tubes (SKC Inc., Eighty-Four, PA). The OVS tube consisted of a 74 3 13 mm
glass housing containing a quartz filter and two 140 and 270 mg beds of XAD-2
sandwiched between PUF partitions.
The two types of tubes were suspended at 100 cm above the floor in the living
room and sampling was done for 24 h at a flow rate of 3.8 and 1.0 L min
À1
for PUF
and OVS, respectively, by using an SKC Universal XR sample pump.
The sample inlets were directed towards the floor. Samples were collected prior
to the application and at 1, 3, 7, 14, and 21 days postapplication. Following sample
collection, the PUF and OVS tubes were capped with aluminium foil and individu-
ally sealed in plastic bags. The tubes were put in ice chests at reduced temperatures
for transport.
Bouvier et al.
31
for their comparison of the pesticide exposure of nonoccupa-
tionally exposed subjects and some occupational exposure used a MiniPartisol air
sampler 2100 (Rupprecht and Patashnik, East Greenbush, NY, USA) and a glass
cartridge containing a polyurethane foam (PUF), (SKC, Blandford Forum, UK) for
the collection of aerosols and a QM-A 1851 quartz fiber filter (Whatman, Maidstone,
UK) for the collection of particulate matters. The MiniPartisol was placed on a table
or working furniture at a height of approximately 1.60 m, in the main room of the
workplace or in the living-room of the residences. Flow rate of the pumps was
checked before and after each sampling with a mini-Buck Calibrator debitmeter
(A.P. Buck, Orlando, FL, USA). The sampling lasted for 24 h without interruption at
a flow rate of 5 L min
À1
; the mean volume sampled was 7.1 m
3
=24 h. Sampling
was performed during a working day and this sampling method was based upon the
ASTM D 4861–00 standard.
Barro et al.
32
for the analysis of pyrethroids as well as other components of
frequently used domestic insecticide preparations in indoor air used a vacuum pump
working at 100 L min
À1
(Telstar model S-8, Tarrasa, Spain). A known volume of air
ß 2007 by Taylor & Francis Group, LLC.
was pumpe d throu gh a glass tube containing 25 mg of an adsorb ent; Tenax TA of
mesh size 60 –80 (S upelco) and Flori sil (activate d overni ght at 105 8C) of 60 –100 mesh
size (Aldri ch, Steinheim , Germany) .
Teflon (PTF E) tubing was used for all connect ions. This metho d of samp ling
was previously used for polych lorobipheny ls.
32
Yoshida et al.
66
used quart z fiber filter disk (type 2500 QAT -UP, 47 mm
diam eter, ~0.64 mm thickness, Tok yo Dylec, Tok yo, Japan) and an Empore disk
(type C18 FF, 47 mm diam eter, ~0.50 mm thickness, 3 M, MN, USA) c onnected to a
smal l suction pump for 24 h at a fl ow rate of 5.0 L min
À1
resul ting in a total volum e
of air passed throu gh the adsorb ents of 7.2 m
3
.
Prior to the samp ling of airbo rne pesti cides and other semi volatil e organi c
compo unds (SVOC s), the Empore disks were subje cted to ultrasoni c cleani ng five
tim es for 10 min each by 10 mL of aceton e per disk, and the qu artz fiber fi lter d isks
wer e heated at 400 8C for 4 h.
The sampler was fixed using a tripod in the center of the target room at a h eight
of 1.2 –1.5 m from the floor.
SP ME w as a ls o u se d f or t h e a na ly si s o f p es ti cid es i n c on fined atmosphere, in
particular on greenhouses. Dichlorvos, an organophosphate pesticide, was first studied
67
followed by an extension to 10 pesticides (bioallethrin, chlorpyriphos-methyl, folpet,
malathion, procymidone, quintozene, chlorothalonil, fonofos, penconazole, and tri-
methacarb).
68
Sampling was performed by using polydimethylsiloxane–solid-phase
microextraction (PDMS–SP ME) fibers immersed in a 250 mL sampling flask
through which air samples were dynamically pumped from the analyzed atmosphere
(Figure 10.5). After a 40 min sampling duration, samples were analyzed by GC=MS.
Calibrati on was perfor med from a v apor-satur ated air samp le (Figure 1 0.6). The
line arity of the observ ed signa l versus pesticide concent ration in the vapor phase was
proved from spike d liqu id samples whos e headspa ce conce ntrations were meas ured
by the propos ed met hod (Figure 10.7).
The same all experiments, as those used for extraction of pesticides by SPME
from water samples, were performed.
10.2.4.2 Extraction of Pesticides for Indoor Air Studies
Classical methods using Soxhlet or an ultrasonic bath were used. Bouvier et al.
31
used Soxhlet extraction with 150 mL of dichloromethane Pestanal for 16 h for the
Pump
Stainless steel pipe
SPME fiber
Air sample
Glass flask
Septum
P
FIGURE 10.5 Assembly used in greenhouse for SPME samplings. (From Ferrari, F. et al.,
Anal. Bioanal. Chem., 379, 476, 2004.)
ß 2007 by Taylor & Francis Group, LLC.
extraction of pesticides from PUF plugs and quartz fiber filters. Barro et al.
32
for their
study on pyrethrenoids pesticides in indoor atmosphere used an ultrasonic bath for a
few minutes. They put traps on a 22 mL glass vial and analytes were extracted into
an appropriate volume of organic solvent (n-hexane or ethyl acetate).
Pump
Stainless steel pipes
Septum
SPME fiber
Glass flask
Air saturated by
pesticides vapor
Pure pesticides
2.5 L Flask
FIGURE 10.6 Laboratory assembly used for calibration of SPME samplings of pesticides
vapors. (From Ferrari, F. et al., Anal. Bioanal. Chem., 379, 476, 2004.)
SPME fiber
Glass vial
Stirring bar
Pesticides in solution
Pesticides in air
SPME magnifold
Thermostatic bath
Heater-stirrer
FIGURE 10.7 Assembly used for studying the linearity of HS–SPME samplings. (From
Ferrari, F. et al., Anal. Bioanal. Chem., 379, 476, 2004.)
ß 2007 by Taylor & Francis Group, LLC.
Yoshida et al.
66
used also 15 min ultrasoni c bath for the extractio n of pesticide s
from glass fiber filter s and Empore disks follow ed by shaki ng for 10 min. Fo r this, they
add 8. 0 mL of aceton e to a 10 mL centrifuge tube containing the two absorb ents.
As mentioned in the paragr aph of samp ling of pesti cides for indoor studi es, the
extra ctio n of pesticide s after samplin g is made by direc t exposur e of the fiber in the
spli t–spli tless injector of the gas chrom atograph.
10.3 ANALYSIS OF PESTICIDES IN THE ATMOSPHERE
Pe sticides are analyzed a fter extra ction by convent ional GC or high perfor mance
liqu id chrom atogr aphy (HPLC ). The detect ors used in GC a re electron captur e
detect ors (ECD) for the analys is of pesticide s containing haloge ns (organ ochlorines ,
py rethrenoid s, alachlor, etc.), nitrogen phospho rous detectors (organ ophosph ates,
tri azines, etc.), and mass detect ion in the single ion moni toring mode (S IM). For
HPL C, detect ors are diode array detect ors, fluoresc ence detect ors for carbamates
after postcolum n d erivatiza tion and MS.
10.3.1 A NALYSIS BY GAS C HROMATOGRAPHY
ECD and NPD are very sensi ble and selective detectors, but few recent studies used
these detectors. They have been used by vario us author s such a s Millet et al.,
48
Sa nusi et al.,
69
Epp le et al.,
24
Quag hebeur et al.,
27
Bouvier et al.,
31
and Kumari
et al.
52
for the an alysis of current-us ed pesticide s in air and rainw ater. The detection
and analysis by ECD was common ly used for the analys is of organoc hlori ne
pesti cides and GC –NIM S (negat ive ioni zation MS) tend to repla ce this detect or
especi ally because of the uncert ainty on the ident ifi cation with ECD .
The use of GC –MS is more develo ped since it provi des sensitiv ity, speci fic ity,
and selec tivity. Indeed, with mass spectroscop ic detection, the ident ifica tion of the
compo und can be done together with the identi ficati on of coeluted compo unds.
Columns used are generally nonpolar of semipolar columns (30 m 3 0.25 mm,
0.25 mm film thickness) and heli um is used as carrier gas. A 5% phenyl=95%
polydimethylsiloxane (type DB-5, HP-5, Optima-5, etc. dependi ng on manufactur-
ers) was used in many cases.
26,36,46,49,50,68,69
10.3.1.1 Analysis by GC–ECD and GC–NPD
Fo r the separa tion and analysis of pesti cides (see Table 10.1 for the lis t) by GC –NPD,
Epple et al.
24
used a SE- 54 column (30 m 3 0.25 mm, 0.25 mm film thickness;
J&W Scientific, Folsom, CA, USA) and helium as carrier gas. The injection (1 mL)
was made in the splitless mode and the temperature of the injector and detector was
maintained at 2508C. Because of the fluctuating sensitivity of the detector, quantifi-
cation of pesticides extracted by C
18
cartridges was carried out by the internal standard
method by using 2,3-diethyl-5-methylpyrazine and quinazoline. Detection limits
and uncertainty of all the methods (extraction and GC–NPD analysis) are presented
in Table 10.1.
Authors, because of uncertainty of the identi fication by GC–NPD, for most of
the GC–NPD analysis, a verification by GC–MS using a GC HP 5890 II Plus, a MS
ß 2007 by Taylor & Francis Group, LLC.
5989 B Engine, a column HP 5 MS (30 m 3 0.25 mm, 0.25 mm film thic kness), and
crosslink ed (Hewl ett-Packard , Palo Alto, CA, USA ) have been performed. Ident ifi-
cation was performed by compa ring the reten tion time and mass –peak relations wi th
the stand ard substance.
Millet et al.
46
and Sa nusi et al.
69
used GC –ECD for the analysis of organoc hlorine
pesticide s in atm ospheric samp les (air, fog, and rainwat er) a fter fractionat ion of
the samp les by HPLC.
Detecti on limit s obtai ned by Millet et al.
46
varie d betw een 0.01 and 0 .8 mg L
À1
correspo nding to 33 and 333 pg m
À 3
for a 24 h samplin g at 12.5 m
3
h
À 1
.
10.3.1. 2 Analysi s by GC –MS
GC –MS is employed for the analysis of pesti cides in atm ospher ic samples for its
capaci ty to deliver results with high sensi tivity and guaranty on the ident ifi cation. In
many cases, quadri pole GC –MS in the SIM is employed and quanti fication is
performed by the internal stand ard met hod by using various deuter ated compounds,
including pesticide s.
22,33,63,64,70
Ion trap was also employed in the SIM mode by Ferrari et al.
68
for the analys is o f
11 pesticide s in con fined atmospher e after atmospher ic samp ling using SPME. Ion
trap was a lso used in the MS –MS mode by Sa uret et al.
41
and Scheyer et al.
36
for air
samples and by Sc heyer et al.
49,50
for the analys is of pesti cides in rainwat er after
SPME ex traction. The use of MS –MS perm its a better sensi tivity, a higher speci ficity,
and a more imp ortant stru ctural informat ion on mol ecules in compa riso n to singl e MS
and is also better for the q uanti ficati on. To improve the speci ficity of the detect ion, in
MS –MS only the daught er ions charact eristic of the studied pesticide s were used for
quanti fi cation. The parent ion was systemat ically exclud ed from the quanti tative
analysis, since this parent ion could be obtained from severa l molecules and co nse-
quently have a low speci ficity . Indeed, the presen ce of the parent ion on the MS=MS
spectrum meant that a fraction of this ion had n ot been fragmente d by the Colli sion
Induced Dissocia tion (CID ) phenom enon, necess ary to produce daughte r ions.
10.3.2 DERIVATIZATION
Some pesticide s cannot be analyz ed direc tly by GC. This is the case for some
phenoxy acids (2,4 D, MCP A, and MCPP) or ureas herbi cides (chlo rotoluron,
diuron, and isoprotur on). Prior to their analysis b y GC, a deriv atizatio n step is
required. Scheyer et al.
36
have used penta fl uoroben zyl brom ide (PFB Br) for the
derivatization of seven herbicides before their analysis by GC–MS–MS.
Phenyl ureas (PUHs), phenoxy acids, and bromoxynil show very different
physical–chemical properties and molecular structures. It was necessary to find a
derivatization agent which can react simultaneously and easily with all the pesticides
studied. An alkylation reaction with pentafluorobenzyl bromide (PFBBr) seems to be
a good compromise. The mechanism implies a nucleophilic substitution with a
bimolecul ar mecha nism, without formati on of carbocat ions (Figur e 10.8).
The mechanism for the reaction of PFBBr with a molecule that has an acidic
hydrogen atom is a bimolecular nucleophilic substitution SN
2
. The functional groups
ß 2007 by Taylor & Francis Group, LLC.