Applications of Environmental Aquatic Chemistry: A Practical Guide - Chapter 7 ppt
Bạn đang xem bản rút gọn của tài liệu. Xem và tải ngay bản đầy đủ của tài liệu tại đây (317.3 KB, 22 trang )
7
Behavior of Dense
Nonaqueous Phase
Liquids in the Subsurface
7.1 DNAPL PROPERTIES
Dense nona queous phase liquids (DNAP Ls) are liquids that are only sligh tly solub le
in wate r and there fore exist in the subsur face as a separate fluid ph ase immis cible
with both wat er and air.* The densi ty of DNA PLs is greater than water (DNA PL
density > 1g=cm
3
at 48 C) and their mobili ty in the subsur face is governe d more by
gravity and the proper ties of the DN APL and surro unding soil than it is by g round-
water movement .
Unlike ligh t nonaqueo us phase liquids (LNAPL s) such as gasol ine, diese l fuel,
and h eating oil (which are less dense than water), DNAPLs relea sed into soil s can
sink b elow the water table where thei r more -sol uble co mponents can slowly diss olve
into flowi ng groundwat er, giving rise to diss olved contam inant plum es. A relea se o f
DNAP L at the ground surface can therefore lead to long-term contamina tion of both
the vadose and saturated zones a t a site.
DNA PLs such as wood preser vatives like creoso te, transform er, and insulating
oils contain ing polych lorinated biphen yls (PC Bs), coal tar, and a varie ty of chlor in-
ated solve nts such as trichlor oethene (TCE) and tetrachlo roeth ene (PC E) have been
widely used in industry since the beginn ing of the twentieth c entury. However , their
importan ce as soil a nd groundw ater contam inants was not recogniz ed unti l the
1980s, mainly beca use of the limit ations of early analytical met hods. As a resul t,
chemical material safety data sheet s (MSD S) distributed as late as early 1970
sometim es recom mended that waste chlor inated solve nts be disca rded by spread ing
them onto dry ground and allowing them to evapora te. These early MSD Ss acknow -
ledged the volat ile nature of many DNA PL chemicals , but d id not recogni ze their
ability to in filtrate rapidly into the subsur face, causing soil and groundw ater pollu-
tion. It is not surpr ising that DNA PLs are the contamina nts of greatest concern at
many Su perfund and other hazardous waste sites.
Table 7.1 lists many of the DNA PLs commonl y found at Superfu nd sites, along
with their chemi cal form ulas, some alternative names, and common abbreviations.
* See Chapter 6 to review the properties of nonaqueous phase liquids (NAPLs) in general and light
nonaqueous phase liquids (LNAPLs).
ß 2007 by Taylor & Francis Group, LLC.
TABLE 7.1
DNAPL Contaminants of Concern at Many Hazardous Waste Sites
Chemical Abstracts Service
(CAS) Name Abbreviation CAS Number Other Names
Molecular
Formula
Structural
Formula
Chloromethane Artic; R40 74-87-3 Methyl chloride;
monochloromethane
CH
3
Cl CH
3
Cl
Dichloromethane Methylene
chloride; MC
75-09-2 Methylene dichloride CH
2
Cl
2
CH
2
Cl
2
Trichloromethane CF 67-66-3 Chloroform; methane
trichloride
CHCl
3
CHCl
3
Tetrachloromethane CT 56-23-5 Carbon tetrachloride CCl
4
CCl
4
Chloroethane CA 75-00-3 Ethyl chloride C
2
H
5
Cl Cl
3
CÀÀCH
3
1,1-Dichloroethane 1,1-DCA 75-34-3 Ethylidene dichloride C
2
H
4
Cl
2
Cl
3
CÀÀCH
3
1,2-Dichloroethane 1,2-DCA,
EDC
107-06-02 Ethylene dichloride C
2
H
4
Cl
2
Cl
3
CÀÀCH
3
1,1,1-Trichloroethane 1,1,1-TCA 71-55-6 Methyl chloroform,
chlorothene,
methyltrichloromethane
C
2
H
3
Cl
3
Cl
3
CÀÀCH
3
1,1,2-Trichloroethane 1,1,2-TCA 79-00-5 Vinyl trichloride
b-trichloroethane
C
2
H
3
Cl
3
Cl
2
HCÀÀCH
3
Chloroethene VC 75-01-4 Vinyl chloride;
chloroethylene
C
2
H
3
Cl ClHC¼¼CH
2
1,1-Dichloroethene 1,1-DCE 75-35-4 1,1-Dichloroethylene;
vinylidine chloride
C
2
H
2
Cl
2
Cl
2
C¼¼CH
2
ß 2007 by Taylor & Francis Group, LLC.
(E)-1,2-Dichloroethene trans -1,2-DCE 156-60-5 trans-1,2-Dichloroethene;
trans-1,2-dichloroethylene;
acetylene dichloride
C
2
H
2
Cl
2
t-ClHC¼¼CHCl
(Z)-1,2-Dichloroethene cis -1,2-DCE 156-59-2 cis-1,2-Dichloroethene;
cis-1,2-dichloroethylene;
acetylene dichloride
C
2
H
2
Cl
2
c -ClHC ¼¼ CHCl
Trichloroethene TCE 79-01-6 Trichloroethylene C
2
HCl
3
Cl
2
C¼¼CHCl
Tetrachloroethene PCE 127-18-4 Perchloroethylene;
tetrachloroethylene
C
2
Cl
4
Cl
2
C¼¼CCl
2
Chlorobenzene CB 108-90-7 Monochlorobenzene, benzene
chloride, phenyl chloride
C
6
H
5
Cl C
6
H
5
Cl
1,2-Dichlorobenzene 1,2-DCB 95-50-1 o-Dichlorobenzene C
6
H
4
Cl
2
C
6
H
4
Cl
2
1,3-Dichlorobenzene 1,3-DCB 541-73-1 m-Dichlorobenzene C
6
H
4
Cl
2
C
6
H
4
Cl
2
1,4-Dichlorobenzene 1,4-DCB 106-46-7 p-Dichlorobenzene C
6
H
4
Cl
2
C
6
H
4
Cl
2
1,2,3-Trichlorobenzene 1,2,3-TCB 87-61-6 vic-Trichlorobenzene C
6
H
3
Cl
3
C
6
H
3
Cl
3
1,2,4-Trichlorobenzene 1,2,4-TCB 120-82-1 Trichlorobenzol C
6
H
3
Cl
3
C
6
H
3
Cl
3
1,3,5-Trichlorobenzene 1,3,5-TCB 108-70-3 sym-Trichlorobenzene C
6
H
3
Cl
3
C
6
H
3
Cl
3
1,2,3,5-Tetrachlorobenzene 1,2,3,5-TECB 634-90-2 1,2,3,5-TCB C
6
H
2
Cl
4
C
6
H
2
Cl
4
1,2,4,5-Tetrachlorobenzene 1,2,4,5-TECB 95-94-3 s-Tetrachlorobenzene,
sym-tetrachlorobenzene
C
6
H
2
Cl
4
C
6
H
2
Cl
4
Hexachlorobenzene HCB 118-74-1 Perchlorobenzene C
6
Cl
6
C
6
Cl
6
1,2-Dibromoethane EDB 106-93-4 Ethylene dibromide;
dibromoethane
C
2
H
4
Br
2
C
2
H
4
Br
2
Polychlorinated biphenyls PCBs — Aroclor; Phenoclor; Pyralene;
Clophen; Kaneclor
— See Section 7.4
ß 2007 by Taylor & Francis Group, LLC.
Pro perties of DN APL liqu ids and surro unding soils that are useful for predic ting
DN APL mobility are describe d in Tab le 7.2. So me imp ortant DNA PL compo unds
and thei r proper ties found at these sites are inclu ded in Table 7.3.
7.2 DNAPL FREE PRODUCT MOBILITY
In a DNAPL release, the free product sinks vertically downward through the vadose
zone under gravitational forces, spreading laterally under capillary forces and leaving
behind a trail of residual soil-sorbed DNAPL. In the vadose zone, DNAPL behaves
similarly to LNAPL, moving downward while spreading laterally and leaving a trail of
soil-sorbed and immobile liquid NAPL in the form of disconnected blobs and ganglia of
free product that remain behind the trailing end of the downward-moving DNAPL body.
7.2.1 DNAPL IN THE VADOSE Z ONE
Lik e LNAP L, DNA PL in the vadose zone will partition into soli d, liqu id, and vapor
phases so that different portions are present as free product, pore space vapor,
diss olved in wat er, and sorbed to soil (see Figure 6.3 ). Bec ause of con tinual losses
to other phases, the downward-moving free product is continuall y diminished in
mass and volume. It also undergoes changes in composition as the more volatile and
soluble components preferentially leave the free product mix ture. A point may be
reached at which the remaining DNAPL free product no longer holds together as a
continuous phase, but rather is present as immobile isolated globules and ganglia,
held in place by capillary forces. Only DNAPL present as a continuous, immiscible,
liquid phase is mobile. If sufficient DNAPL was originally present, liquid free
product will eventually reach the water table interface between the vadose and
saturated zones.
The fraction of liquid hydrocarbon that is retained by sorption and capillary
forces in the pores of soils is referred to as residual saturation and is relatively
immobile.* Percent residual saturation (%RS) is defined by Equation 7.1.
%RS ¼ 100 Â
volume of NAPL trapped in subsurface pore spaces
total volume of pore spaces
(7:1)
The amount of residual DNAPL retained in a typical soil such as silt, sand, or gravel
is generally between 5% and 20% of the soil pore space.
In the vadose zone, only DNAPL in the vapor, dissolved, and liquid free product
phases has significant mobility; DNAPL sorbed to soil surfaces or trapped in pores
is immobile unless it partitions again into one of the three mobile phases. DNAPL in
the vapor phase is generally denser than air and tends to sink. However, it spreads
laterally wherever the subsurface is least permeable, often moving far beyond the
region of resi dual saturation, where the vapors can contaminate soils and ground-
water distant from the region of the spill.
* A common operational definition of NAPL mobility is that mobile NAPL can drain under gravity into a
monitoring well, while immobile NAPL (residual saturation) cannot.
ß 2007 by Taylor & Francis Group, LLC.
TABLE 7.2
DNAPL Properties Important for Predicting Mobility in Environment
Properties of DNAPL=Soil De finition=Typical Units Comments
Density (d ) d ¼ mass=volume
d ¼ gÁcm
À3
;lbÁft
À3
Density distinguishes between LNAPLs (d
DNAPL
< d
water
) and DNAPLs (d
DNAPL
< d
water
).
It depends on temperature, pressure, molecular weights of components, intermolecular forces,
and bulk liquid structure.
Dynamic viscosity ( m) m ¼fluid internal resistance to flow or
shear. The CGS unit is poise (P); SI
unit is NÁsÁm
À2
.
1P¼ 100 centipoise
¼ 1g=cmÁs ¼ 0.1 PaÁs
Dynamic viscosity is a measure of the force required to move a liquid at a constant velocity.
The common unit of m is the centipoise (cP) because water at 20.28 C has a convenient
viscosity of 1.000 cP. Viscosity decreases with increasing temperature (note water in
Table 7.2). Intermolecular attractions are the main cause of viscosity. The lower the viscosity,
the more fluid the liquid and the more easily it will flow through soils. The reciprocal of
dynamic viscosity is called fluidity.
Kinematic viscosity ( n) n ¼ dynamic viscosity=density
The CGS unit is stokes (St) or
centistokes (cSt); SI units are
m
2
Ás
À1
; stokes ¼ poises=density
1St¼ 100 cSt ¼ 10
À4
m
2
Ás
À1
When the force causing a liquid to move is only due to gravity, as in NAPL movement in the
environment, the fluid density, as well as the dynamic viscosity, affects the rate of movement.
Using kinematic viscosity includes density in its defi nition and eliminates the force term
(N or Pa). Kinematic viscosity is convenient for calculating hydraulic conductivity, which is
inversely proportional to n . Since the density of water at 20.28C is 0.998 g=cm
3
, the kinematic
viscosity of water at 20.28 C is, for most practical purposes, equal to 1.0 cSt.
Solubility in water (S) S ¼ mass of dissolved substance per
unit volume of water, in equilibrium
with the undissolved substance. For
environmental pollutants in water,
the common units are mg=Lor
m g=L.
Solubility measures a compound’s tendency to partition from the bulk compound into water.
For a single-component NAPL, the solubility is the concentration of dissolved component in
equilibrium with the NAPL. For NAPLs that are mixtures, each component of the mixture has
its own characteristic solubility, which is generally lower than the solubility of the pure
component (see Section 6.3.8). Thus, the overall solubility of an NAPL mixture is variable,
depending on its composition, and changes with time as the more-soluble components leave
the NAPL by partitioning into the water. Solubility can vary with temperature, pH, TDS, and
the presence of cosolvents (e.g., detergents, EDTA, etc.). In general, the greater the molecular
weight (high polarizability) and symmetry (low polarity) and the fewer hydrogen-bonding
atoms, the lower the solubility, see Section 2.9.
(Continued)
ß 2007 by Taylor & Francis Group, LLC.
TABLE 7.2 (Continued )
DNAPL Properties Important for Predicting Mobility in Environmen t
Properties of DNAPL=Soil Definition=Typical Units Comments
Vapor pressure (P
v
) P
v
¼ pressure exerted by a vapor in
equilibrium with the liquid or solid
phase of the same substance. There
are many different units for pressure.
The more common units are
millimeters of mercury (mm Hg),
torr, and atmosphere (atm). The SI
unit is pascal (Pa).
1mmHg¼ 1 torr ¼ 760
À1
atm
¼ 1.333 mbar ¼ 133.3 Pa
¼ 1.934310
À2
psi 1 Pa
¼ 1N=m
2
¼ 10
À5
bar
¼ 7.50310
À3
torr
¼ 1.450310
À4
psi
Vapor pressure indicates an NAPL’s volatility, or tendency to vaporize, at a given temperature.
It depends only on the temperature and increases exponentially with increasing temperature.
On a molecular level, vapor pressure is an indication of the strength of intermolecular
attractive forces, see Section 2.8.6. The vapor pressure of DNAPLs ranges from very high to
very low; for example, compare 1,1-dichloroethylene and chrysene in Table 7.2.
Henry’s law volatility The Henry’s law volatility of a
compound is a measure of the
transfer of the compound from being
dissolved in the aqueous phase to
being a vapor in the gaseous phase.
The transfer process from water to the gaseous phase in the atmosphere is dependent on the
chemical and physical properties of the compound, the presence of other compounds, and the
physical properties (velocity, turbulence, depth) of the water body and atmosphere above it.
The factors that control volatilization are the solubility, molecular weight, vapor pressure, and
the nature of the air–water interface through which it must pass. The Henry’s constant is a
valuable parameter that can be used to help evaluate the propensity of an organic compound to
volatilize from the water. The Henry’s law constant is defined as the vapor pressure divided by
the aqueous solubility. Therefore, the greater the Henry’s law constant, the greater the
tendency to volatilize from the aqueous phase, refer to Table 7.1.
ß 2007 by Taylor & Francis Group, LLC.
TABLE 7.3
Values for Important Properties of DNAPL Contaminants Commonly Found at U.S. Superfund Sites
Chemical Compound
Density
(g=cm
3
)
Water Solubility
(mg=L)
Vapor Pressure
(torr)
Henry’s Law
Constant (atm m
3
=mol)
Dynamic Viscosity
a
(centipoise)
Kinematic Viscosity
a
(centistokes)
Water 0.9991 (158C) — 12.8 (158C) — 1.145 (158C) 1.146 (158C)
(for comparison) 0.9982 (208C) 17.5 (208C) 1.009 (208C) 1.011 (208C)
Halogenated semivolatiles
Aroclor
b
1242 1.3850 0.45 4.06 3 10
À4
3.4 3 10
À4
Aroclor
b
1254 1.5380 0.012 7.71 3 10
À5
2.8 3 10
À4
Aroclor
b
1260 1.4400 0.0027 4.05 3 10
À5
3.4 3 10
À4
Chlordane 1.6 0.056 1 3 10
À5
2.2 3 10
À4
1.104 0.69
1,4-Dichlorobenzene 1.2475 80 0.6 1.58 3 10
À3
1.258 1.008
1,2-Dichlorobenzene 1.3060 100 0.96 1.88 3 10
À3
1.302 0.997
Dieldrin 1.7500 0.186 1.78 3 10
À7
9.7 3 10
À6
Pentachlorophenol 1.9780 14 1.1 3 10
À4
2.8 3 10
À6
2,3,4,6-Tetrachlorophenol 1.8390 1,000
Halogenated volatiles
Carbon tetrachloride 1.5947 790 91.3 0.020 0.965 0.605
Chlorobenzene 1.1060 490 8.8 3.46 3 10
À3
0.756 0.683
Chloroform (trichloromethane) 1.4850 7,920 160 3.75 3 10
À3
0.563 0.379
1,1-Dichloroethane 1.1750 5,500 182 5.45 3 10
À4
0.377 0.321
1,2-Dichloroethane 1.2530 8,690 63.7 1.1 3 10
À3
0.840 0.67
cis-1,2-Dichloroethylene 1.2480 3,500 200 7.5 3 10
À3
0.467 0.364
(Continued)
ß 2007 by Taylor & Francis Group, LLC.
TABLE 7.3 (Continued)
Values for Important Properties of DNAPL Contaminants Commonly Found at U.S. Superfund Sites
Chemical Compound
Density
(g=cm
3
)
Water Solubility
(mg=L)
Vapor Pressure
(torr)
Henry’s Law
Constant (atm m
3
=mol)
Dynamic Viscosity
a
(centipoise)
Kinematic Viscosity
a
(centistokes)
trans-1,2-Dichloroethylene 1.2570 6,300 265 5.32 3 10
À3
0.404 0.321
1,1-Dichloroethylene 1.2140 400 500 1.49 3 10
À3
0.330 0.27
1,2-Dichloropropane 1.1580 2,700 39.5 3.6 3 10
À3
0.840 0.72
Ethylene dibromide 2.1720 3,400 11 3.18 3 10
À4
1.676 0.79
Methylene chloride 1.3250 13,200 350 2.57310
À3
0.430 0.324
1,1,2,2-Tetrachloroethane 1.6 2,900 4.9 5. 0 3 10
À4
1.770 1.10
1,1,2-Trichloroethane 1.4436 4,500 0.188 1.17 3 10
À3
0.119 0.824
1,1,1-Trichloroethane 1.3250 950 100 4.08 3 10
À3
0.858 0.647
Tetrachloroethylene (PCE) 1.620 200 14 0.0227 0.890 0.54
Trichloroethylene (TCE) 1.460 1,100 58.7 8.92 3 10
À3
0.570 0.390
Trichloromethane (chloroform) 1.4850 7,920 160 3.75 3 10
À3
0.563 0.379
Nonhalogenated semivolatiles
2-Methyl naphthalene 1.0058 25.4 0.0680 0.0506
o-Cresol 1.0273 31,000 2.45310
À1
4.7 3 10
À5
p-Cresol 1.0347 24,000 1.08310
À1
3.5 3 10
À4
2,4-Dimethylphenol 1.0360 6,200 0.098 2.5 3 10
À6
m-Cresol 1.0380 23,500 1.53310
À1
3.8 3 10
À5
21.0 20
Phenol 1.0576 84,000 5.293 3 10
À1
7.8 3 10
À7
3.87
Naphthalene 1.1620 31 2.336 3 10
À1
1.27 3 10
À3
ß 2007 by Taylor & Francis Group, LLC.
Benzo(a)Anthracene 1.1740 0.014 1.16 3 10
À9
4.5 3 10
À6
Fluorene 1.2030 1.9 6.67 3 10
À4
7.65 3 10
À5
Acenaphthene 1.2250 3.88 0.0231 1.2 3 10
À3
Anthracene 1.2500 0.075 1.08 3 10
À5
3.38 3 10
À5
Dibenzo(a,h)anthracene 1.2520 2.5 3 10
À3
1 3 10
À10
7.33 3 10
À8
Fluoranthene 1.252 0.27 7.2 3 10
À5
11 3 10
À6
Pyrene 1.2710 0.148 6.67 3 10
À6
1.2 3 10
À5
Chrysene 1.2740 6.0 3 10
À3
6.3 3 10
À9
1.05 3 10
À6
2,4-Dinitrophenol 1.6800 6.0 3 10
À3
1.49 3 10
À5
6.45 3 10
À10
Miscellaneous
Coal tar (458 F) 1.028 18.98
Creosote 1.05 ~1.08 (158 C)
Source: Adapted from USEPA, Dense Nonaqueous Liquids, S.G. Huling and J.W. Weaver, Ground Water Issue, Office of Research and Development, Office of Solid Waste
and Emergency Response, Washington, DC, EPA=540=4-91-002, March 1991.
a
Dynamic viscosity measures a liquid ’s resistance to flow. Kinematic viscosity is the ratio of dynamic viscosity to density, see Table 7.2.
b
Aroclor is the trade name for polychlorinated biphenyls (PCBs) manufactured by Monsanto. See Section 7.3.4.
ß 2007 by Taylor & Francis Group, LLC.
Because the v apor pressu re of many DNA PL compo unds is relativel y high, the
lif espan of residual DNAPL in the unsat urated zone, where vaporizati on oc curs, can
be much less than the lifespan of residual DNA PL below the water tabl e, wher e
vap orization cannot occur. The vapori zation proces s can deplet e resi dual DNA PLs
hav ing high vapor press ures, such as the solve nts TCE and PCE, wi thin 5–10 years
in relat ively war m and dry c limates. This will not elimin ate the presence of vapor
ph ase, adsorbed phase, and aqueous phase contam ination in the unsat urate d zone,
bu t it can lead to an absence of the DNA PL phase. The absence of DN APL in the
un saturated zone at a site does not necess arily imp ly that no DNA PL was ever
relea sed at that sit e in the pa st, or that past releases of DNA PL have failed to reach
the water table.
Water percolati ng down ward throu gh the vadose zone wi ll prefer entially leach
the more -soluble compo nents of DNAP L from the free product and resi dual satur-
atio n that it contac ts; eventu ally c arrying diss olved DN APL to the satur ated zone,
con taminating groundw ater there . Partitio ning of residua l satur ation into the d is-
solve d phase is facilitated further by the rise and fall of the wat er tabl e.
7.2.2 DNAPL AT THE W ATER TABLE
At the water table inte rface, DNAP L behaves very diff erently from LNAPL . Being
den ser than wat er, it does not float a bove the water tabl e but tends to conti nue
do wnward throu gh the capil lary zone of the water tabl e into the satur ated zone,
wher e partitio ning into the diss olved phase is maximi zed. To continue movi ng
downward in the saturated zone, DNA PL must displace water held in the soil pore
spaces by capillary forces. Consequently, at the water table interface, downward
movement slows while DNAPL piles up and spreads laterally. If sufficient weight of
DNAPL accumulates, it presses down ward through the capillary zone and continues
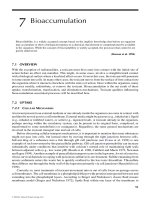
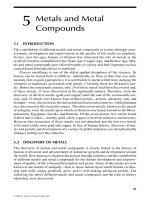
do wn through the saturated zone, see Figure 7.1. Bec ause soil surfa ces in the
saturated zone are already wetted by water, DNAPL movement below the water
table does not leave a trail of soil-sorbed DNAPL, although some DNAPL can
become trapped as residual saturation where water is not readily displaced.
7.2.3 DNAPL IN THE SATURATED ZONE
In the saturated zone, DNAPL can exist only in three phases: the continuous liquid
free product, dissolved, and residual saturati on phases. The vapor phase is absent. In
the saturated zone, residual saturation DNAPL is in continual contact with water and,
therefore, continually partitions its more-soluble components into the dissolved
phase. Thus, the properties of the DNAPL change progressively, gene rally toward
greater density and higher viscosity. In most soils, hydraulic gradients large enough
to mobilize horizontal movements of residual DNAPL are unrealistic. Therefore,
investigation and remediation activities involving intensive well pumping are not
likely to draw residual DNAPL into wells.
If the initial release was large enough, DNAPL will continue downward through
the saturated zone to the bottom of the aquifer. Only an impermeable obstruction,
such as bedrock, or complete depletion of mobile free product by sorption and
capillary retention within the soil, stops the downward movement of DNAPL mobile
ß 2007 by Taylor & Francis Group, LLC.
free product. A decrease in soil permeability, such as a clay layer,* whether in the
unsaturated or saturated zone, affects DNAPL travel by slowing the downward
movement and causing lateral spreading until soils that are more perm eable are
encountered. The lateral spreading is generally in the downward slope direction of
the stratigraphic unit, but is influenced also by pool formation in depressions and
penetration into cracks and fissures. This leads to the form ation of DNAPL pools and
fingerlike ganglia. Eventually, if sufficient DNAPL is present to move past the
impermeable layers, bedrock is reached where DNAPL collects in pools and frac-
tures. If the bedrock is slanted, DNAPL may migrate down the physical slope, even
if the direction is opposite to the groundwater movement. Residual and pooled
DNAPL together form what is called the DNAPL source zone. It is within the source
zone that dissolution into groundwater occurs and aqueous phase plumes originate.
DNAPL solubilities are generally low, so DNAPL in the saturated zone will
continue to dissolve slowly into the groundwater without significant diminution over
many years. At typically slow groundwater velocities, even a small DNAPL release
can persist for decades or longer under natural conditions before all the DNAPL has
dissolved or degraded. Once in the subsurface, it is difficult or impossible to recover
Leaking LNAPL tank
Low permeability layers
Ground surface
Unsaturated zone
Saturated zone
Bedrock
Water table
Groundwater flow
Leaking DNAPL tank
DNAPL pooled in
bedrock depression
LNAPL free product
DNAPL free product
Flow into bedrock
fractures
FIGURE 7.1 Comparison of dense nonaqueous phase liquids (DNAPLs) and light nonaqu-
eous phase liquids (LNAPLs) movement in the subsurface after a spill. When mobile NAPL
encounters stratigraphic units of low permeability, such as a clay lens or bedrock, it spreads
out until it can enter a preferential pathway of greater permeability that allows it to continue
downward. DNAPL entering fractured rock systems may follow a complex pattern of prefer-
ential pathways.
* Also called a clay lens or low permeability lens.
ß 2007 by Taylor & Francis Group, LLC.
all of the trapp ed residual DNAP L. DNAP L that remains trapped in the soil=aq uifer
mat rix acts a s a continuin g source of groundw ater contamina tion .
DNAPLs with low v iscosity (e.g., met hylene chlor ide, perchloroet hylene ,
1,1 ,1-TCA, TCE) ca n in filtrate into soil faster than wat er. The relative values of
DN APL viscosit y and density, with respec t to water, indicate how fast it will flow
do wngradien t throu gh the satur ated zone compa red to wat er. For examp le, severa l
low -viscosity chlor inated DNAP Ls (refer to Table 7.3) will flow 1.5 –3.0 times
faster than water, whereas higher viscosity compounds, including ligh t heating oil,
diesel fuel, jet fuel, and crude oil (i.e., LNAPLs) will flow 2–10 times slower than
water. Both coal tar and creosote typically have a density greater than one and a
viscosity greater than water. Note that the viscosity of NAPL changes with time as
different components partition to other phases. As a fresh NAPL loses the lighter
volatile components by evaporation, the NAPL becomes more viscous because the
remaining heavier, more viscous components comprise a larger fraction of the
NAPL mixture.
RULES OF THUMB FOR DNAPL
1. DNAPL movement is affected by gravity far more than groundwater
movement. It moves with the slope of the bedrock below the aquifer,
independently of the direction of groundwater movement, and forms
pools in bedrock depressions.
2. Chlorinated hydrocarbons are generally denser than water (DNAPL).
They sink to the bottom of the water table.
3. In Table 7.3, many chlorinated hydrocarbons, including TCE, tetra-
chloroethylene, 1,1,1-TCA, methylene chloride, chloroform, and ca r-
bon tetrachloride, have viscosities less than water. They flow through
the saturated zone 1.5–3.0 times faster than water and can penetrate
small fractures and micropores, becoming inaccessible to in situ
remediation.
4. The percent residual DNAPL retained as immobile liquid in a typical
soil such as silt, sand, or gravel is generally between 5% and 20% of
the soil pore space.
5. DNAPLs with high vapor pressure can totally evaporate from the
DNAPL phase in the vadose zone in a relatively short time. There-
fore, the absence of DNAPL in the unsaturated zone at a site does not
necessarily imply that no DNA PL was ever released at that site in the
past, or that past releases of DNAPL have failed to reach the water
table. Vapor phase, sorbed phase, and dissolved phase contamination
may still be present.
6. In most saturated zone soils, intensive well pumping cannot create a
large enough hydraulic gradient to move residual DNAPL into the
well.
ß 2007 by Taylor & Francis Group, LLC.
7.3 TESTING FOR THE PRESENCE OF DNAPL
It is very difficult to locat e DNA PL free product wi th moni toring wells. First,
DNAP L rema ins at the bott om of the moni toring well and may go un noticed.
Second, DNA PL free product may be presen t in locations seem ingly unrel ated to
the spill location, such as perched on low perm eability layer s in pools a nd cracks , or
upgradi ent of the spil l at the bott om of the aquifer in pools and fract ures in the
bedrock . The re often are no obvious guidelines as to where a well shoul d be placed
or how it should be screen ed to colle ct free product .
In addition, there are risks of enlar ging the contamina ted volume when tryin g to
locate and deter mine the extent of a DNAPL source z one. Unlike resi dual DNA PL,
pooled DNA PL is relatively easy to mobi lize by incre asing the hydraul ic gradi ent.
An explor atory wel l can inadve rtently be drilled throu gh DNA PL perched on a clay
lens or pooled on bedrock , resul ting in vertica l mobili zation into previ ously uncon-
taminat ed regions. It often is prudent to use a ‘‘from outside toward inside ’’ approac h
to delineati ng DNA PL sites, in order to minimize the chances of direc tly encount er-
ing pooled DNAP L during site charact erization .
For these reason s, diss olved conc entration s of DNAP L-related chemicals in
groundwat er wells distant from the source zone are o ften the only eviden ce that
DNAP L free product is presen t at a sit e. The EPA has recom mende d an empirica l
approac h for d etermining whether DNA PL free product is near a moni toring wel l
where diss olved DNAPL-related compo unds have been detected (USEPA, 1992). In
order to use this approach, one must
1. Measure the concentrations of DNAPL-related compounds dissolved in
groundwater.
2. Know the compo sition of the suspec ted DNA PL. Se e Exa mple 3 for a
useful procedu re when the composit ion of the DNA PL is not known.
3. Calcul ate the e ffective solub ility ( S
eff
) of the meas ured DNA PL co m-
ponents.
4. Apply the guidel ines of Section 7.3.1.
The effective solubility is the theoretical solubility in water of a single compon-
ent of a DNAPL mixture. It may be approximated by multiplying the component’s
mole fraction* in the mixture by the solubility of its pure phase.
S
eff
(a) ¼ X
a
S
pure
(a)(7:2)
* The mole fraction of compound a in a mixture of several compounds is written X
a
.
X
a
¼
moles of a
total moles of all compounds in mixture
For a mixture containing 1 mole of CCl
4
and 3 moles of CHCl
3
, X
CCl
4
¼ 1=4 ¼ 0.25 and X
CHCl
3
¼
3=4 ¼ 0.75. Note that the sum of all mole fractions must equal unity. The mole fraction of any pure
substance equals unity.
ß 2007 by Taylor & Francis Group, LLC.
wher e
S
eff
( a) ¼ effective solubility, in mg=L, of compo nent a in a DN APL mix ture
X
a
¼ mol e fract ion of compo und a in the mix ture
S
pure
( a) ¼ p ure-phase solub ility of compo und a,inmg=L
7.3.1 C ONTAMINANT C ONCENTRATIONS IN GROUNDWATER AND S OIL T HAT
I NDICATE THE PROXIMITY OF DNAPL
If any of the follow ing condition s exist in groundwat er, there is a high probabi lity
that DNAPL free product is near the samplin g location.
.
Gro undw ater concent rations of DNAP L-related chemicals are > 1% of
eith er thei r pure-p hase solub ility ( S
pure
) for a single compo nent DNAP L
or the effective solub iliti es ( S
eff
) for compo nents of a DNAPL mix ture. The
facto r of 1% of the solub ility is intended to roughl y account for the
ex pected concent ration decrease due to dilution , dispe rsion, and degrad-
atio n of the DNA PL compo nent while movi ng from the source z one to a
moni toring wel l that is ‘‘ near ’’ the source . The higher the percentag e factor,
the close r the well is likely to be to the source zone.
.
So il concent rations of DNAP L-related chemicals a re > 10,000 mg=kg
(1% of soil mass).
.
Gro undw ater concent rations of DNAPL- related ch emicals incre ase with
de pth or appear in anoma lous upgradi ent=cross -gradient locations with
respec t to groundw ater flow.
.
Gro undw ater con centratio ns of DNA PL-related chemicals calcul ated from
wat er –soil partiti oning relations hips are great er than their pure-phase solu-
bili ty or effective solubility.
7.3.2 C ALCULATION METHOD FOR ASSESSING R ESIDUAL DNAPL IN SOIL
1. Measu re the DNA PL compo unds in the soil.
2. Cal culate S
eff
( a) from Equati on 7.2 for each compo und.
3. Find K
oc
, the organic carbon –wat er parti tion coef ficient in Table 5.5, or from
pu blished literature. Ot herwise estimate it from log K
oc
¼ log K
ow
À 0.21.
4. Det ermine f
oc
, the fraction of organic carbon (oc) in the soil by lab analys is.
Val ues for f
oc
typicall y range from 0.03 to 0.0 0017 (mg oc)=(mg
soil ). Convert va lues reported in percent (mg oc=100 mg soil) to (mg oc)=
(mg soil).
5. Det ermine or estimate the dry bulk density of the soil ( d
b
). Typical values
range from 1.8 to 2.1 g=cm
3
(kg=L).
6. Det ermine or esti mate the wat er-filled porosity ( p
w
) of the soil.
7. Determine K
d
, the soil–water partition coefficient, from K
d
¼ K
oc
3 f
oc
,
Equ ation 4.16.
8. If the soil sample is collected from a source zone, DNAPL free product is
present in the soil and the concentrations of DNAPL compounds dissolved in
the pore water will be close to their calculated effective solubilities, S
eff
.
ß 2007 by Taylor & Francis Group, LLC.
Therefore, calculate from Equation 7.3 the minimum DNAPL concentration in
soil, C
mi n
so il
(a), that would result in a pore water concentration equal to S
eff
.
9: C
min
soil
( a) ¼
S
eff
( a) Â K
d
d
b
þ p
w
ðÞ
d
b
( 7:3)
10. If meas ured soil concent rations of compo und a > C
min
soil
( a), DNA PL free
product was presen t in the soil sample.
11. If meas ured soil concent rations of compo und a < C
min
soil
( a), DNA PL free
product was not presen t in the soil samp le.
EXAMPLE 1
USING G ROUNDWAT ER CONCENTR ATIONS TO ESTIMATE THE PROXIMITY OF RESIDUAL
SINGLE -C OMPONENT DNAPL
Analysis of a water sample from a monitoring well indicated 6.4 mg=L of tetrachloro-
ethene (PERC). Tetrachloroethene was a target contaminant because a dry cleaning
establishment had once been on the site near the well. Is residual tetrachloroethene
DNAPL likely to be in the subsurface upgradient near the well? Use data from Table 7.3.
Answer :
Since the observed DNAPL is a pure solvent (tetrachloroethene) and not a mixture, its
mole fraction, X , equals unity and S
eff
¼ S
pure
. From Table 7.3, the solubility of pure
tetrachloroethene is 200 mg=L. By the guideline in Section 7.3.1, if the measured
concentration of a single-component DNAPL in a well is 1% or more of its pure-
phase solubility, it is likely that a DNAPL source zone is near the well.
One percent of 200 mg=L is 2.0 mg=L. The measured concentration of tetrachloroethene
in the well is 6.4 mg=L. Because this is signifi cantly larger than 2.0 mg=L, it is likely
that a source zone of tetrachloroethene DNAPL is quite close to the well.
EXAMPLE 2
USING G ROUNDWAT ER CONCENTR ATIONS TO ESTIMATE THE PROXIMITY OF RESIDUAL
M ULTICOMPONE NT DN APL M IXTURES ,WHERE THE I NITIAL COMPOS ITION I S KNOWN
A remediation project was being planned for a site that had contained a metal degreasing
facility. The degreaser solution that was used consisted of 70 wt% trichloromethane, 15
wt% trichloroethylene, and 15 wt% tetrachloroethylene. A matrix of monitoring wells
was drilled to try to locate subsurface source zones of DNAPL releases. A water sample
from well SW-4 contained 88 mg=L trichloromethane (MW ¼ 119.37), 1.6 mg=L tetra-
chloroethylene (MW ¼ 165.82), and 4.2 mg=L trichloroethylene (MW ¼ 131.37). Is this
well likely to be close to an upgradient DNAPL source zone? Use data from Table 7.3.
Answer:
1. Convert the weight-percentages of each DNAPL component to mole fractions.
a. 100 g of solvent contains 70 g trichloromethane, 15 g trichloroethylene, and 15 g
tetrachloroethylene.
b. 70 g trichloromethane ¼
70 g
119:37 g=mol
¼ 0:586 mol
ß 2007 by Taylor & Francis Group, LLC.
c. 15 g trichloroethylene ¼
15 g
131:38 g=mol
¼ 0: 038 mol
d. 15 g tetrachloroethylene ¼ 15
g
165:82 g= mol
Þ¼0 :090 mol
e. Total moles DNAPL ¼ 0.586 þ 0.038 þ 0.090 ¼ 0.714 mol
f. Mole fractions : X(trichloromethane) ¼
0:586
0:714
ÀÁ
¼ 0:821
g. X(trichloroethylene) ¼
0 :038
0 :714
ÀÁ
¼ 0: 053
h. X(tetrachloroethylene) ¼
0:090
0:714
ÀÁ
¼ 0: 126
i. Sum of mole fractions ¼ 0.821 þ 0.053 þ 0.126 ¼ 1.000
Calculate S
eff
from Equation 7.2 and Table 7.3.
.
S
eff
(trichloromethane) ¼ 0.821 3 7920 mg=L ¼ 6502 mg=L
.
S
eff
(trichloroethylene) ¼ 0.053 3 1100 mg=L ¼ 58.3 mg=L
.
S
eff
(tetrachloroethylene) ¼ 0.126 3 200 mg=L ¼ 25.2 mg=L
By the guideline in Section 7.3.1, if the measured concentration in a well of a multi-
component DNAPL mixture is 1% or more of the effective solubilities of its compon-
ents, it is likely that a DNAPL source zone is near the well. The measured
concentrations
.
C
meas
(trichloromethane) ¼ 88 mg=L
.
C
meas
(trichloroethylene) ¼ 4.2 mg=L
.
C
meas
(tetrachloroethylene) ¼ 1.6 mg=L
are all greater than 1% of their respective effective solubilities. Therefore, the sampled
well is likely to be close to an upgradient DNAPL source zone.
EXAMPLE 3
U SING G ROUNDWAT ER CONCENTRA TIONS TO ESTIMAT E THE P ROXIMITY OF R ESIDUAL
M LTICOMPO NENT DNAPL M IXTURES ,WHERE THE I NITIAL C OMPOSITION I S NOT
K NOWN
When the composition of the source DNAPL mixture is not known, a variation of the
method used in Example 2 can be applied. From Equation 7.2, the mole fraction of
component a is
X
a
¼
S
eff
(a)
S
pure
(a)
and the sum of mole fractions of all components of the mixture must equal unity,
X
i
X
a
¼
X
i
S
eff
(a )
S
pure
( a)
¼ 1
In the absence of any dilution, dispersion, or degradation effects, S
eff
(a) will be equal to
the measured well concentration of component a, C
meas
(a). Using the EPA 1% guide-
line to account for loss effects, C
meas
(a) ¼ 0.01 S
eff
. This gives Equation 7.4, which uses
ß 2007 by Taylor & Francis Group, LLC.
only the measured concentrations of DNAPL components in a well and their pure
compound solubilities to describe the conditions where a DNAPL source zone is likely
to be near the monitoring well.
X
i
( 0: 01)S
eff
( a)
S
pure
(a)
¼
X
i
C
meas
(a )
S
pure
( a)
! 0: 01 ( 7: 4)
Suppose that, in Example 2, we did not know the initial composition of the DNAPL
solvent. Assume that the only data available were the measured well concentrations:
.
C
meas
(trichloromethane) ¼ 288 mg=L
.
C
meas
(trichloroethylene) ¼ 4.2 mg=L
.
C
meas
(tetrachloroethylene) ¼ 1.6 mg=L
The use of Equation 7.4 is illustrated in Table 7.4.
The sum of column 4 is greater than 0.01 and, therefore, it is likely that a source zone of
a DNAPL mixture is upgradient near the monitoring well.
EXAMPLE 4
USING SOIL CONCENTRA TIONS BELOW THE W ATER TABLE TO ESTIMAT E THE PROXIMITY
OF
R ESIDUAL SINGLE -C OMPONE NT DN APL
Trichloroethene (TCE) was measured to be 452 mg=kg in a soil sample from the
saturated zone. No other DNAPL compounds were detected. Measured soil data are
Porosity, p
w
¼ 0.27
Dry bulk density, d
b
¼ 1.9 kg=L
Fraction of organic carbon, f
oc
¼ 0.003
Is a TCE DNAPL free product phase likely to be present in the soil sample?
Answer :
Since only TCE was present, S
eff
¼ S, the pure compound water solubility. Use
Table 5.5 to obtain the following data for TCE:
TABLE 7.4
Estimati ng the Pr oximity of Residual Mult icomponen t DN APL Mixtures
of Unknow n Compo sition, Using Equation 7.4
Compound
Measured
Concentration in
Monitoring Well, C
meas
(mg=L)
Solubility of
Pure Compound,
S
pure
(mg=L)
C
meas
S
pure
Trichloromethane 88 7920 0.0111
Trichloroethylene 4.2 1100 0.00382
Tetrachloroethylene 1.6 200 0.008
Æ
i
C
meas
S
pure
0.02292
ß 2007 by Taylor & Francis Group, LLC.
S ¼ 1100 mg=L
K
oc
¼ 166 L=kg
Calculate C
min
soil
(TCE) from Equation 7.3.
C
min
soil
( a) ¼
S
eff
( a) Â K
d
d
b
þ p
w
ðÞ
d
b
¼
1100 mg =L Â ( 166 L= kg)(0: 003)( 1:9 kg=L) þ 0: 27ðÞ
1: 9 kg=L
C
min
soil
(a) ¼ 704 mg=kg
Since the measured TCE soil concentration of 452 mg=kg < 704 mg=kg, it most likely
is residual TCE rather than free product DNAPL.
EXAMPLE 5
U SING SOIL CONCENTR ATIONS BELOW THE W ATER TABLE TO ESTIMATE THE PROX IMITY OF
R ESIDUAL M ULTICOMPONE NT DN APL, W HERE THE I NITIAL C OMPOSITION I S NOT
K NOWN
Even though the initial composition of a DNAPL mixture is not known, the sum of its
mole fractions must equal unity. Under conditions of DNAPL saturation, the sum of
measured soil concentrations of the DNAPL components divided by their saturated
values, C
min
soil
, is equivalent to the sum of their mole fractions. Therefore,
X
a
C
meas
( a)
C
min
soil
( a)
! 1
Table 7.5 demonstrates an example calculation for determining if DNAPL free product
was present in a soil sample found to contain four different DNAPL compounds. The
soil had the following properties:
Porosity, p
w
¼ 32%
Dry bulk density, d
b
¼ 1.7 g=cm
3
TABLE 7.5
Example Soil Concentration Calculation for Multicomponent DNAPL
Compound
C
meas
(mg=kg)
Pure
Compound
Solubility,
S (mg=L) K
oc
(L=kg) K
d
C
min
soil
(mg=kg)
C
meas
C
min
soil
Tetrachloroethene (PCE) 109 200 155 0.465 131 0.834
Trichloroethene (TCE) 368 1100 166 0.498 755 0.487
Chlorobenzene (CB) 84 472 219 0.657 399 0.211
1,1,1-Trichloroethane
(111-TCA)
188 1330 110 0.330 689 0.273
P
C
meas
C
min
soil
¼ 1:805
ß 2007 by Taylor & Francis Group, LLC.
Organic carbon, f
oc
¼ 2.7%
K
d
is calculated from Equation 5.17: K
d
¼ K
oc
f
oc
C
min
soil
is calculated from Equation 7: 3: C
min
soil
(a) ¼
S
eff
( a) Â K
d
d
b
þ p
w
ðÞ
d
b
Since the sum of the estimated mole fractions,
P
a
C
meas
( a)
C
min
soil
( a)
, is greater than unity, DNAPL
was present in the soil sample.
7.4 POLYCHLORINATED BIPHENYLS
7.4.1 B
ACKGROUND
Polychl orinated biphen yls (PC Bs) are a family o f stabl e man-made organi c com-
pounds produce d commercially by direct chlorination of biphenyl. PCBs were
manufactured and sold under various trade names (Aroclor, Pyranol, Phenoclor,
Pyralene, Clophen, and Kaneclor) as complex mixtures differing in their average
chlorination level. In the United States, production of PCBs stopped in 1977.
Since 1929, about 1.4 billion pounds of PCBs have been commercially pro-
duced, the majority in the United States. It is estimated that several hundred million
pounds have been released to the environment. The world’s primary producer was
Monsanto, who produced PCBs under the trade name Aroclor from 1930 to 1977.
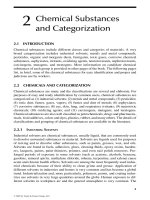
General Electr ic had a rival product called Pyranol. As shown in Figure 7.2,
individual PCB compounds are formed by substituting between 1 and 10 chlorine
atoms onto the biphenyl aromatic structure. These substitutions can produce 209
different congeners (homologues and isomers).
PCBs have many desirable properties for commercial applications: very high
chemical, thermal, and biological stability; low water solubility; low vapor pressure;
high dielectric constant; and high flame resistance. It is not surprising that
PCBs found wide application as coolant and insulation fluids in transformers and
capacitors, and as flame retardants, plasticizers, solvent extenders, organic diluents,
2
(a) (b)
3
4
5
6
3Ј
2Ј
4Ј
5Ј6Ј
Cl
m
Cl
n
Cl
Cl
Cl
Cl
Cl
Cl
23
5Ј6Ј
FIGURE 7.2 (a) General structure of polychlorinated biphenyls (PCBs). (b) One particular
6-chlorine PCB congener out of the 209 different types possible. The general formula for a
PCB is C
6
Cl
m
H
5Àm
C
6
Cl
n
H
5Àn
, where m and n each can be any integer between 1 and 5.
Individual PCB compounds are formed by substituting between 1 and 10 chlorine atoms onto
the biphenyl aromatic structure. This substitution can produce 209 different congeners (homo-
logues and isomers).
ß 2007 by Taylor & Francis Group, LLC.
add itives to epoxy paints, heat transfer fluids, in hydraul ic flu ids, in pesticide s, and in
print ing inks. PCB ’s are also by-pro ducts of many indus trial proces ses, such as the
manuf actur ing of chlorinat ed solvents and chlor inat ed benzene s.
Industria l grade PCBs are mixtures of PCB c ompounds blende d to give par-
ticu lar overal l proper ties, such as viscosit y, elect rical resistanc e, boil ing point , etc.
Fo r examp le, Aro clor-1242, see Tab le 7.1 (also called PCB-1 242), is actually
a mixture of more than 60 different PCB congeners with varying degrees of
chlorination. It naturally has a complicated gas chromatogram. A four-digit num-
bering system was assigned to the mixtures. The first two numbers indicate the
number of carbon atoms and the third and fourth numbers give the weight percent
of chlorine.
7.4.2 ENVIRONMENTAL BEHAVIOR
PCBs are very stable species and do not degrade readily in the environmen t. Most of
the released PCBs are believed to remain in mobile environmental reservoirs (Alder
et al., 1993). They even survive ordinary incineration and can escape as vapors up
the smokestack.
The wide use of PCBs has resulted in their common presence in soil, water,
and air. PCB dispersion from source regions to global distribution occurs mainly
through atmospheric transport and subsequent deposition. Because of their low
vapor pressure and water solubility, PCBs typically have very high partition coeffi-
cients to abiotic and biotic particles. In aquatic systems, sediments are an important
reservoir.
Environmental contamination was first reported in 1966, when high levels of
PCBs were found in fish. PCBs in wastes dumped into Lake Michigan accumulated
in the fatty tissue of fish and were subsequently found in the breast milk of nursing
mothers who ate the fish. Children nursed by these mothers showed higher rates of
development and learning disorders than those of nursing women in the same region
who had not eaten the fish. Similar developmental effects were reported from Japan
and Taiw an, where children of women who had eaten PCB contaminated rice
products were underdeveloped physically and mentally. Adults working with
PCBs were susceptible to a skin condition called chloracne, which produces pustules
and cysts.
Eventually it was discovered that PCBs did not easily biodegrade and their
use was restricted. In 1976, PCBs became regulated under the Toxic Substances
Control Act and safe disposal became a major concern. Between 1974 and
1979, PCBs were used only in the production of capacitors and transformers.
Monsanto stopped producing Aroclors in October 1977. In 1986, an inter-
national agreement was signed to ban most uses of PCBs and phase out the rest.
Nevertheless, although they are no longer manufactured, they still leak from old
electrical devices, inclu ding power transformers, capaci tors, television sets, and
fluorescent lights, and can be released from hazardous waste sites and historic
and illegal refuse dumps. They also persist in fatty foods, such as certain fish,
meat, and dairy products.
ß 2007 by Taylor & Francis Group, LLC.
The toxi city of PCBs is a compl icated issu e since each congener differs in its
toxicit y. All PCBs are listed by EPA as know n carci nogens and prior ity pollutants.
When they are incinerat ed, they can produce dioxins, whi ch are rated b y EPA a mong
the most toxi c subst ances.
7.4.3 A NALYSIS OF PCBS
The gas chrom atograp h=mass spect roscopy (GC=MS) patterns of the different
PCB mix tures show consi derable overlap and common petro leum products,
such as motor oil, also generat e peaks in the PCB regio n. Fo r these reason s,
unamb iguous ident ific ation of p articular PCBs requires meticul ous laboratory tech-
nique, especia lly if other organic compoun ds are presen t that have peaks in the PCB
GC=MS regio ns.
7.4.4 C ASE S TUDY :MISTAKEN IDENTIFICATION OF PCB COMPOUNDS
A met al recycl ing compan y shredd ed autom obile bodies , large appli ances, industri al
compo nents such as powe r trans formers and manuf acturing equipm ent, e tc.
The nonme tallic resi due from the shredding operation is called fluff, and consi sts
of shredded soli d plastics , foamed plastic, rubber , glass, wood , etc. The fluff was
oily, having absorb ed much of the residual oil rema ining in the original metal
compo nents.
Fluff was disposed off by transp ort to a land fill. Acce ptance by the land fill
operato rs was condition al on a chemical analysis that show ed the fluff d id
not contai n excess ive level s of toxic material s. High toxicit y woul d requi re the
fluff to be class ifi ed as hazardo us was te, with more stringent dispo sal condit ions.
PCBs were a toxic substance of concern . If PCB level s exceeded 50 mg=kg, the fl uff
would be class i fied as a hazardo us waste, requi ring special and expensi ve dispo sal
methods.
For severa l years, the recycl ing ha d never had PCB analyses from thei r fl uff
that wer e higher than about 15 mg=kg. Then, altho ugh they ha d no reason to
believe their mix of shredd ed mat erials had changed signi ficantl y, the labor atory
analyse s wer e suddenly show ing great er than 50 mg=kg of PCBs. Were these
results accurate or not? Because PCB mass spectra overlapped the motor-oil
GC=MS spectral range, it was possible that oil compounds were being mistaken
for PCBs.
Arrangements were made with a knowledgeable laboratory director to be
especially careful in sample cleanup and preparatio n. PCBs are very stable and can
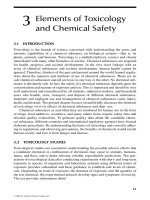
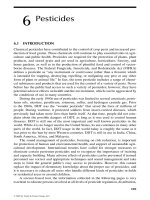
withstand stro ng acid and base extractio ns that wi ll decom pose most oils . Figure
7.3a and b compa res the GC=MS spect ra from an inadeq uate and a satisfactory
cleanup procedure on similar fluff samples containing PCBs. By modifying the
sample cleanup to more completely decomposed petroleum oils, it was shown that
the PCB concentrations were well below the hazardous waste threshold and the fluff
need not be treated as a hazardous waste.
ß 2007 by Taylor & Francis Group, LLC.
REFERENCES
Alder, A.C., Haggblom, M.M., Oppenheimer, S.R., and Young, L.Y., 1993, Reductive
dechlorination of polychlorinated biphenyls in anaerobic sediments, Environ. Sci. Tech-
nol. 27, 530–538.
USEPA, 1991, Dense Nonaqueous Liquids, Scott G. Huling and James W. Weaver, Ground
Water Issue, Office of Research and Development, Office of Solid Waste and Emer-
gency Response, Washington, DC, EPA=540=4-91-002, March.
USEPA, 1992, Estimating Potential for Occurrence of DNAPL at Superfund Sites, Publication
9355.4-07FS, Office of Emergency and Remedial Response, Washington, DC, NTIS
PB92-963338, January.
Minutes
(b)
20 18
16 14 12 10
19.15
2
5
15
20
10
Minutes
19.44
8
(a)
FIGURE 7.3 Gas chromatograph=mass spectroscopy (GC=MS) spectra of oily waste samples
containing PCBs. (a) Incomplete removal of oils results in an overlap of oil and PCB spectra,
causing poor resolution of the PCB components and an overestimation of PCB concentrations
in the sample. (b) Better cleanup preparation of the sample decomposes most of the oil
contaminants. This spectrum shows an expanded portion of (a) in the 10–20 min region.
Individual PCB compounds show much better separation and the measured PCB concentration
is much lower than in (a).
ß 2007 by Taylor & Francis Group, LLC.