Dynamic and Mobile GIS: Investigating Changes in Space and Time - Chapter 5 docx
Bạn đang xem bản rút gọn của tài liệu. Xem và tải ngay bản đầy đủ của tài liệu tại đây (507.18 KB, 12 trang )
____________________________________________________________________________________
Dynamic and Mobile GIS: Investigating Changes in Space and Time. Edited by Jane Drummond, Roland
Billen, Elsa João and David Forrest. © 2006 Taylor & Francis
Chapter 5
nen, A Process-oriented Data Model
Femke Reitsma
1
and Jochen Albrecht
2
1
Institute of Geography, School of Geosciences, The University of Edinburgh,
Scotland
2
Department of Geography, Hunter College, City University of New York, USA
5.1 Introduction
Thus far, GIScience has lacked an appropriate data model to represent processes;
processes such as erosion, migration and pollution dispersal. The need for extending
geographic representations for processes has been recognised in GIScience
literature (Peuquet, 2001; Raper, 2000; Worboys, 2001) and acknowledged as a key
goal in the University Consortium of GIS’s (UCGIS) research agenda (McMaster
and Usery, 2005). Yuan et al. (2005, p. 132) posit that ‘As the conceptual core of a
geographic information system, geographic representations determine what
information is available for communication, exploration and analysis. Hence,
research in extensions to geographic representations is critical to advancing
geographic information science’. In order to investigate change in space and time,
the theme of this book, we need to be able to explicitly represent change as it
occurs.
Existing theories and data models for simulating processes focus on representing
the state of the represented system at a moment in time. The future pattern of global
temperature from a global climate change model or the distribution of humans in an
agent-based simulation of disease spread, for example, only provides information
about the status of the attributes of the system at each step of the simulation,
attributes such as temperature or agent health at a particular location. Information
about the processes defined in the model is typically not expressed or represented in
any form. In utilising a process-oriented data model, we gain the advantage of being
able to query, analyse and visualise processes.
This chapter presents a new process-oriented data model called nen, which can
be used to represent process information. The application of the nen data model to
process modelling offers a set of modelling results that is complementary to those of
traditional models. Its novelty is the provision of a new epistemological window on
the modelled results, allowing for new process-oriented queries and analysis. The
data model is applied to a small watershed modelling test case, which provides
initial scope for simulating geographic processes with the new data model. In what
© 2007 by Taylor & Francis Group, LLC
Dynamic and Mobile GIS: Investigating Changes in Space and Time
78
follows, Section 5.2 describes current approaches to theorising and representing
processes in GIScience, forming a framework for discussion of the new data model.
Section 5.3
presents an alternative approach, describing the new data model, which
is then applied with a prototype implementation of a watershed runoff model in
Section 5.4. The results of the nen-based approach are then discussed in Section 5.5,
followed by consideration of validation of models and results of this method in
Section 5.6. Section 5.7 concludes the chapter.
5.2 Process theories and models
Current research into dynamic phenomena in GIScience has focused on the
representation of object states at each moment of time and over time. This is built
upon long-standing theories defining the entities that populate or compose space
and time. What is meant by object, are those things that we typically identify and
categorize as existing at an instant of time, such as trees, mountains, barrier islands
and political boundaries. These are the things dominating metaphysics (Hartshorne,
1998; Rosenthal, 1999), as well as GIScience ontologies (for example, Casati et al.,
1998; Fonseca and Egenhofer, 1999; Smith and Mark, 1998; Thomasson, 2001).
Spatiotemporal research in GIScience has consequently focused on the dynamics of
these entities, i.e. connecting the states of these entities over time (e.g. Tryfona and
Pfoser, 2001), or exploring the relationships between objects and the processes that
modify them (Bittner and Smith, 2003; Tomai and Kavouras, 2004).
As a consequence of the focus on static objects, data models for dynamic
phenomena centre on state changes of objects. For example, a global climate change
model, while containing process information in the model structure, does not
represent or store this information for analysis; rather, the states of the climate
system are stored at each instant of time. There is no data object that represents a
geographic process that changes over space and time (Yuan et al., 2005). This
results in a loss of information about the modelled process, which cannot accurately
be regained by interpolating between time slices. For example, in global climate
modelling virtually the same future state of increased temperature can be modelled
as a result of two very different changes to the model, an increase in solar
luminosity or an increase in CO
2
. It is not immediately obvious which process or
processes, such as heat transport or a change in cloud optical depth, caused these
results.
The static roots of GIS are found in its cartographic origins, which have formed
the intellectual framework for much of GIScience research (Kuhn, 2001; Yuan et
al., 2005). Kuhn (2001) notes a number of other reasons for such object orientation
in geographic and other information systems, including:
an emphasis on attributes and relationships rather than process and
change,
the weakness of logic-based formal languages in dealing with operations
and their semantics,
and a presumed priority of objects in human (spatial) cognition.
© 2007 by Taylor & Francis Group, LLC
5. nen, A Process-oriented Data Model
79
5.3 An alternative process data model
An alternative data model for the representation of processes is presented in this
chapter, which provides advantages in querying, analysis and exploration of process
descriptions under computer simulation conditions - or in silico. The data model is
referred to as a nen because its simplest and most abstract graph representation is a
node-edge-node triple (Figure 5.1). This simple point process representation, which
was used for the watershed prototype described in Section 5.4,
can be extended to
larger spatial entities, as might be represented by a polygon (Figure 5.2).
(
x1
,
y
1
)
(x2, y2)
Figure 5.1. Process representation for point feature.
A more comprehensive representation is in form of a tuple: (x1, y1, x2, y2, t, st,
{a1, a2, }, {r1, r2, …}). The spatial location of the process is identified by x1, y1,
x2, y2, which expresses the spatial extent of the process. The temporal location of
the process is defined by t, where a process is represented on a single layer of
spatial information rather than lost between time slices. The st represents the
spatiotemporal granularity of the process, which may be a function of the amount of
energy that initiates the process. For example, given some threshold breaking push,
the spatiotemporal granularity expresses how far and over what time period the
process will operate in response to that push. The set {a1, a2, } defines the
attributes of the process. The set {r1, r2, …} defines the rules of the process that
govern its dynamics and interaction with other processes. For example, a set of rules
for modelling the process of sediment transport in the longshore may define the
spatiotemporal extent of an instance of that process as 5m/hour, depending on
various relationships it holds between other processes operating in the nearshore.
© 2007 by Taylor & Francis Group, LLC
Dynamic and Mobile GIS: Investigating Changes in Space and Time
80
Figure 5.2. Process representation for area feature.
This data model provides a new epistemological window on geographic processes.
Simulating processes with a process data model allows us to ask questions that are
not directly answerable with current object-centred formulations, which focus on
the states of a system that result from the operation of processes. Our new data
model allows us to ask questions such as:
Where is a process operating at a particular instant of time?
How has the process changed over time?
What process(es) caused another process to occur?
The answers are not inferred (or interpolated) but are explicitly stored as part of
running the process model. How the rules of the process affect the spatial dynamics
of the process may therefore also be better explored.
5.4 Watershed modelling application
The theory of taking process as a representational primitive has been prototyped
with a watershed model within a simulation environment called Flux.
5.4.1 Simulator
Flux is written in Java and inherits and extends a number of basic operating classes
from the RePast (Recursive Porous Agent Simulation Toolkit) library, which is an
open source agent-based modelling environment created by Social Science
Research Computing at the University of Chicago
1
. RePast is primarily used for its
display and scheduling classes, and also has the advantage of containing Java
classes for importing GIS raster data (ESRI ASCII raster files). Flux contains a set
of interfaces and default classes that define the basic structure of the process model,
including methods that must be implemented by an inheriting domain model. The
1
/>
© 2007 by Taylor & Francis Group, LLC
5. nen, A Process-oriented Data Model
81
objective was to maximise generic functionality within the Flux classes, thereby
minimising the code to be developed within the domain model. The output of a
simulated model is stored in text files, which can then be queried with a query tool
that was developed as part of the initial steps towards process analysis. For a full
description of the simulator, see Reitsma and Albrecht (forthcoming).
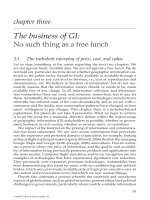
Figure 5.3 presents a sample simulation using the Flux simulator. Each nen,
represented by a node-edge-node tuple (as depicted in Figure 5.1), indicates an
instance of groundwater flow. The raster backdrop is a digital elevation model of a
small sub-watershed, where lighter shades represent higher elevation. At each time
step, groundwater flows towards the North-Western corner of the sub-watershed.
Figure 5.3. Sample simulation.
5.4.2 Model and simulation
For the purposes of testing the methodology a simple watershed model was
simulated. The model included the following restricted set of processes: Hortonian
overland flow, groundwater flow, infiltration, percolation, saturation excess runoff
and surface ponding. The data used to define the parameters for the simulation are
taken from the Reynolds Creek Experimental Watershed (RCEW), which is a high-
© 2007 by Taylor & Francis Group, LLC
Dynamic and Mobile GIS: Investigating Changes in Space and Time
82
quality long-term dataset created by the U.S. Department of Agriculture
Agricultural Research Service’s Northwest Watershed Research Center in Boise,
Idaho, United States. For a full description of the RCEW, see the special issue of
Water Resources Research introduced by Marks (2001).
At each hourly time step the precipitation input is updated, which initiates one of
three processes, Hortonian overland flow, infiltration or surface ponding. Each
process type has a set of rules defining its behaviour. For example, if the
precipitation exceeds the infiltration capacity of the soil and depending on the slope
characteristics, an instance of Hortonian overland flow will be generated. Although
hydrologically limited, the example explores the advantages of the methodological
approach of considering process as a data modelling primitive.
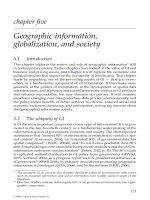
Two time slices of the simulation are presented in Figure 5.4. The black nens
represent the process of Hortonian overland flow, the dark grey nens represent
infiltration, the grey nens represent percolation, and the light grey nens represent
groundwater flow. Percolation and infiltration processes are represented by two
nodes on top of each other because the third dimension is not represented. With the
nen data model, insight can be gained as to where and when certain processes
dominate, which may lead to a better understanding of the modelled system and
give guidance to better ways of interacting with that system. For example, in Figure
5.4 it is evident that the process of Hortonian overland flow dominates in certain
upland parts of Upper Sheep Creek. This is in contrast to typical approaches to
modelling that generate results expressing where some energy or mass is at an
instant of time within the system, such as water in our watershed, with no
information of the processes that caused that state.
Figure 5.4. Simulation at two time steps, in progressive order from left to right.
© 2007 by Taylor & Francis Group, LLC
5. nen, A Process-oriented Data Model
83
5.5 Analysis of results
Without an appropriate data model to represent processes, we cannot easily analyse
or visualise the dynamics and interactions of processes for the purpose of
understanding the modelled system. Because the nen data model represents a
process as a spatially extended entity at any moment in time, not only can its state
be analysed but also its dynamics. In addition, due to the structure of the data
model, namely two nodes connected by an edge, network analysis may also result in
new insights into the model results. This may be of particular interest in recording
the interaction of processes and provide new patterns of process relationships to be
explored and classified, as will be discussed below.
5.5.1 Process state and change
As will be discussed further below, the state information of a process includes all of
the components of the data structure, namely:
the spatial location (x1, y1, x2, y2),
the temporal location (t),
the spatiotemporal granularity (st),
the attributes ({a1, a2, }),
and the rules ({r1, r2, …}).
Furthermore, from the data structure the direction and velocity of the process may
be derived. Each of these aspects of the state of the process can be temporally
extended such that processes can be queried for change. For example, the change in
direction of groundwater flow or change in the mass of water involved in this
process can be queried.
The location of individual or interacting processes can be analysed spatially,
spatiotemporally or temporally. Discovering spatial, spatiotemporal or temporal
clusters of processes may provide new insights into thresholds and critical
combinations of processes. Spatial clusters of processes may indicate the dominance
of processes in certain locations over time, such as erosion on a certain part of a hill
slope. Spatiotemporal clusters of processes are the spatial clustering of processes at
certain times, where we may use different notions of time, such as linear or cyclic;
for example, analysing the results of our model may result in findings of new large-
scale recurrent weather patterns such as El Nino. Modelled processes might be
widely distributed with no evident spatial pattern, yet we might find temporal
clusters that indicate that these processes are temporally correlated in some way; for
example, ocean thermohaline circulation has a significant effect on global climate
change (Knutti et al., 2004). In these three cases, we may find interesting new
patterns among process instants of the same type or among different processes.
The attributes of the modelled processes can be analysed for variations in
magnitude, or specific values of interest. Certain magnitudes may dominate in
certain types of processes or be correlated with other processes. The dynamics of
© 2007 by Taylor & Francis Group, LLC
Dynamic and Mobile GIS: Investigating Changes in Space and Time
84
the magnitude of groundwater in the process of groundwater flow, for example, may
be of interest in understanding the impact of soil structure on groundwater flow.
The rules of the process may also be of interest for analysis. Although typically
the rules or mathematical functions defining the behaviour of the process are static,
they may also be evolutionary. Genetic algorithms, for example, allow us to evolve
rules. We may find that certain types of rules dominate, or particular patterns of
rules or cycles of rules may develop.
Because the data model is spatiotemporally extended, the difference between one
location and the other can be used to provide information on direction and velocity
of processes. Determining the average direction and average velocity of a certain
type of process may be of particular import to analysing and understanding climate
processes. The direction and velocity of climate processes, for example, may be
correlated with certain types of erosion or vegetation growth processes at a certain
location. They also assist in the identification of when model rules need to change
as small-extent nens move into a new geographic regime; the effect of tropical
hurricanes on previously unaffected deciduous forests as a result of large-extent
global warming would be an example for that.
Each of these dimensions, location (spatial, temporal and spatiotemporal),
direction, velocity, attributes and rules can be combined, as is reflected in Figure
5.5. Some of these variables may be held constant, others may vary. The example
provided in the figure illustrates a case where analysis is undertaken on the
relationship between direction and attributes of a process. A yet unresolved
challenge is how we visualise all of these dimensions of analysis, either individually
or combined.
Location Direction Velocity Attributes Rules
Location
Direction
X
Velocity
Attributes
Rules
Figure 5.5. Matrix of dimensions of process analysis.
5.5.2 Process interaction and causality
In order to analyse the interaction of processes, the data model has another
advantage of supporting network analysis. Network analysis describes the structure
of a network based on the number of nodes, links and the attributes associated with
the nodes and/or links. It includes a large range of measures that are applied in
fields as disparate as sociology (e.g. Wasserman and Faust, 1994) and physics (e.g.
Dorogovtsev and Mendes, 2002). The network described by nens may be of a single
type of process, such as Hortonian overland flow, or of a collection of different
processes, such as those operating within a watershed. Analysing the network of
© 2007 by Taylor & Francis Group, LLC
5. nen, A Process-oriented Data Model
85
nens allows us to explore the relationships among processes. The application of
network analysis to networks of interacting processes may provide new measures of
process patterns, and perhaps, as with recent discoveries of patterns in animate and
inanimate networks (Barabasi, 2002), new insights into the systems that we model.
Tracing the complex interactions among processes of different types in our
model also allows us to monitor causality. In Figure 5.6, for example, five
interacting processes are schematically displayed, with the x-axis defining the
temporal extent and the y-axis a set of discrete rules. The interaction of processes is
indicated by spatial coincidence of some part of the nen data model representing the
process. In this figure: nen 1 interacts with nen 2 according to rules 4 and 5; the
process represented by nen 1 is followed by nen 3, which is followed by nen 4, this
is evident by the (x2, y2) of nen 1 being equivalent to the (x1, y1) of nen 3, and the
(x2, y2) of nen 3 being the same as the (x1, y1) of nen 4; nen 2, nen 3, and nen 4
interact with the long-term process nen 5; nen 3 starts as a point process and ends as
an area process.
Figure 5.6. Five interacting processes.
5.6 Validation of model and results
As with analysis, without an appropriate data model we cannot easily validate the
spatial behaviour of our modelled processes. For example, while a lumped
hydrological model may produce a hydrograph that concurs with the measured
discharge of the watershed, all of that modelled discharge may have resulted from
Hortonian overland flow, whereas in reality it may have been a mixture of processes
such as groundwater flow and saturated excess flow. Without a data model to
represent these processes, we cannot easily tell which processes caused the final
modelled state. This problem is well recognised by watershed modellers as that of
equifinality, which describes the situation where the same system state can result
from many different sets of processes (Bevan, 2000).
© 2007 by Taylor & Francis Group, LLC
Dynamic and Mobile GIS: Investigating Changes in Space and Time
86
The nen data model allows us to visualise and analyse the dynamics of the
processes in the model, facilitating the validation of the definitions, in rules of
mathematical formulas, of the processes in the model. Furthermore, the nen
provides the basis for testing and comparing different definitions of processes. By
visualising and measuring how descriptions of processes within the model compare
to other definitions and known spatial dynamics of processes, modellers can test
whether their mathematical or rule-based formalisms act in expected and realistic
ways.
A process data model also enhances the ability to compare models, lending itself
to model inter-comparison studies. The nen allows us to compare distribution,
quantity and dynamics of processes among models. This contrasts with traditional
approaches to model inter-comparison, which analyse the state of the modelled
system at the end of the simulation or over specified time steps (for example Dutay
et al., 2002).
In validating the results of a nen-based model, however, difficulty lies in the lack
of qualitative or quantitative descriptions of geographic processes. The results of a
model are validated by matching the output of the model with the real world, a good
result being the ability to mirror that world in silico. Typically a model is validated
by comparing the final simulated system state, with the real system at the same
point in time. In order to validate the results of a simulation using the nen data
model we need long-term empirical observations of the simulated processes. As
with the data and literature on the RCEW used in the watershed application and
described in Section 4,
such process data is rarely if ever available. Without process
observations, any simulation using the nen data model cannot be effectively
validated.
5.7 Conclusion and future developments
The lack of appropriate data against which to validate process definitions and results
of a nen-based model leads to questions of how we might go about observing and
measuring processes in the field. Qualitative descriptions of processes, while
available in certain cases, will always need to be quantified in some manner in order
to provide a basis for comparison and formal analysis. Quantitative measurement
devices also facilitate automation of analysis and validation. We do not know of any
measurement approach that quantitatively records process information, which
suggests there is a need for new data collection techniques that collect such
information for comparison against model results. Furthermore, data theory needs to
be developed, that is, new approaches to transforming real-world observations into
something that can be analysed (Jacoby, 1991).
Currently the flux simulation environment is constrained to small models due to
problems of computational complexity. To use this approach for models of larger
spatial scale and of greater detail would require a significant rewrite of the software
and consideration of advanced methods for accessing larger-scale computing
resources. Alternatively, it should not be difficult to modify existing modelling
software environments to implement the nen data model. However, given the
© 2007 by Taylor & Francis Group, LLC
5. nen, A Process-oriented Data Model
87
potential of data models to shed new light on simulations, new open and flexible
modelling platforms are needed that can easily incorporate new data models and
new analytical and visualisation methods. Such a platform would provide a useful
scientific environment for not only testing new models but testing new simulation
methodologies.
In summary, describing the world as a set of processes requires a data model for
modelling and simulating it as a set of processes. GIScience has thus far lacked a
process-based data model for dynamic modelling, which has limited our analysis
capabilities to information defining the state of a system at any instant of time rather
than the processes that are specified in the model. The proposed data model, the
nen, provides such an opportunity, resulting in new leverage gained in query and
analysis of simulation results. These results have provided insight into the spatial
dynamics of the simulated processes, and the data model will allow for the future
exploration and testing of causal interactions among processes. The nen data model
also provides new scope for visualisation and analysis of spatial processes, which is
a goal of our continuing research.
References
Barabasi, A. (2002) Linked: The New Science of Networks, Cambridge, MA: Perseus Publishing.
Bevan, K. J. (2000) 'Uniqueness of place and process representations in hydrological modelling',
Hydrology and Earth System Sciences, vol. 4, pp. 203–213.
Bittner, T. and Smith, B. (2003) 'Granular Spatio-temporal Ontologies', AAAI Spring Symposium on
Foundations and Applications of Spatio-Temporal Reasoning (FASTR), Palo Alto, USA.
Casati, R., Smith, B. and Varzi, A. C. (1998) 'Ontological tools for geographic representation', in
Gaurino, N. (ed.) Formal Ontology in Information Systems, pp. 77–85, Amsterdam, The
Netherlands: IOS Press.
Dorogovtsev, S. N. and Mendes, J. F. F. (2002) 'Evolution of networks', Advances in Physics, vol. 51, pp.
1079–1187.
Dutay, J. C., Bullister, J. L., Doney, S. C., Orr, J. C., Najjar, R., Caldeira, K., Campin, J. M., Drange, H.,
Follows, M., Gao, Y., Gruber, N., Hecht, M. W., Ishida, A., Joos, F., Lindsay, K., Madec, G.,
Maier-Reimer, E., Marshall, J. C., Matear, R. J., Monfray, P., Mouchet, A., Plattner, G. K.,
Sarmiento, J., Schlitzer, R., Slater, R., Totterdell, I. J., Weirig, M. F., Yamanaka, Y. and Yool, A.
(2002) 'Evaluation of ocean model ventilation with CFC-11: comparison of 13 global ocean models
ventilation with CFC-11: comparison of 13 global ocean models', Ocean Modelling, vol. 4, pp. 89–
120.
Fonseca, F. and Egenhofer, M. (1999) 'Ontology-Driven Geographic Information Systems', 7th ACM
Symposium on Advances in Geographic Information Systems, Kansas City, USA.
Hartshorne, C. (1998) 'The development of process philosophy', in Browning, D. and Myers, W. T. (eds.)
Philosophers of Process, pp. 391–407, New York: Fordham University Press.
Jacoby, W. G. (1991) Data Theory and Dimensional Analysis. Sage University Paper Series on
Quantitative Applications in the Social Sciences, no. 78, London: SAGE Publications.
Knutti, R., Fluckiger, J., Stocker, T. F. and Timmermann, A. (2004) 'Strong hemispheric coupling of
glacial climate through freshwater discharge and ocean circulation', Nature, vol. 430, pp. 851-856.
Kuhn, W. (2001) 'Ontologies in support of activities in geographic space', International Journal of
Geographic Information Science, vol. 15, pp. 613-631.
Marks, D. (2001) 'Introduction to special section: Reynolds Creek experimental watershed', Water
Resources Research, vol. 37, no. 11, pp. 2817.
© 2007 by Taylor & Francis Group, LLC
Dynamic and Mobile GIS: Investigating Changes in Space and Time
88
McMaster, R. and Usery, E. L. (eds.) (2005) A Research Agenda for Geographic Information Science,
New York: CRC Press.
Peuquet, D. J. (2001) 'Making space for time: Issues in space-time data representation', Geoinformatica,
vol. 5, pp. 11–32.
Raper, J. (2000) Multidimensional Geographic Information Science, New York: Taylor & Francis.
Reitsma, F. and Albrecht, J. (forthcoming). 'Implementing a new data model for simulating processes',
International Journal of Geographical Information Science.
Rosenthal, S. B. (1999) 'Contemporary metaphysics and the issue of time: Re-thinking the "great
divide"', International Philosophical Quarterly, vol. 39, pp. 157–171.
Smith, B. and Mark, D. M. (1998) 'Ontology and Geographic Kinds', 8th International Symposium on
Spatial Data Handling (SDH'98), pp. 308–320, Vancouver: International Geographical Union.
Thomasson, A. L. (2001) 'Geographic objects and the science of geography', Topoi, vol. 20, pp. 149–159.
Tomai, E. and Kavouras, M. (2004) 'From "Onto-GeoNoesis" to "Onto-Genesis": The design of
geographic ontologies', Geoinformatica, vol. 8, pp. 281–298.
Tryfona, N. and Pfoser, D. (2001) 'Designing Ontologies for Moving Objects Applications', Workshop on
Complex Reasoning on Geographical Data, Cyprus, [1 Dec 2001].
Wasserman, S. and Faust, K. (1994) Social Network Analysis: Methods and Applications, Structural
Analysis in the Social Sciences, Cambridge: Cambridge University Press.
Worboys, M. F. (2001) 'Modelling changes and events in dynamic spatial systems with reference to
socio-economic units', in Frank, A. U., Raper, J. and Cheylan, J-P. (eds.) Life and Motion of Socio-
Economic Units, pp. 129–138, London: Taylor and Francis.
Yuan, M., Mark, D., Egenhofer, M. and Peuquet, D. (2005). 'Extensions to geographic representations',
in McMaster, R. and Usery, E. L. (eds.) A Research Agenda for Geographic Information Science,
pp. 129–156, New York: CRC Press.
© 2007 by Taylor & Francis Group, LLC