Dynamic and Mobile GIS: Investigating Changes in Space and Time - Chapter 9 potx
Bạn đang xem bản rút gọn của tài liệu. Xem và tải ngay bản đầy đủ của tài liệu tại đây (494.8 KB, 14 trang )
____________________________________________________________________________________
Dynamic and Mobile GIS: Investigating Changes in Space and Time. Edited by Jane Drummond, Roland
Billen, Elsa João and David Forrest. © 2006 Taylor & Francis
Chapter 9
Generalisation of Large-Scale Digital Geographic
Datasets for MobileGIS Applications
Suchith Anand
1
, J. Mark Ware
2
and George Taylor
2
1
Centre for Geospatial Science, University of Nottingham, England
2
Faculty of Advanced Technology, University of Glamorgan, Wales
9.1 Introduction
This chapter builds upon the display and visualisation theme of this part of the book
and focuses on the automatic production of schematic maps on demand for small-
screen mobile devices using a simulated annealing technique. Mobile GIS
applications derive benefits of map generalisation by rendering relevant information
legible at a given scale by filtering the required information as well as enhancing the
visualisation of the large-scale data on small-screen display devices. With the
advent of high-end miniature technology as well as digital geographic data products
like OSMasterMap
®
and OSCAR
®
it is desirable to devise proper methodologies for
map generalisation specifically tailored for MobileGIS applications. Schematic
maps are diagrammatic representations based on linear abstractions of networks.
Transportation networks are the key candidates for applying schematisation to help
ease the interpretation of information by the process of cartographic abstraction
(Avelar, 2002). Generating schematic maps is an effective means of generalisation
of large-scale digital datasets for display on small-screen display screens and is
primarily aimed at enhancing visualisation and also making such maps user friendly
for interpretation. Hence the relevance of schematic maps in mobile applications
and their automated production underpins the theme of this part of the book.
The remainder of this chapter is set out as follows. Section 9.2 provides some
background information on Mobile GIS.
Section 9.3 looks into map generalisation
requirements from a MobileGIS perspective. Section 9.4 introduces schematic maps
and gives a short review of previous automated solutions to the problem of
schematic map generation.
Section 9.5 outlines the key generalisation processes
involved in the production of schematic maps. Section 9.6 contains a description of
the simulated annealing-based schematic map generator algorithm that forms the
basis for this chapter. A prototype implementation of this algorithm is described in
Section 9.7, and some experimental results are presented. The chapter concludes in
Section 9.8 with a summary of the results and a discussion of future work.
© 2007 by Taylor & Francis Group, LLC
Dynamic and Mobile GIS: Investigating Changes in Space and Time
162
9.2 Mobile GIS
Mobile GIS refers to the use of geographic data in the field on mobile devices, such
as networked PDAs. MobileGIS applications act according to a geographic trigger,
such as input of a place name, postcode, position of a GPS user, location
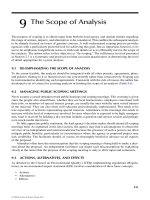
information from mobile phone network, etc. The main components of a MobileGIS
application are a global positioning system (GPS) receiver, a handheld computer
(e.g. a PDA), and a communication network with GIS acting as the backbone
(Figure 9.1).
Figure 9.1. The basic components of MobileGIS application.
Mobile GIS is a relatively new technology, but with the availability of digital
geographic datasets its application potential has increased tremendously. There is a
huge amount of available geographic information that can be re-purposed for
mobile GIS applications; together with the ability to filter and personalise content
by reference to a user's physical location, this will provide compelling business and
research opportunities in this emerging field. This work looks into how suitable map
generalisation techniques can be applied to generate schematic maps from large-
scale digital geographic data to enable more effective means of map interpretation
on small-screen display devices.
9.3 Map generalisation – Mobile GIS perspective
The process of simplifying the form or shape of map features, usually carried out
when the map is changed from a large scale (i.e. more detailed) to a small scale (i.e.
less detailed), is referred to as generalisation. This necessitates the use of operations
such as simplification, selection, displacement and amalgamation of features that
takes place during scale reduction (Ware et al., 2003).
Through the introduction of OSMasterMap
®
, the Ordnance Survey has now made
available a seamless digital map database of the UK. The OSMasterMap
®
data
features are digital representations of the world. All real-world objects are
© 2007 by Taylor & Francis Group, LLC
9. Generalisation of Large-Scale Digital Geographic Datasets for MobileGIS Applications
163
represented as explicit features and each identified by a unique TOID (Topological
Identifier). The features have survey accuracy ranging from ±1.0 m in urban areas
to ±8.0 m in mountain and moorland areas (OS, 2005).
The key benefits OSMasterMap
®
has over the previous large-scale digital
geographic dataset OSLandline
®
, as summarised by ESRI (2005), include providing
a single, consistent seamless national digital base map; improved topological
structure thereby increasing functionality and flexibility for map display; improved
speed, accuracy and simplicity of derived data capture through the new data
structure of point, line and polygon features; ease of integrating other datasets
thereby adding value to the geometry of features by taking advantage of unique
TOID referencing. With the large-scale use and application of mobile devices it is
now possible to deliver digital geographic information for mobile GIS applications.
OSMasterMap with its advantages provides immense opportunities for MobileGIS
applications. Also the need to deliver the required map information on small display
screens of devices, such as PDAs, necessitates the application of appropriate map
generalisation techniques that are specifically tailored for this purpose.
Change of
scale from
1:5000 to
1:10000
Figure 9.2. In order to verify the suitability of OSMasterMap data for small-screen devices, the
data for the St David’s area in Wales was loaded in ESRI’s ArcPad and tested on an HP iPAQ
PocketPC h5400 series for display at various scales to find out the extent of spatial conflicts
between features and data volume (Figure 9.2). There is explicit proof of graphic conflict during
scale changes and the dataset needs to be tailored for small-screen devices specifically for
MobileGIS by applying suitable map generalisation techniques. For example, it is necessary to
apply scale-based symbolisation as well as applying suitable generalisation operators like
simplification, displacement, amalgamation, etc.
© 2007 by Taylor & Francis Group, LLC
Dynamic and Mobile GIS: Investigating Changes in Space and Time
164
To understand the demands for mobile applications, the general user
requirements of small display devices (PDAs in this case) have been studied. In
comparison to contemporary desktop computers which have processing power in
the range of 4GHz, memory of 512Mb and storage capacity around 80 Gb, the
processing capability of PDAs is much lower in the range of 400 MHz and their
memory capacity is in range of 64 Mb. This highlights the issues associated with
processing and storage of large-scale voluminous datasets in thin client mobile
devices. Also the low display resolution of 240 x 320 pixels as well as the smaller
display area of 50cm
2
of PDA screens make it necessary that the final output image
is generalised as per appropriate small display cartographic specifications to give
maximum clarity and readability. The basic criteria are easily readable font,
recognisable symbols, mutually exclusive colour at each level of information and
the comprehensive use of area colour with few geometric details of objects
(GiMoDig Project, 2003). In summary, PDAs have different form factors such as
display resolution, varying numbers of display lines, horizontal or vertical screen
orientation and hardware specification when compared to contemporary desktop
computers. Hence GIS applications that are to be used in PDAs need to be tailored
appropriately. The application of suitable automated map generalisation techniques
will help in filtering redundant data enabling faster and more efficient rendering, as
well as in noise reduction in the rendered image and enhancing the essential details.
A suitable cartographic display specification was developed to represent
OSMasterMap data on small-screen devices and tests were carried out at a wide
range of display scales (Anand et al., 2004). It was found that there is graphic
conflict between features during scale reduction and since the display screen is
comparatively small the problem becomes much more apparent. Once the same
dataset was displayed as per the developed cartographic specification, better graphic
representation was obtained (Figure 9.3).
For example it can be seen in Figure 9.3
that the low display resolution and smaller display area of PDA screens makes it
necessary to apply the small display cartographic specification to give maximum
clarity and readability to the output map.
9.4 Schematic maps
The way people construct and interact with geographical maps has to be regarded as
a valuable clue to the properties of the underlying mental structures and process for
spatial cognition. Geographical maps are described as spatial representation media
that play an important role in many processes of human spatial cognition (Berendt
et al., 1998). A schematic map is a diagrammatic representation based on linear
abstractions of networks. Typically transportation networks are the key candidates
for applying schematisation to help ease the interpretation of information by the
process of cartographic abstraction. Schematic maps are built up from sketches,
which usually have a close resemblance to verbal descriptions about spatial features
(Avelar, 2002). The London Tube map is one of the well-known examples of a
schematic map.
© 2007 by Taylor & Francis Group, LLC
9. Generalisation of Large-Scale Digital Geographic Datasets for MobileGIS Applications
165
Figure 9.3. OSMasterMap
®
data (Ordnance Survey © Crown Copyright. All rights reserved, 2005)
displayed in an HP iPAQ using ESRI’s ArcPad. The figure shows how appropriate symbolisation
can enhance readability and usability of maps. Image on the left explicitly showing poor
visualisation and image on the right displayed at the map specification guidelines for 1:5000 scale
showing better data visualisation.
Generating schematic maps involves reducing the complexity of map details while
preserving the important characteristics. When performed manually, this is a time-
consuming and expensive process. The application of GIS tools has led to the
realisation that the efficiency of the cartographer could be increased through the
automation of some of the more time-consuming generalisation techniques.
Contemporary GIS software contains tools for automating processes like line
simplification that allow basic generalisation to be performed. Although these
algorithms go some way to help in the automated production of schematic maps,
there is lot of work to be done on developing fully automated schematic map
generalisation tools. Differing geometric and aesthetic criteria are used to design a
schematic map keeping in mind the common goals of graphic simplicity, retention
of network information content and presentation legibility (Avelar et al., 2000).
Agrawala and Stolte (2001) in their work present a set of cartographic
generalisation techniques specifically designed to improve the usability of route
maps. These techniques are based on cognitive psychology research, which has
shown that an effective route map must clearly communicate all the turning points
on the route, and that precisely depicting the exact length, angle and shape of each
road is much less important. They show how these techniques are applied in hand-
drawn maps and demonstrate that by carefully distorting road lengths and angles
© 2007 by Taylor & Francis Group, LLC
Dynamic and Mobile GIS: Investigating Changes in Space and Time
166
and simplifying road shape, it is possible to clearly and concisely present all the
turning points along the route. Avelar (2002) presents the automatic generation of
schematic maps from traditional, vector-based, cartographic information. By using
an optimisation technique, the lines of the original route network are modified to
meet geometric and aesthetic constraints in the resulting schematic map. The
algorithm preserves topological relations using simple geometric operations and
tests.
Due to their abstracting power, schematic maps are an ideal means for
representing specific information about a physical environment. They play a helpful
role in spatial problem-solving tasks such as way finding. Schematic maps provide a
suitable medium for representing meaningful entities and spatial relationships
between entities of the represented world. While topographic maps are intended to
represent the real world as faithfully as possible, schematic maps are seen as
conceptual representations of the environment (Casakin et al., 2000). When
generalising, the cartographer tries to maintain the topology of the features as
accurately as possible, i.e. the cartographer might sacrifice absolute accuracy in
order to maintain relative accuracy (João, 1998). As discussed earlier, the key
characteristic of mobile devices is their limited processing capacity, memory and
available display area. This necessitates that suitable operations are carried out to
filter redundant data from the voluminous large-scale digital datasets to help reduce
data volume as well as enhancing visualisation and readability of the final output.
Schematic maps are an effective way of achieving this outcome.
Though schematic maps have found successful application in underground tube
map design, Morrison (1996) in his study of public transportation maps in western
European cities demonstrates that schematic maps are not suitable for surface
transport maps like bus networks. This highlights the problem of developing
techniques that are specific for generating schematic maps of surface transportation
networks.
9.5 Key generalisation processes for schematic maps
A schematic map is a diagrammatic representation based on linear abstractions of
networks. Typically transportation networks are the key candidates for applying
schematisation to help ease the interpretation of information by the process of
cartographic abstraction. Schematic maps are built up from sketches which usually
have a close resemblance to verbal descriptions of spatial features (Avelar, 2002).
The best example of modern-day schematic map is the London Tube map originally
designed by Harry Beck in 1931. An electrical engineer, he based his design on a
circuit diagram and used a schematic layout. The map locally distorted the scale and
shape of the tube route but preserved the overall topology of the tube network
(LTM, 2004). Morrison (1996) describes the appropriateness of using schematic
maps for different modes of transport.
The basic steps for generating schematic maps are to eliminate all features that
are not functionally relevant and to eliminate any networks (or portions of
networks) not functionally relevant to the single system chosen for mapping. All
© 2007 by Taylor & Francis Group, LLC
9. Generalisation of Large-Scale Digital Geographic Datasets for MobileGIS Applications
167
geometric invariants of the network's structure are relaxed except topological
accuracy. Routes and junctions are symbolised abstractly (Waldorf, 1979).
Elroi (1988) refined the process by adding three more graphic manipulations.
Lines are simplified to their most elementary shapes. Line simplification algorithms
such as the Douglas–Peucker algorithm, can be applied to road datasets to remove
unwanted detail and produce a simplified version of the network (Figure 9.4).
Figure 9.4. First step in the schematisation process is line simplification, which can be achieved
using an algorithm such as that of Douglas and Peucker (1973).
Also lines are re-oriented to conform to a regular grid, such that they all run
horizontally, vertically or at a 45-degree diagonal. Finally, congested areas are
increased in scale at the expense of reducing scale in areas of lesser node density.
Graphic legibility is an important criterion and is achieved using appropriate
display styles for the point, line, area features, etc., as per the small display
cartographic specification guidelines. This will enhance the readability of the
generated schematic map as well as improving usability. Other factors that need to
be taken into consideration are fixing the aspect ratio of the resulting image to make
the effective use of map space when trying to fit and display on a small-screen
display device of 240 x 320 pixel resolution (Agrawala, 2001).
As the first step in the process is line simplification, algorithms like the Douglas–
Peucker algorithm can be applied to road datasets to remove unwanted detail and
produce a simplified version of the network. When generating schematic maps from
large-scale datasets for navigation systems, the basic user inputs are the initial and
final destinations. Based on this the system will have to generate an appropriate
schematic map depicting the turning point information with turning directions
coupled preferably with map labels for each road and the distance to be travelled on
that road. The local landmarks on the route from the PoI (Points of Interest) dataset
can also be displayed, enhancing the navigational usability of the generated
schematic map. This is especially important if the system is to be used for
generating tourist maps. Also, by enabling different levels of scale for the
schematic, the global properties of the route can be conveyed to the user. Factors,
auch as optimal aspect ratio of the resulting image to make effective use of the map
space when trying to fit on a small display device of 240 x 320 pixel resolution,
have to be taken into account. Enabling support for vertical and horizontal scrolling
will add more flexibility to the user (Agrawala, 2001).
© 2007 by Taylor & Francis Group, LLC
Dynamic and Mobile GIS: Investigating Changes in Space and Time
168
9.6 Schematic map generation using simulated annealing
This work is concerned with the problem of effective rendering of large-scale digital
geographic datasets on small display devices by developing appropriate
optimisation techniques for generating schematic maps. At present, schematic maps
are produced manually or by using graphic-based software. This is not only a time-
consuming process, but requires a skilled map designer. The challenge of replacing
an experienced cartographer with a computer that can make the same decisions to
produce a schematic map is compelling. Also there are no cartographic guidelines to
help the design of schematic maps. Automatic generation of schematic maps may
improve results and make the process faster and cheaper. It would also help in
extending the use of schematic maps to transportation systems of cities around the
world (Avelar and Muller, 2000).
Simulated Annealing (SA) (Kirkpatrick et al., 1983) is a probabilistic heuristic
optimisation technique used for finding good approximate solutions to the global
optimum of a given function in a large search space. SA has been used as an
optimisation tool in a wide range of application areas, including routing, scheduling
and layout design (e.g. Cerny, 1985; Elmohamed et al., 1998; Chwif et al., 1998),
including automated cartographic design (Zoraster, 1997; Ware et al., 2003). In this
chapter, the schematisation process is considered as an optimisation problem. Given
an input state (a network layout), an alternative state can be obtained simply by
displacing one or more of the network vertices. The search space being examined is
therefore the set of all possible states of a given input linear network. Each state can
be evaluated in terms of how closely it resembles a schematic map. However,
finding the best state by exhaustively generating and evaluating all possible states is
not possible, as for any realistic data set the search space will be excessively large
(i.e. there are too many alternative layouts). SA offers a means by which a large
search space can be searched for near optimal solutions. A standard SA algorithm,
which is adopted for use in this work, is shown in Figure 9.5.
At the start of the optimisation process SA is presented with an initial
approximate solution (or state). In the case of the schematic map problem, this will
be the initial network (line features, each made up of constituent vertices). The
initial state M
initial
is then evaluated using a cost function; this function assigns to the
input state a score that reflects how well it measures up against a set of given
constraints. If the initial cost is greater than some user defined threshold (i.e. the
constraints are not met adequately) then the algorithm steps into its optimisation
phase. This part of the process is iterative. At each iteration, the current state M
current
(i.e. the current network) is modified (M
modified
) to make a new, alternative
approximate solution. The current and new states are said to be neighbours. The
neighbours of any given state are generated usually in an application-specific way.
A decision is then taken as to whether to switch to the new state or to stick with the
current. Essentially, an improved new state is always chosen, whereas a poorer new
state is rejected with some probability P, with P increasing over time. The iterative
process continues until stopping criteria are met (e.g. a suitably good solution is
found or a certain amount of time has passed).
© 2007 by Taylor & Francis Group, LLC
9. Generalisation of Large-Scale Digital Geographic Datasets for MobileGIS Applications
169
input: M
initial
, Schedule, Stopconditions
set M equal to M
current initial
set T to T
initial
(from Schedule)
evaluate M
current
while notmet(Stopconditions)
select Vertex at random
generate random Displacement
displace Vertex
evaluate M
modified
if M
modified
is better than M
current
M
modified
becomes M
current
else
P = e
-∆E
/
T
M
modified
becomes M
current
with probability P
endif
update T according to Schedule
endwhile
Figure 9.5. Shows the Simulated Annealing (SA) algorithm used as optimisation process for
producing schematic map. SA is presented with an initial approximate solution and then evaluated
using a cost function. If the initial cost is greater than some user-defined threshold then the
algorithm steps into its optimisation phase. At each iteration, a vertex is chosen at random in the
current state and subjecting it to a small random displacement. The new state is also evaluated
using the cost function and a decision is then taken as to whether to switch to the new state or to
stick with the current. An improved new state is always chosen, whereas a poorer new state is
rejected with some probability. The iterative process continues until stopping criteria are met.
At each iteration the probability P is dependent on two variables: ∆E (the difference
in cost between the current and new states); and T (the current temperature). P is
defined as:
P = e
-∆E
/
T
T is assigned a relatively high initial value; its value is decreased in stages
throughout the running of the algorithm. At high values of T higher cost new states
(large negative ∆E) will have a relatively high chance of being retained, whereas at
low values of T higher cost new states will tend to be rejected. The acceptance of
some higher-cost new states is permitted so as to allow escape from locally optimal
solutions.
9.7 Experimental results
Prototype software for producing schematic maps for transportation network data
has been developed. The software makes use of the simulated annealing
optimisation technique described in Section 9.6.
The schematic software is currently
implemented as a VBA script within ArcGIS. This technique has been used
© 2007 by Taylor & Francis Group, LLC
Dynamic and Mobile GIS: Investigating Changes in Space and Time
170
previously to control operations of displacement, deletion, reduction and
enlargement of multiple map objects to help resolve spatial conflict arising due to
scale reduction (Ware et al., 1998).
A brief summary of the schematisation process is given below:
Define constraints – these are the constraints that are to be met by the derived
schematic map. The current software caters for three constraints: (i) topology –
ensures that original map and derived schematic map are topologically consistent;
(ii) angular – if possible, edges should lie in horizontal, vertical or diagonal
direction; and (iii) minimum edge length – if possible, all edges should have a
length greater than some minimum length.
Simplify lines – input data will typically contain redundant vertices. These are
removed by application of a suitable line simplification algorithm (in our case the
Douglas–Peucker algorithm).
Evaluate and optimise – evaluate the simplified input map (against constraints)
and if required make use of simulated annealing optimisation to refine. The
simulated annealing part of the process is iterative. At each iteration, the current
map is modified slightly (in our implementation this involves displacing a single
vertex) and re-evaluated. A decision is then taken as to whether to keep the new
map or revert to the previous. Essentially, an improved map is always retained,
whereas a poorer map is rejected with some probability p, with p increasing over
time. The process continues until stopping criteria are met (e.g. a suitably good map
is generated or a certain amount of time has passed).
The tests are applied to real datasets and schematic maps are automatically
generated in response to a selected set of constraints from large-scale digital
geographic dataset (OSCAR
®
road dataset in this case). The topology of the
network is preserved during the schematisation process. This approach provides
promising results in the production of automated schematic maps. Examples are
shown in Figures 9.6
and 9.7. These maps are subsequently displayed within the
ArcPad application on an HP iPAQ PDA. Example output is shown in Figure 9.8.
Also aesthetic improvement of the resulting schematic map is achieved using
appropriate display styles for the point, line and area features, etc., as per the small
display cartographic specification guidelines, which will enhance usability of the
generated schematic map.
© 2007 by Taylor & Francis Group, LLC
9. Generalisation of Large-Scale Digital Geographic Datasets for MobileGIS Applications
171
Figure 9.6. Pregeneralised data OSCAR
®
road dataset (Ordnance Survey © Crown Copyright. All
rights reserved, 2005).
Figure 9.7. Schematic map of the same roads shown in Figure 9.6 generated by the simulated
annealing software and symbolised automatically.
© 2007 by Taylor & Francis Group, LLC
Dynamic and Mobile GIS: Investigating Changes in Space and Time
172
Figure 9.8. OSCAR
®
road dataset (Ordnance Survey © Crown Copyright. All rights reserved,
2005) displayed in an HP iPAQ using ESRI’s ArcPad. The image on the left is before applying
schematisation and the image on the right is displayed after applying schematisation. There are
areas for future improvement as highlighted where certain sections, practically straight on the left,
have sharp bends on the right. This again is dependent on the amount of schematisation applied.
9.8 Conclusion and future developments
This chapter looks into the development of automated means of generating
schematic maps from large-scale digital geographic datasets that are tailored for
mobile GIS applications. A prototype Simulated Annealing technique has been used
to derive a schematic map with reduced linear information from the detailed
OSCAR
®
dataset. The key theme of this chapter is to demonstrate the practical
application of the simulated annealing technique in the automatic generation of
optimal on the fly schematic maps from large-scale geographic datasets specifically
tailored for mobile GIS applications. A simulated annealing algorithm and
implementation for generating schematic maps based on a number of user-defined
constraints is presented. Results show the algorithm to be successful in producing
schematic maps from large-scale transportation network data.
Future work will concentrate on refining the technique through the use of
additional constraints and also the analysis of the extent to which the predefined
road classifications in the OSCAR
®
dataset are affected during the schematisation
process with respect to the original map. Also it is intended to do further work on
© 2007 by Taylor & Francis Group, LLC
9. Generalisation of Large-Scale Digital Geographic Datasets for MobileGIS Applications
173
the automated application of the appropriate small display specific symbology for
the generated schematic map based on the referenced display scale to enhance
visualisation and usability.
Acknowledgement
The authors express thanks for the Ordnance Survey for providing the data used in
this work.
References
Agrawala, M. (2001) Visualizing Route Maps, Stanford, CA: Stanford University.
Agrawala, M. and Stolte, C. (2001) ‘Rendering effective route maps: improving usability through
generalization’, Proceedings of SIGGRAPH 2001, Los Angeles, pp. 241–249.
Anand, S., Ware, J. M. and Taylor, G. E. (2004) ‘Map Generalization for OSMasterMap Data in
Location Based Services and Mobile GIS Applications’, Proceedings of 12th International
Conference on Geoinformatics, Gävle, Sweden, pp. 54–60.
Avelar, S. and Muller, M. (2000) ‘Generating Topologically Correct Schematic Maps’, Proceedings of
9th International Symposium on Spatial Data Handling, Beijing, pp. 1472–1480.
Avelar, S. (2002) Schematic Maps On Demand: Design, Modeling and Visualization, Zurich: Swiss
Federal Institute of Technology.
Berendt, B., Barkowsky, T., Freksa, C. and Kelter, S. (1998) ‘Spatial representation with aspect maps’,
Spatial cognition: An Interdisciplinary Approach to Representing and Processing Spatial
Knowledge, Berlin: Springer-Verlag, pp. 157–175.
Casakin, H., Barkowsky, T., Klippel, A. and Freksa, C. (2000) ‘Schematic Maps as Wayfinding Aids’,
Lecture Notes in Artificial Intelligence-Spatial Cognition 1849, pp. 59–71.
Cerny, V. (1985) ‘Thermodynamical approach to the travelling salesman problem: An efficient
simulation algorithm’, Journal of Optimization Theory and Applications, 45(1), pp. 41–51.
Chwif, L., Barretto, M. R. P. and Moscato, L. A. (1998) ‘A solution to the facility layout problem using
simulated annealing.’ Computers in Industry Archive, 3 6(1-2), pp. 125–132.
Douglas, D. H. and Peucker, T. K. (1973) ‘Algorithms for the reduction of the number of points required
to represent a digitized line or its caricature’, The Canadian Cartographer, 10, pp. 112–122.
Elmohamed, S., Fox, G. and Coddington, P. (1998) ‘A Comparison of Annealing Techniques for
Academic Course Scheduling’, Proceedings of 2nd International Conference on the Practice and
Theory of Automated Timetabling, Syracuse, NY, USA, pp. 92–114.
Elroi, D. S. (1988) ‘Designing a Network Linemap Schematization Software Enhancement Package’,
Proceedings of the Eighth Annual ESRI User Conference, Redlands, CA.
ESRI (2005) ‘A roadmap to success with OSMasterMap’, [Online],
Available:
www.esriuk.com/pdf/media/OSMasterMap.pdf [09/08/05].
GiMoDig (2003) ‘Geospatial info-mobility service by real-time data-integration and generalization’,
[Online], Available:
[20/07/05].
João, E. (1998) Causes and Consequences of Map Generalization, London: Taylor and Francis.
Kirkpatrick, S., Gelath, C. D. and Vecchi, M. (1983) ‘Optimization by simulated annealing’, Science,
220, pp. 671–680.
LTM (2004) ‘Transport in London Archives’, [Online], Available:
[04/05/05].
Morrison, A. (1996) ‘Public transportation maps in western European cities’, Cartographic Journal, vol.
33, no. 2, pp. 93–110.
© 2007 by Taylor & Francis Group, LLC
Dynamic and Mobile GIS: Investigating Changes in Space and Time
174
Ordnance Survey (2005) ‘OSMasterMap & OSCAR Technical Information, Ordnance Survey UK
website’, [Online], Available:
[04/07/05].
Waldorf, S. P. (1979) Schematic Navigational Map Design, Lawrence: University of Kansas.
Ware, J. M., Jones, C. B. and Thomas, N. (2003) ‘Automated cartographic map generalisation with
multiple operators: a simulated annealing approach’, The International Journal of Geographical
Information Science, vol. 17, no. 8, pp. 743–769.
Zoraster, S. (1997) ‘Practical results using simulated annealing for point feature label placement’,
Cartography and Geographical Information Systems, vol. 24, no. 1, pp. 228–238.
© 2007 by Taylor & Francis Group, LLC