Honey Bees: Estimating the Environmental Impact of Chemicals - Chapter 12 pptx
Bạn đang xem bản rút gọn của tài liệu. Xem và tải ngay bản đầy đủ của tài liệu tại đây (888.51 KB, 21 trang )
12 Typology of French acacia
honeys based on their
concentrations in metallic
and nonmetallic elements
J. Devillers, J.C. Doré, C. Viel,
M. Marenco, F. Poirier-Duchêne,
N. Galand, and M. Subirana
Summary
The elemental analysis of 150 French acacia honeys (Robinia pseudoacacia
L.) collected by beekeepers in apparently polluted and nonpolluted envi-
ronments was performed by using inductively coupled plasma atomic
emission spectrometry (ICP-AES) to measure significant concentrations
of Ag, Ca, Cr, Co, Cu, Fe, Li, Mg, Mn, Mo, P, S, Zn, Al, Cd, Hg, Ni, and
Pb. Fortunately, Cd, Hg, Ni, and Pb were not detected in the analyzed
samples. Conversely, Ag, Cu, Al, Zn, and S were found in some samples
located near industrial areas. Because a high variability was found in the
concentration profiles, correspondence factor analysis was used to ratio-
nalize the data and provide a typology of the honeys based on the concen-
tration of these different elements in the honeys. The results were
confirmed by means of principal component analysis and hierarchical
cluster analysis. Finally, the usefulness of the acacia honey as a bioindica-
tor of heavy metal contamination is discussed.
Introduction
The continued expansion of industrial production and the growing use of
chemicals in agriculture have led to an increase in the number and quanti-
ties of xenobiotics released into the different compartments of the bios-
phere [1]. The health risks to human and nonhuman biota associated with
these chemicals are evaluated on the basis of critical and reliable informa-
tion on exposures and on related adverse health effects [2]. In this process,
the estimation of the environmental concentrations of the hazardous
chemicals plays a key role. A number of precise technical sampling
methods are available for monitoring pollutants in the environment.
However, due to their high technicality and cost, they are generally not
used routinely [2]. Conversely, bioindicators are now widely employed for
estimating, at low cost, the level of contamination of organic and inorganic
chemicals in aquatic and terrestrial ecosystems [e.g. 3–5].
© 2002 Taylor & Francis
Thus, honey bees commonly forage within 1.5km of their hive and
exceptionally as far as 10 to 12km, depending on their need for food and
its availability [6]. During their foraging flights, they visit numerous plants
to gather nectar, pollen, honeydew, sap, and water. Honey bees also visit
puddles, ponds, and other aquatic resources to collect the 10 to 40 liters of
water which are necessary annually for the colony [7]. When honey bees
settle on leaves, penetrate in the corolla of flowers to gather nutritive sub-
stances, and collect water in aquatic resources, they provide composite
samples from thousands of different visited points spread across a broad
area. Consequently, these insects and their products such as honey, wax,
or royal jelly can provide a good idea of the level of contamination which
can be found in air, soil, vegetation, and water in a radius of a few kilome-
ters from their hive [8, 9].
Heavy metals, which are ubiquitous environmental pollutants, are
found in all the compartments of the biosphere and in living species [e.g.
10–13], including honey bees and their products [14–24]. In this context,
samples of French acacia (Robinia pseudoacacia L.) honeys, directly col-
lected by beekeepers in hives located in media presenting different
degrees of pollution, were analyzed for their concentrations of heavy
metals and some other metallic and nonmetallic elements in order to see
whether it was possible to find a relationship between industrialization and
the levels of honey contamination by heavy metals and related com-
pounds. An attempt was also made to provide a typology of the honey
samples from the multivariate analysis of their concentrations of metallic
and nonmetallic elements in relation to environmental variables.
Materials and methods
Sampling
Under the authority of the CNDA (National Center for the Development
of Apiculture), beekeepers of various French departments were first con-
tacted by letter to determine their interest in being involved in a study
dealing with the elemental analysis of acacia honeys and their typology on
the basis of environmental variables. A sampling protocol and material to
collect and store the honey were then sent only to those beekeepers inter-
ested in the project and who agreed to provide all the necessary informa-
tion to interpret the analytical results found with their honey(s). In the
protocol, beekeepers were required to select one hive located in an unpol-
luted area and another near a source of pollution such as an industry,
mine, highway, urban area, and so on. It was necessary to manually collect
the honey samples by slow extraction from the combs. Beekeepers had to
use the material provided for the study to avoid problems of external cont-
amination by trace elements. The use of bee smokers was prohibited, and
it was also forbidden to smoke during the sampling process. Honey
Elemental analysis of French acacia honey 249
© 2002 Taylor & Francis
samples had to be stored in small hermetically sealed containers which
were certified as free of trace elements, and were sent out to the bee-
keepers.
The environmental conditions around the hives had to be clearly
described. It was also required to give some climatic information, such as
the main direction of the winds, and so on. If the two hives selected by a
beekeeper were located in the same department, the kilometric distance
between them had to be provided. Finally, any unusual event (e.g. fire)
also had to be mentioned.
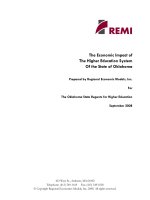
A total of 150 different acacia honeys were obtained from various
French departments (Figure 12.1). All samples were collected in
May–June 1999. Honeys were sent by post to the analytical laboratory for
determination of their metallic and nonmetallic element content.
250 J. Devillers et al.
Figure 12.1 Honey sampling regions in France (in dark).
© 2002 Taylor & Francis
Analytical method
Prior to the preparation and chemical analysis of the honeys, the samples
were coded and randomized to avoid identification of their location and
characteristics by the chemists. The mineralization of the honey samples
was performed in polypropylene-stoppered vials of volume 10ml [Plas-
tiques Gosselin, ref. TR 95 PPN 10TT (vials) and ref. B135 (stoppers)] by
dissolution in HNO
3
at 69.5 percent (63.01g/mol; dϭ 1.409) (Carlo Erba,
ref. 408071). The nitric acid was diluted in a 2/3 ratio with water previously
purified according to the guidelines of the French Pharmacopoeia (10th
edition). For each honey sample, amounts of 1g and 2g, exactly weighed,
were digested with 5ml of the above acidic solution. Stoppered vials were
placed in a bain-marie and warmed up to the temperature of mineraliza-
tion of 60°C. After 3 to 4 hours under these experimental conditions, the
volume of each vial was exactly adjusted to 10ml with HNO
3
(2/3) and the
mineralization at 60°C was continued as described above. The time
required to obtain complete mineralization of a sample ranged from 6 to 7
hours and the product was analyzed after keeping it for 15 hours at room
temperature. A solution of 5ml was injected into an inductively coupled
plasma atomic emission spectrometer (Panorama, Jobin & Yvon) previ-
ously calibrated for the 18 metallic and nonmetallic elements studied. The
zero point was obtained from the acidic solution used to mineralize the
honey and which corresponded with a blank. The wavelengths (nm) of the
emission peaks of the 18 elements studied were the following: aluminum
(Al), 396.152; cadmium (Cd), 226.502; calcium (Ca), 317.933; chromium
(Cr), 267.716; cobalt (Co), 228.616; copper (Cu), 324.754; iron (Fe),
259.940; lead (Pb), 220.353; lithium (Li), 670.776; magnesium (Mg),
279.553; manganese (Mn), 257.610; mercury (Hg), 184.887; molybdenum
(Mo), 202.032; nickel (Ni), 231.604; phosphorus (P), 178.225; silver (Ag),
328.068; sulfur (S), 180.672; zinc (Zn), 213.856. All samples were analyzed
automatically in triplicate by using the spectrometer. In addition, for each
sample, both quantities (i.e. 1 and 2g) were analyzed. The standard devia-
tions were always less than 5 percent. The limit of the detection of S, Al,
Ni, Ca, Mg, P, and Pb in the honey samples was 1ng/g. That for Hg was
0.5ng/g while Ag, Cr, Fe, Li, and Mn were not detected at a concentration
less than 0.2ng/g. The limit of detection of Co, Cu, Mo, Cd, and Zn was
0.1ng/g.
Data analysis
Statistical analyses were performed with ADE-4 [25], a powerful statistical
software program designed specifically for the analysis of environmental
data. ADE-4 includes the main linear multivariate analyses and numerous
graphical tools for optimal data display.
Elemental analysis of French acacia honey 251
© 2002 Taylor & Francis
Analytical results
The elemental analyses obtained from 1 or 2g of honey yielded similar
results, and hence were averaged. The number of positive responses (i.e.
concentrations greater than the different limits of detection) for each
metallic or nonmetallic element in the 150 honeys analyzed and their cor-
responding average, smallest, and highest concentrations (in mg/kg to raw
(wet) weight) are given in Table 12.1. Detailed analytical results are listed
in Table 12.2, except for elements with a frequency of positive responses
less than 5 percent.
Table 12.1 shows that calcium (Ca), magnesium (Mg), and phosphorus
(P) were detected in all the samples analyzed. The concentrations of these
three elements show Gaussian distributions (graphs not given). The results
obtained are not surprising because of the nature, role, and ubiquity of
these fundamental elements. Manganese (Mn), is also significantly present
in most of the honey samples. Aluminum (Al), molybdenum (Mo), and
sulfur (S) have been detected in more than 50 percent of the samples, and
to a lesser extent, copper (Cu) and zinc (Zn). About 30 percent of the ana-
lyzed samples include measurable concentrations of cobalt (Co) while
about 20 percent of the honeys are contaminated with quantifiable concen-
trations of chromium (Cr). Table 12.1 shows that silver (Ag) has been
detected in 10 samples with concentrations ranging from 0.08 to 2.16ppm.
Lithium was only measured in samples 6, 43, 44, 133, and 149 (Table 12.2)
252 J. Devillers et al.
Table 12.1 Number of positive responses (Nb/150) for the 18 elements studied with
their corresponding mean, lowest, and highest concentrations (in ppm)
Element Nb/150 Mean Range
Ag 10 0.596 0.08–2.16
Ca 150 22.86 2.98–108.50
Cr 33 0.187 0.05–0.52
Co 46 0.091 0.03–0.25
Cu 72 0.163 0.03–2.30
Fe 107 1.167 0.13–10
Mg 150 8.708 1.43–109.50
Mn 141 0.777 0.06–10.34
Mo 86 0.441 0.07–0.81
P 150 73.45 32.12–397.5
S 84 15.39 1.60–67.66
Zn 67 0.746 0.04–5.96
Al 99 0.374 0.05–1.44
Li 5 0.07 0.02–0.24
Ni 0 na* na
Hg 0 na na
Cd 0 na na
Pb 0 na na
Note
*na, not applicable.
© 2002 Taylor & Francis
Elemental analysis of French acacia honey 253
Table 12.2 Element concentrations (ppm) in acacia honeys collected in France
No. Ag Ca Cr Co Cu Fe Mg Mn Mo P S Zn Al
1 Ͻld* 14.77 Ͻld 0.03 Ͻld 1.76 5.45 0.29 0.45 53.61 Ͻld Ͻld 0.30
2 Ͻld 18.18 Ͻld Ͻld Ͻld 0.81 5.50 0.33 Ͻld 47.48 Ͻld 0.40 Ͻld
3 Ͻld 7.82 Ͻld Ͻld Ͻld Ͻld 3.77 0.09 0.49 47.38 Ͻld Ͻld Ͻld
4 Ͻld 12.95 Ͻld 0.04 Ͻld Ͻld 6.91 0.21 Ͻld 56.87 Ͻld 0.42 0.27
5 Ͻld 7.61 Ͻld 0.07 Ͻld 0.17 5.81 0.20 0.44 54.78 2.86 0.11 Ͻld
6 Ͻld 5.48 0.11 Ͻld Ͻld 0.37 3.03 0.10 0.43 42.88 5.11 0.27 Ͻld
7 Ͻld 4.68 0.09 0.04 Ͻld 0.66 2.11 Ͻld 0.48 40.78 Ͻld Ͻld Ͻld
8 Ͻld 7.30 Ͻld 0.03 Ͻld 0.13 4.17 0.28 0.48 49.70 Ͻld Ͻld Ͻld
9 Ͻld 11.40 Ͻld Ͻld Ͻld 10.00 16.65 0.52 0.58 125 9.11 0.74 0.43
10 Ͻld 10.95 0.16 0.10 Ͻld 4.76 9.97 0.28 0.81 98.36 Ͻld 0.97 0.10
11 Ͻld 18.86 Ͻld 0.11 Ͻld 1.03 7.27 1.39 Ͻld 61.11 Ͻld 0.70 0.39
12 Ͻld 10.25 Ͻld Ͻld Ͻld 0.44 4.17 0.22 0.61 49.25 Ͻld 0.34 0.31
13 Ͻld 13.48 Ͻld 0.10 Ͻld Ͻld 5.53 0.41 0.53 57.28 Ͻld Ͻld 0.25
14 Ͻld 9.84 0.15 0.11 Ͻld 0.47 3.46 0.22 0.71 51.29 Ͻld 0.32 Ͻld
15 Ͻld 5.62 0.13 0.10 Ͻld 0.33 2.73 0.14 0.77 53.72 Ͻld 0.20 Ͻld
16 Ͻld 23.95 Ͻld Ͻld Ͻld 0.63 16.27 1.73 0.42 81.51 16.89 Ͻld 0.62
17 Ͻld 10.13 Ͻld Ͻld Ͻld 1.57 5.03 0.28 0.79 59.34 Ͻld 0.29 0.10
18 Ͻld 19.39 Ͻld Ͻld Ͻld Ͻld 7.37 0.17 Ͻld 71.70 10.30 Ͻld 0.48
19 Ͻld 29.83 0.15 0.11 0.22 0.79 18.34 3.05 0.72 96.55 Ͻld 0.45 Ͻld
20 Ͻld 108.5 Ͻld 0.12 0.57 1.78 46.83 2.64 Ͻld 149.3 35.90 0.65 0.63
21 Ͻld 13.06 Ͻld Ͻld Ͻld 0.79 3.47 0.18 0.56 48.02 Ͻld Ͻld 0.31
22 Ͻld 16.87 Ͻld Ͻld Ͻld 0.61 9.39 0.93 0.62 55.74 Ͻld Ͻld Ͻld
23 Ͻld 34.99 Ͻld Ͻld Ͻld 1.59 4.77 1.42 0.59 57.70 8.18 0.52 0.50
24 Ͻld 32.96 Ͻld Ͻld Ͻld 1.00 7.49 3.11 0.60 71.22 Ͻld 0.76 0.13
25 Ͻld 15.45 Ͻld Ͻld Ͻld 0.39 4.00 0.35 0.68 46.24 5.73 Ͻld Ͻld
26 Ͻld 7.34 0.12 0.11 Ͻld 0.62 2.82 0.19 0.63 46.44 Ͻld Ͻld Ͻld
27 Ͻld 47.34 0.08 0.13 1.68 2.23 102.6 10.34 0.68 350.2 60.11 0.95 1.10
28 Ͻld 67.01 Ͻld 0.13 2.30 2.94 109.5 9.65 0.58 397.5 67.66 1.26 1.01
29 Ͻld 55.20 Ͻld Ͻld Ͻld 1.82 12.97 0.58 0.60 73.71 17.09 Ͻld Ͻld
30 Ͻld 23.48 0.13 0.11 Ͻld 0.80 7.32 1.73 0.67 62.66 Ͻld Ͻld Ͻld
31 Ͻld 20.40 0.16 0.13 Ͻld 0.76 7.06 1.26 0.73 53.95 Ͻld 0.24 Ͻld
32 Ͻld 23.15 0.16 0.13 Ͻld 0.82 8.20 1.22 0.76 61.15 Ͻld 1.88 Ͻld
33 Ͻld 19.82 Ͻld Ͻld Ͻld 0.70 6.14 0.19 0.63 57.58 8.20 Ͻld 0.28
34 Ͻld 15.24 Ͻld Ͻld Ͻld 1.38 6.24 0.22 0.62 70.78 5.96 0.79 0.43
35 Ͻld 11.12 Ͻld Ͻld Ͻld 0.47 4.76 0.10 0.68 56.77 11.47 Ͻld 0.27
36 Ͻld 18.81 Ͻld Ͻld Ͻld 0.64 7.85 0.42 Ͻld 55.88 Ͻld 0.55 0.30
37 Ͻld 14.35 Ͻld Ͻld Ͻld Ͻld 5.16 0.48 Ͻld 44.58 Ͻld 0.72 0.28
38 Ͻld 33.86 Ͻld Ͻld Ͻld 1.18 23.35 2.89 Ͻld 105.8 15.20 1.28 0.43
39 Ͻld 18.25 Ͻld 0.11 Ͻld 1.06 6.98 1.16 0.65 57.80 Ͻld 1.49 0.46
40 Ͻld 20.37 Ͻld Ͻld Ͻld Ͻld 6.82 1.15 Ͻld 58.75 4.12 1.79 0.49
41 Ͻld 27.47 Ͻld Ͻld Ͻld 3.35 6.41 1.28 Ͻld 52.32 Ͻld 5.96 0.98
42 Ͻld 21.46 Ͻld Ͻld Ͻld 1.56 9.06 2.79 0.62 59.60 7.49 1.30 1.17
43 Ͻld 34.36 Ͻld Ͻld Ͻld 0.41 12.00 Ͻld Ͻld 65.73 16.89 Ͻld 0.44
44 Ͻld 14.55 Ͻld Ͻld Ͻld 0.58 5.23 0.13 Ͻld 62.30 10.24 Ͻld 0.56
45 Ͻld 15.30 Ͻld Ͻld Ͻld 0.69 5.32 0.17 0.42 52.50 9.06 Ͻld 0.63
46 Ͻld 21.63 0.14 0.08 Ͻld 1.62 5.43 0.13 0.37 53.28 Ͻld 0.47 0.74
47 Ͻld 15.86 Ͻld Ͻld Ͻld Ͻld 4.02 0.09 0.53 54.33 Ͻld Ͻld 0.25
48 Ͻld 15.94 Ͻld 0.08 Ͻld 0.54 7.74 0.37 0.54 43.32 Ͻld 0.49 Ͻld
49 Ͻld 18.15 Ͻld 0.07 0.27 1.23 5.47 0.12 0.53 54.83 11.27 Ͻld 0.40
50 Ͻld 34.54 Ͻld Ͻld Ͻld 1.21 19.35 0.19 Ͻld 90.48 17.34 Ͻld Ͻld
© 2002 Taylor & Francis
254 J. Devillers et al.
Table 12.2 Continued
No. Ag Ca Cr Co Cu Fe Mg Mn Mo P S Zn Al
51 Ͻld 15.19 Ͻld Ͻld Ͻld 0.27 6.13 0.08 0.37 56.14 Ͻld Ͻld Ͻld
52 0.15 34.71 0.15 0.08 Ͻld Ͻld 18.98 0.60 0.43 83.97 Ͻld Ͻld 0.66
53 Ͻld 13.73 Ͻld Ͻld Ͻld 0.55 4.74 0.16 0.46 62.35 12.92 Ͻld Ͻld
54 Ͻld 13.69 Ͻld Ͻld Ͻld 0.49 4.61 0.15 Ͻld 50.83 Ͻld Ͻld 0.36
55 Ͻld 25.85 Ͻld Ͻld Ͻld Ͻld 14.74 0.27 0.50 118.6 11.50 Ͻld 0.46
56 Ͻld 13.54 Ͻld Ͻld Ͻld 0.37 3.78 0.10 Ͻld 56.45 Ͻld Ͻld 0.25
57 Ͻld 35.10 Ͻld Ͻld Ͻld 0.38 3.72 0.22 Ͻld 50.09 Ͻld Ͻld 0.25
58 Ͻld 17.54 Ͻld 0.07 Ͻld 0.62 9.92 0.82 0.44 51.43 Ͻld 0.38 0.29
59 Ͻld 12.86 Ͻld Ͻld Ͻld 1.17 4.13 0.13 Ͻld 41.86 Ͻld 0.46 0.79
60 Ͻld 15.95 Ͻld Ͻld Ͻld Ͻld 4.54 0.11 0.32 43.54 Ͻld Ͻld 0.40
61 Ͻld 13.67 0.11 Ͻld Ͻld 0.68 6.06 0.12 Ͻld 55.39 9.49 0.45 0.75
62 Ͻld 9.08 Ͻld Ͻld Ͻld 0.86 4.38 0.16 Ͻld 44.17 6.90 Ͻld 0.26
63 Ͻld 26.91 Ͻld Ͻld Ͻld 1.77 9.07 0.84 Ͻld 43.48 16.96 1.11 0.93
64 Ͻld 24.47 Ͻld Ͻld Ͻld 1.30 8.39 0.63 Ͻld 46.60 7.89 Ͻld Ͻld
65 Ͻld 57.96 Ͻld Ͻld Ͻld Ͻld 36.28 1.37 0.53 91.85 Ͻld 2.00 1.00
66 Ͻld 12.24 Ͻld 0.08 Ͻld 0.88 4.17 0.14 0.34 48.17 13.69 Ͻld Ͻld
67 Ͻld 13.74 Ͻld 0.03 Ͻld 0.82 5.32 0.23 0.11 37.63 11.77 Ͻld 0.35
68 Ͻld 16.00 Ͻld Ͻld Ͻld 0.32 5.26 0.17 0.44 50.03 1.60 Ͻld 0.20
69 Ͻld 27.33 Ͻld Ͻld Ͻld 1.35 6.94 0.30 0.12 63.17 17.75 Ͻld Ͻld
70 Ͻld 28.66 Ͻld Ͻld 0.06 0.97 8.87 Ͻld 0.10 61.98 17.58 0.91 0.16
71 0.08 6.93 0.05 Ͻld 0.04 Ͻld 2.55 0.09 0.26 57.72 5.24 Ͻld 0.05
72 Ͻld 21.13 0.10 Ͻld 0.04 Ͻld 2.08 0.06 0.12 37.83 8.36 Ͻld 0.14
73 Ͻld 61.77 Ͻld 0.04 0.24 0.97 19.08 0.54 0.16 77.71 30.12 0.81 0.63
74 Ͻld 12.26 0.06 Ͻld 0.04 Ͻld 1.99 0.14 0.14 34.78 8.00 Ͻld Ͻld
75 Ͻld 24.51 Ͻld 0.03 0.16 0.67 6.49 0.18 0.15 70.86 Ͻld 0.56 0.30
76 Ͻld 90.12 0.24 Ͻld 0.10 1.03 18.71 5.99 Ͻld 75.11 28.81 0.58 Ͻld
77 Ͻld 17.27 Ͻld 0.03 0.06 0.50 5.50 0.18 0.19 66.27 16.79 0.27 0.23
78 Ͻld 27.53 0.09 0.04 0.07 0.71 9.11 0.52 Ͻld 73.21 21.38 Ͻld 0.23
79 Ͻld 14.05 0.20 Ͻld Ͻld 2.13 4.05 0.30 0.14 47.88 Ͻld Ͻld 1.02
80 Ͻld 80.13 Ͻld 0.04 0.20 2.63 63.13 Ͻld Ͻld 223.4 37.62 1.48 1.44
81 Ͻld 30.97 Ͻld Ͻld 0.10 4.24 8.66 0.44 0.13 86.81 21.93 Ͻld 0.59
82 Ͻld 12.27 0.11 0.09 0.09 Ͻld 4.10 0.47 0.24 70.23 13.72 Ͻld 0.21
83 Ͻld 46.26 0.14 Ͻld 0.06 0.64 9.71 1.35 Ͻld 66.27 16.53 Ͻld 0.30
84 Ͻld 27.05 Ͻld Ͻld 0.04 0.62 5.35 Ͻld Ͻld 71.72 9.50 Ͻld Ͻld
85 Ͻld 13.64 0.25 Ͻld 0.05 0.81 4.95 0.28 Ͻld 61.35 18.66 0.16 0.21
86 Ͻld 70.40 Ͻld Ͻld Ͻld 0.75 4.90 0.30 Ͻld 59.48 26.05 0.23 Ͻld
87 Ͻld 10.11 Ͻld 0.04 0.05 Ͻld 3.13 0.10 0.20 54.50 13.16 Ͻld 0.16
88 Ͻld 11.40 Ͻld Ͻld 0.26 0.36 4.42 0.11 Ͻld 46.24 Ͻld Ͻld Ͻld
89 Ͻld 8.62 0.36 Ͻld 0.06 Ͻld 2.99 0.09 Ͻld 67.95 12.08 0.29 0.17
90 Ͻld 7.08 0.09 Ͻld 0.05 Ͻld 2.14 0.13 Ͻld 43.79 8.46 Ͻld 0.18
91 Ͻld 21.93 Ͻld Ͻld 0.30 0.74 6.06 0.20 0.21 46.49 13.68 Ͻld Ͻld
92 Ͻld 13.31 Ͻld Ͻld Ͻld 0.69 2.98 Ͻld Ͻld 32.12 6.74 0.41 Ͻld
93 Ͻld 9.32 Ͻld Ͻld 0.06 0.25 3.38 0.10 Ͻld 56.09 Ͻld Ͻld 0.23
94 Ͻld 7.85 0.13 Ͻld 0.06 0.57 4.08 0.12 Ͻld 49.15 10.53 0.23 0.36
95 Ͻld 36.22 Ͻld Ͻld 0.06 0.41 7.48 0.19 Ͻld 65.94 11.03 Ͻld Ͻld
96 0.13 13.26 0.09 Ͻld 0.06 Ͻld 2.51 2.86 0.12 56.63 6.41 0.55 Ͻld
97 Ͻld 18.05 Ͻld Ͻld Ͻld Ͻld 5.58 0.17 0.07 44.68 12.60 Ͻld Ͻld
98 Ͻld 16.85 Ͻld Ͻld Ͻld 0.52 5.66 0.39 Ͻld 53.61 12.78 0.89 Ͻld
99 0.17 26.14 Ͻld Ͻld 0.14 0.50 7.16 2.94 0.25 78.63 13.86 Ͻld 0.28
100 Ͻld 6.49 Ͻld Ͻld 0.07 Ͻld 1.66 0.12 Ͻld 94.23 Ͻld 0.55 0.17
101 Ͻld 16.85 Ͻld Ͻld 0.04 Ͻld 3.65 0.12 0.14 57.19 9.49 Ͻld 0.09
© 2002 Taylor & Francis
Elemental analysis of French acacia honey 255
Table 12.2 Continued
No. Ag Ca Cr Co Cu Fe Mg Mn Mo P S Zn Al
102 Ͻld 14.13 Ͻld 0.25 0.06 Ͻld 3.23 0.29 0.72 99.54 11.46 Ͻld 0.15
103 Ͻld 13.31 Ͻld 0.21 0.05 Ͻld 2.83 0.34 0.75 98.33 Ͻld Ͻld 0.26
104 Ͻld 8.01 Ͻld Ͻld 0.06 Ͻld 1.59 0.16 Ͻld 89.06 Ͻld Ͻld Ͻld
105 Ͻld 13.59 Ͻld 0.06 0.05 Ͻld 3.81 0.24 0.16 55.44 Ͻld Ͻld 0.10
106 0.54 10.52 0.51 Ͻld 0.06 Ͻld 2.53 0.14 0.68 101.9 Ͻld 0.44 0.11
107 Ͻld 15.65 Ͻld Ͻld 0.05 Ͻld 3.22 0.36 0.23 63.84 Ͻld Ͻld 0.10
108 Ͻld 28.23 0.11 Ͻld 0.07 Ͻld 6.96 1.22 Ͻld 67.79 21.86 Ͻld Ͻld
109 Ͻld 12.75 Ͻld 0.03 0.06 Ͻld 4.78 Ͻld Ͻld 54.44 15.65 0.36 0.19
110 Ͻld 8.70 Ͻld Ͻld 0.05 Ͻld 1.91 0.11 Ͻld 94.48 Ͻld Ͻld 0.05
111 Ͻld 9.85 Ͻld Ͻld 0.03 Ͻld 3.03 0.21 0.34 64.98 Ͻld Ͻld Ͻld
112 Ͻld 19.68 Ͻld Ͻld 0.06 Ͻld 6.83 0.57 Ͻld 73.84 15.39 Ͻld 0.07
113 Ͻld 22.41 Ͻld Ͻld 0.08 0.43 4.95 0.74 0.61 105.2 12.22 0.49 0.21
114 Ͻld 64.54 Ͻld Ͻld 0.12 Ͻld 15.00 2.93 Ͻld 148.7 Ͻld 0.72 0.25
115 Ͻld 107.8 Ͻld 0.20 0.11 4.63 18.00 3.08 Ͻld 154.3 23.83 0.66 0.37
116 Ͻld 9.79 Ͻld Ͻld 0.04 0.43 2.69 Ͻld Ͻld 57.96 Ͻld Ͻld Ͻld
117 Ͻld 28.33 Ͻld Ͻld 0.08 0.63 6.44 1.97 Ͻld 116.1 Ͻld Ͻld 0.51
118 Ͻld 16.88 Ͻld Ͻld 0.06 0.73 3.26 0.32 Ͻld 101 Ͻld Ͻld 0.40
119 Ͻld 11.61 Ͻld 0.21 0.07 0.40 2.73 0.18 0.65 100.4 10.93 0.56 0.16
120 Ͻld 23.94 Ͻld Ͻld 0.10 0.65 5.16 0.21 Ͻld 116.2 Ͻld Ͻld Ͻld
121 Ͻld 27.41 Ͻld Ͻld 0.07 0.72 4.73 0.78 Ͻld 69.80 6.56 Ͻld 0.42
122 Ͻld 37.52 Ͻld 0.08 0.31 0.61 14.64 0.35 0.16 110.5 23.59 Ͻld Ͻld
123 2.16 7.96 0.50 Ͻld 0.06 Ͻld 2.48 0.09 Ͻld 96.83 8.10 Ͻld 0.15
124 Ͻld 21.28 Ͻld 0.19 0.08 0.55 4.25 0.31 0.49 104.5 Ͻld Ͻld 0.30
125 Ͻld 21.92 Ͻld Ͻld 0.08 Ͻld 4.61 0.20 Ͻld 118.4 Ͻld 0.69 Ͻld
126 Ͻld 2.98 Ͻld Ͻld 0.05 Ͻld 10.14 0.18 0.62 100.4 11.61 0.58 0.15
127 0.57 14.55 0.52 Ͻld 0.07 Ͻld 3.46 0.24 0.67 96.61 9.89 0.39 0.11
128 Ͻld 9.57 Ͻld Ͻld 0.05 3.48 2.96 1.23 Ͻld 55.16 Ͻld Ͻld 0.09
129 Ͻld 48.15 Ͻld 0.09 0.09 5.24 12.65 0.87 Ͻld 96.70 25.88 0.66 0.25
130 Ͻld 28.95 Ͻld Ͻld 0.06 Ͻld 4.17 0.19 0.64 100.7 Ͻld Ͻld 0.17
131 Ͻld 23.47 Ͻld Ͻld 0.08 Ͻld 7.01 0.37 Ͻld 129.1 Ͻld Ͻld 0.30
132 Ͻld 52.40 Ͻld Ͻld Ͻld Ͻld 12.14 0.34 0.25 62.24 22.73 Ͻld Ͻld
133 0.61 33.96 0.30 0.07 Ͻld 1.15 10.26 0.19 Ͻld 61.56 20.13 0.43 Ͻld
134 Ͻld 31.58 Ͻld Ͻld 0.34 1.02 8.88 0.35 Ͻld 56.20 20.48 Ͻld 0.38
135 Ͻld 26.71 Ͻld Ͻld 0.19 0.64 8.02 0.33 Ͻld 50.20 19.31 0.60 0.65
136 Ͻld 14.52 Ͻld Ͻld Ͻld 0.59 2.95 0.25 Ͻld 33.45 10.51 Ͻld 0.20
137 Ͻld 38.04 Ͻld 0.08 Ͻld 0.92 13.04 1.03 0.10 72.40 27.99 0.73 Ͻld
138 Ͻld 43.32 Ͻld Ͻld Ͻld 1.37 5.98 3.28 0.24 49.06 17.97 1.74 Ͻld
139 Ͻld 37.65 Ͻld Ͻld 0.30 1.39 9.61 1.55 Ͻld 49.99 21.99 0.76 0.78
140 Ͻld 30.04 Ͻld 0.06 0.33 0.69 12.28 0.79 0.26 59.34 22.82 Ͻld Ͻld
141 Ͻld 6.87 Ͻld 0.03 Ͻld Ͻld 3.25 0.25 0.55 47.04 Ͻld 0.11 Ͻld
142 Ͻld 29.86 Ͻld Ͻld Ͻld 0.24 9.32 0.45 0.49 53.20 Ͻld 0.04 Ͻld
143 Ͻld 11.66 Ͻld Ͻld 0.06 3.19 2.59 0.24 Ͻld 97.36 4.95 Ͻld 0.11
144 Ͻld 11.32 Ͻld Ͻld 0.04 3.06 3.69 0.27 Ͻld 64.96 Ͻld Ͻld Ͻld
145 Ͻld 8.35 Ͻld Ͻld 0.05 0.16 2.31 0.22 0.17 69.35 Ͻld Ͻld 0.09
146 1.03 8.77 Ͻld Ͻld 0.45 1.02 1.43 0.64 0.36 93.40 6.37 0.92 Ͻld
147 0.52 21.34 0.47 Ͻld 0.05 0.64 3.70 0.20 Ͻld 101.8 Ͻld Ͻld 0.17
148 Ͻld 9.83 Ͻld Ͻld 0.06 Ͻld 1.98 Ͻld Ͻld 98.58 Ͻld Ͻld Ͻld
149 Ͻld 14.24 Ͻld Ͻld Ͻld 0.38 5.01 0.43 0.10 40.78 Ͻld Ͻld 0.23
150 Ͻld 27.73 Ͻld Ͻld Ͻld 0.69 9.16 0.44 Ͻld 59.13 22.75 0.44 0.45
Note
*ϽldϭLess than the limit of detection. For the values see text.
© 2002 Taylor & Francis
with concentrations of 0.06, 0.06, 0.04, 0.24, and 0.02mg/kg, respectively.
Finally, nickel (Ni), mercury (Hg), cadmium (Cd), and lead (Pb), which
are particularly hazardous for biota and are indicators of industrial pollu-
tion, were not detected in the 150 honeys (Table 12.1). This is particularly
surprising because about 50 percent of the samples were collected in hives
located in polluted areas. Even if we can assume that some hives were mis-
classified by the beekeepers, the descriptions provided for most of them
clearly show that numerous hives were undoubtedly located near sources
of industrial pollution (e.g. highways, petroleum industries). In addition,
the detectable presence of some elements such as Ag or Cr clearly reveals
that some honey samples were collected in polluted areas. Information on
the level of contamination of French honeys by heavy metals and related
pollutants is scarce. Recently, Fléché and co-workers [7] revealed that,
between 1986 and 1996, among the routine analyses performed by the
CNEVA (Centre National d’Etudes Vétérinaires et Alimentaires –
National Center for Veterinary and Alimentary Studies) on honeys of
various origins, only 97 were focused on the detection of heavy metals,
while 615 analyses were carried out for detecting pesticides and 341 were
performed to find the level of contamination of honeys in antibiotics. In
addition, among these 97 analyses, while the presence of Pb was investi-
gated systematically (with 10.3 percent positive response (p.r.)) and that of
Cd was searched in 83 samples (1.2 percent p.r.), the contamination in Hg
was only investigated in four honey samples (0 percent p.r.). Fléché et al.
[7] also emphasized that in the framework of their annual control of the
quality of honeys, in 1994, the CNEVA analyzed 122 French honeys and
28 foreign honeys for their concentrations of Pb and Cd. While Pb was not
detected in the former group, 43 percent of the latter were contaminated
by detectable concentrations of this element with a mean concentration of
3.8ppm. Conversely, Cd was not detected in the foreign honeys while 3
percent of the French honeys were contaminated by detectable amounts of
Cd with a mean concentration of 0.07ppm [7]. However, in these analyti-
cal results, the type of honey was not given even though it is well known
that this parameter widely influences the levels of contamination found in
samples gathered in the same geographical area. Thus, for example, in a
recent study, Barisic and co-workers [24] showed that the concentrations
of Pb in meadow honey, mixed meadow and honeydew honey, and honey-
dew honey from Gorski Kotar (Croatia) were 0.80Ϯ 0.64, 1.08Ϯ 0.59, and
3.38Ϯ 1.55ppm, respectively.
In order to perform a rational analysis of Table 12.2 and provide a
typology of the acacia honeys based on their detectable concentrations in
metallic and nonmetallic elements, different linear multivariate analyses
were performed on this 13ϫ 150 data matrix.
256 J. Devillers et al.
© 2002 Taylor & Francis
Multivariate analysis of the honey samples
Correspondence factor analysis
Background
Among the different linear multivariate methods that can be used to
analyze Table 12.2, correspondence factor analysis (CFA) was selected
because its χ
2
metrics permits work on data profiles and the natural biplot
representation of the variables and objects which greatly facilitates the
interpretation of the graphical displays [26]. In addition, CFA has been
used successfully on similar data matrices for rationalizing (eco)toxicologi-
cal information [27–30].
Analysis of the factorial map F
1
F
2
CFA allows the dimensionality of the 13ϫ 150 data matrix (Table 12.2) to
be significantly reduced since the six first axes (i.e. F
1
to F
6
) account for
about 93 percent of the total inertia of the system.
The factorial map F
1
F
2
(Figure 12.2), which accounts for most of the
variance of the system (i.e. 62.23 percent), clearly reveals an opposition
between the presence or the absence of detectable concentrations of sulfur
(S) in the samples. Thus, broadly speaking, the honey samples belonging
to the compact cluster of points located on the right of Figure 12.2B do not
have sulfur. Conversely, points located in the top left of Figure 12.2B deal
with honey samples containing significant concentrations of sulfur. It is
clear that CFA can be used to perform a more precise analysis of the
points displayed on the factorial map. Thus, for example, sample number
41 does not contain a detectable concentration of sulfur but, in addition, it
presents the highest concentration in zinc (i.e. 5.96ppm). This explains its
location as an outlier in the lower part of Figure 12.2B. Conversely,
samples 85 and 86 contain fairly similar concentrations of sulfur but the
former is also contaminated by Cr, Cu, and Al while the latter does not
have detectable concentrations of these elements. In addition, sample 86
contains more Ca than sample number 85. These chemical differences
explain their different locations on Figure 12.2B.
The strong opposition between the honeys with or “without” sulfur
clearly reveals that this element has to be viewed as a contaminant. It is
difficult to explain the origin of this contamination. It is assumed that
environmental pollutions mainly explain the fairly high concentrations
found in the honeys but direct human contamination cannot be excluded
for some samples. Thus, for example, honey sample number 20 with
35.90mg/kg of sulfur was collected near a highway, as were samples
number 27 (Sϭ 60.11mg/kg), number 85 (Sϭ 18.66mg/kg), number 86
(Sϭ 26.05mg/kg), and others. In the same way, the honey sample number
Elemental analysis of French acacia honey 257
© 2002 Taylor & Francis
81 with 21.93mg/kg of sulfur was collected in a hive located near a textile
factory. Other honeys gathered near various industrial sites also contain
substantial amounts of sulfur [e.g. 73, 132]. However, surprisingly, the
highest concentration of sulfur was found in sample number 28 which was
collected in a mountainous area apparently exempt from industrial pollu-
tion. Because this sample was provided jointly with sample number 27,
collected in a polluted area, we cannot exclude human contamination
introduced by the beekeeper, especially if we consider the very high or
258 J. Devillers et al.
Figure 12.2 F
1
F
2
factorial maps for the 13 elements (A) and 150 honey samples
(B).
© 2002 Taylor & Francis
fairly high concentrations found for most of the other elements in these
two samples (Table 12.2).
Another trend which can be underlined in Figure 12.2B is the gradient
determined by Cr and Ag (Figure 12.2A). Note that on Figure 12.2A, the
true location of Ag was not indicated in order to have a scale yielding an
optimal graphical display of the variables and objects. The joint reading of
Figures 12.2A and 12.2B shows that sample number 123, which is located
at the top right of Figure 12.2B, is the most contaminated in silver with
2.16mg/kg and also contains a very high concentration of chromium (i.e.
0.50mg/kg). This is not surprising because this sample was collected in a
hive located within an urban area (more specifically in the center of a rural
city of about 6000 inhabitants). A high concentration of Ag (i.e.
1.03mg/kg) was also found in sample number 146 located in the upper
right of Figure 12.2B. This sample was collected near a highway. Sample
number 127 located in the vicinity of sample number 146 also presents a
high concentration of Ag (i.e. 0.57mg/kg) and is the most contaminated in
Cr (i.e. 0.52mg/kg). However, this sample was labeled by the beekeeper as
being collected in a nonpolluted area. It is surprising because it is also con-
taminated by Cu, Mo, Zn, Al, and so on (Table 12.2).
P, Ca, and Mg are elements found in all the 150 honey samples but with
various concentrations. Mn is also detected in most of the samples (Tables
12.1 and 12.2). Consequently, it is difficult to determine formal trends in
relation to environmental pollutions for these elements. However, it is
interesting to note that an inverse relationship can exist between the con-
centrations found for P and those recorded for Ca and Mn. Thus, because
sample number 126 shows the lowest concentration of Ca (i.e. 2.98mg/kg),
a very low concentration of Mn (i.e. 0.18mg/kg), and a fairly high concen-
tration of P (i.e. 100.4mg/kg), it is located in the upper right of Figure
12.2B. This is in accordance with the location of these three variables on
Figure 12.2A. This sample, which was collected at a distance of 10km from
a city, also contains 0.05mg/kg of Cu, 0.62mg/kg of Mo, 11.61mg/kg of S,
and only 0.58mg/kg of Zn. Undoubtedly, these concentrations also influ-
ence its location on Figure 12.2B.
Analysis of the factorial map F
1
F
3
The factorial map F
1
F
3
(Figure 12.3), which accounts for 56.86 percent of
the total inertia of the system, emphasizes the fact that the presence of
cobalt (Co) in the honey samples is correlated with that of molybdenum
(Mo). Of the 46 samples containing detectable concentrations of Co
(Table 12.1), only nine do not contain significant concentrations of Mo
(Table 12.2). Consequently, these two elements form a cluster in the
bottom right of Figure 12.3A. Note that the same situation occurs in
Figure 12.2A but Figure 12.2B is more difficult to read than Figure 12.3B
as regards honey samples containing Co and/or Mo. Conversely, it is easy
Elemental analysis of French acacia honey 259
© 2002 Taylor & Francis
to see, for example, that sample number 10 which is located in the bottom
right of Figure 12.3B presents a fairly high concentration of Co (i.e.
0.10mg/kg) and the highest concentration of Mo (i.e. 0.81mg/kg).
Undoubtedly, Co and Mo are found mainly in the acacia honeys collected
in polluted areas. However, exceptions can be found.
Figure 12.3B also highlights samples with specific contaminants. Thus,
for example, samples 27 and 28 contain the highest concentrations of Cu.
As indicated previously, sample number 123 is the most contaminated by
Ag. Sample number 80 contains the highest concentration of Al (i.e.
1.44mg/kg). Sample number 86 contains fairly high concentrations of Ca
260 J. Devillers et al.
Figure 12.3 F
1
F
3
factorial maps for the 13 elements (A) and 150 honey samples
(B).
© 2002 Taylor & Francis
and S while Ag, Cr, Co, Cu, Mo, and Al have not been detected and the
other elements are present in limited amounts. All these details can be
readily deduced from Figures 12.3A and 12.3B.
Analysis of the factorial map F
2
F
3
The factorial map F
2
F
3
(Figure 12.4), which only accounts for 32.69
percent of the total inertia of the system, confirms the general trends
stressed previously with the factorial maps F
1
F
2
and F
1
F
3
. In addition, it
Elemental analysis of French acacia honey 261
Figure 12.4 F
2
F
3
factorial maps for the 13 elements (A) and 150 honey samples
(B).
© 2002 Taylor & Francis
allows some chemical characteristics of the honey samples to be refined.
Thus, for example, sample number 41, which was collected in a hive
located near a paper pulp factory, presents the highest concentration of Zn
(i.e. 5.96mg/kg). This sample, located on the bottom left of Figure 12.4B,
also contains a fairly high concentration of Al (i.e. 0.98mg/kg). In the
same way, sample number 65, which was collected near a highway, is also
significantly contaminated by these two elements (Table 12.2). However,
in neither of these two samples sulfur has been detected (Figure 12.2B).
Sample number 19 contains substantial concentrations of Cr, Cu, and Co
and a very high concentration of Mo. Similarly, sample number 52 con-
tains measurable concentrations of Ag, Cr, Co, Mo, and Al. Sample
number 32 contains no detectable concentrations of Ag and Al (Table
12.2) but is contaminated by Cr, Co, Mo, and Zn. Conversely, honey
samples located in the upper left of Figure 12.4B generally do not contain
these elements or are only contaminated by some of them. Thus, for
example, sample number 57 only contains significant amounts of Ca and P,
all the other elements are present in small quantities. The particular loca-
tion of Al on Figure 12.4A, but also on Figures 12.2A and 12.3A, has to be
related to the ubiquity of this pollutant. In the same way, Fe also presents
a rather central location on Figures 12.2A, 12.3A, and 12.4A.
Principal component analysis and hierarchical cluster analysis
Because, as emphasized previously, Table 12.2 could be analyzed by other
multivariate techniques, principal component analysis (PCA) [31] was also
used to reduce the dimensionality of this data matrix. The PCA results
(not shown) are broadly in accordance with those obtained from CFA. A
hierarchical cluster analysis (HCA) was also carried out on Table 12.2. An
aggregative procedure using a χ
2
distance and an average linkage algo-
rithm were used [32, 33]. The results obtained with this type of multi-
variate method are difficult to compare directly with those produced by
CFA or PCA. With PCA or CFA, the different variables and objects are
explained on different factors, consequently, to draw conclusions, it is
always necessary to consider different factorial maps accounting for differ-
ent parts of the information. Conversely, with HCA, all the information of
the data matrix is displayed through two dendrograms: one for the vari-
ables and another for the objects. Therefore, the comparison of the results
obtained with a CFA and an HCA is not straightforward. Despite this
point, on the dendrogram of the variables obtained from the HCA of
Table 12.2, it has been possible to confirm the atypical position of Ag and
the relative independence of the other elements except for Ca, P, and Mg
and to a lesser extent S which form a cluster (figure not given). In the same
way, the dendrogram of the objects clearly shows the existence of some
important outliers [e.g. 41, 123] in contrast with samples organized in more
or less strong clusters (figure not given).
262 J. Devillers et al.
© 2002 Taylor & Francis
Discussion
It is difficult to compare our results with those published in the literature
because they generally deal with different types of honeys. In addition,
other analytical methods and protocols have generally been used to quan-
tify the concentrations of metallic and nonmetallic elements in the
samples. Kump and colleagues [21], comparing the performances of
radioisotope X-ray fluorescence spectrometry, total reflection X-ray fluo-
rescence spectrometry, atomic absorption spectrometry, and inductively
coupled plasma atomic emission spectrometry as methods for detecting
contamination in metallic and nonmetallic elements in different types of
honeys, have clearly addressed these problems. They have shown that in
the acacia honey, the concentrations of most of the trace elements were
lower than those generally found in the other honey varieties tested. Nev-
ertheless, our results clearly reveal an absence of significant contamination
of the French acacia honey by Ni, Cd, Hg, and Pb. In fact, because of the
large number of samples collected in various contaminated sites located in
different geographical regions (Figure 12.1), we can assume that the
French acacia honey is not significantly contaminated by these elements.
For comparison purposes, note that Rowarth [18] showed, by means of
atomic absorption spectrometry, that the concentrations of Pb in 59
samples of New Zealand honey taken from several enterprises in three
localities in the North Island, and from different stages, ranged from 0.009
to 1.131ppm. With the same analytical technique, Cesco et al. [22] meas-
ured 1.84Ϯ 0.48ppm of Pb in honeys collected in a polluted area located in
the city of Portogruaro (Venice, Italy). The highest concentrations of Pb
were found in propolis (13.7Ϯ 6.14ppm) and royal jelly (13.1Ϯ 0.43ppm).
Cesco et al. [22] also found concentrations of Cd ranging from about 1 to
3ppm, depending on the matrix analyzed. Barisic et al. [24] showed that
the concentrations of Pb in meadow honey, mixed meadow and honeydew
honey, and honeydew honey from Gorski Kotar (Croatia) ranged from
0.19 to 2.77, 0.22 to 2.62, and 0.84 to 6.78ppm, respectively. In addition to
their (eco)toxicological usefulness, these results are also very interesting
from a methodological point of view. They clearly illustrate the difficulty
in comparing honey samples due to intra (within) and inter (between)
variability. Ni was found in lower amounts, with the highest concentrations
measured for the meadow honey, mixed meadow and honeydew honey,
and honeydew honey being 0.188, 0.211, and 0.472ppm, respectively [24].
Conversely, some of the 150 acacia honeys analyzed are highly contami-
nated by Ag, Cr, Zn and/or other elements which are undoubtedly linked
to human pollutions. However, the true source of the contamination is
often difficult to determine. While samples collected in contaminated sites
generally present the highest concentrations in these elements, exceptions
can be found. Thus, honeys originating from apparently unpolluted
sites can present a fairly high level of contamination for one or more of
Elemental analysis of French acacia honey 263
© 2002 Taylor & Francis
these elements. It is obvious that the role of the wind in transportation
cannot be excluded for explaining the presence of contaminants far from
their emission source. However, direct contamination induced by bee-
keepers cannot be excluded. Thus, for example, as the pH of the acacia
honey is equal to 3.9 [34], the contact of a sample with a galvanized surface
will induce an elevated level of zinc in this sample. Even if the beekeepers
were asked to provide samples collected directly in the honeycomb cells of
the hives with the appropriate equipment to avoid contamination, we are
aware that our protocol has not always been followed. Thus, changes have
been already noted for three beekeepers (129/130/131, 134/135, 143/144).
Sample number 129 was collected in a hive located near a dump while
samples 130 and 131 originated from uncontaminated sites. While these
samples have not been extracted directly from the honeycomb cells but
after the honey harvesting, the different concentrations found in these
samples (Table 12.2) are logical. Thus, we can assume that no bias has
been introduced. This also seems to be the case for samples 134/135 and
143/144 which were apparently collected in nonpolluted areas. Because the
analytical results of these seven samples were logical, they were kept to
perform the multivariate analyses. However, we cannot certify that for all
the other honey samples, the sampling protocol has been scrupulously
respected by the beekeepers and hence, direct contamination during pro-
cessing and/or storage cannot be excluded.
More generally, Tables 12.1 and 12.2 reveal a high variability in the con-
centrations found for most of the elements. Consequently, it is not
surprising to see the scattering of the points (i.e. samples) on Figures 12.2
to 12.4. The variability in the concentrations of metallic and nonmetallic
elements in honeys has been reported in numerous articles. However,
generally these papers deal with honeys of different biological origins
and/or collected according to various methods and/or not related to pos-
sible environmental contaminations. Thus, Bengsch [35] generally
emphasized the large variations in the concentrations of K, P, Ca, S, Mg,
Mn, Si, B, Fe, Zn, Cu, and Ba measured in honey samples by ICP-AES.
However, while 14 different biological types of honeys were analyzed,
acacia honey was excluded from his study. In addition, no relationships
with direct or indirect human contaminations were considered. The same
criticism can be made of the work of Lasceve and Gonnet [36] dealing
with the comparison of light (Robinia pseudoacacia, Lavandula) and dark
(Abies pectinata, Calluna vulgaris) honeys for their mineral composition
measured by activation analysis with thermic neutrons. While the geo-
graphical origin of the samples was provided, it is obvious that on the basis
of only 14 French samples analyzed (i.e. 4 Rp, 3 L, 4 Ap, 3 Cv), and
without any indication of the levels of contamination found in the media in
which these honeys were collected, no formal conclusions can be made.
Tong et al. [14], from the analysis of 19 honey samples of various biological
origins and collected with different protocols near zinc mines, industrial
264 J. Devillers et al.
© 2002 Taylor & Francis
areas, or highways, also showed a high variability in the concentrations
found for most of the metallic and nonmetallic elements. Because the con-
centrations of the elements were related to the sources of sampling, it is
interesting to provide the ranges found by these authors for the 18 ele-
ments under study. These concentration ranges (ppm fresh weight) were
the following: Ag (0.002–0.094), Ca (3–540), Cr (0.003–2.1), Co
(0.002–0.50), Cu (0.13–3.3), Fe (0.41–40), Mg (2–370), Mn (0.18–12), Mo
(0.003–0.10), P (5–500), S (0.9–390), Zn (0.18–5.6), Al (0.09–18), Li (not
analyzed), Ni (0.011–0.83), Hg (Ͻ0.1 in all samples), Cd (Ͻ0.001–0.028),
and Pb (0.03–0.28). While some of their samples were collected in the
vicinity of highly polluted areas, it is surprising that the highest concentra-
tion of Ag was only 0.094ppm if we consider that the highest concentra-
tion found for Cr was 2.1ppm. Indeed, our study has clearly shown the
relationship between these two elements. Conversely, even if Al was
detected in about two-thirds of our samples, it is interesting to note that
the highest concentration (i.e. 1.44ppm, sample number 80 on Table 12.2)
is about 12 times lower than the highest concentration found for this
element by Tong et al. [14] (i.e. 18ppm, sample collected near the New
York State Thruway).
Concluding remarks
From 150 samples collected with comparable protocols, in various identified
polluted and nonpolluted environments, all being located in France, it has
been possible to show that acacia honey was not a good bioindicator of the
environmental pollution by heavy metals and related elements. Indeed, it is
true that generally the most contaminated honeys correspond to samples
collected in hives located within polluted areas. However, contaminations
can also be found in apparently uncontaminated areas. Even if some of
these contaminations may be explained by acidic reactions of the honey with
metallic surfaces during their processing, because some beekeepers were not
able to respect our sampling protocol, the true source of contamination of
the collected samples often remains difficult to determine.
More generally, our analytical results and multivariate analyses reveal
that acacia honeys present a very high variability in their concentrations in
metallic and nonmetallic elements. This makes it impossible to propose an
average profile for characterizing the French acacia honeys from their ele-
mental analysis. It would be worthwhile investigating whether similar con-
clusions can be drawn from the analysis of other types of French honeys.
Acknowledgment
This work has been funded partly by the EU Program supporting French
beekeeping (Règlement du Conseil no. 1221/97, portant règles d’applica-
tion pour des actions visant à l’amélioration de la production de miels).
Elemental analysis of French acacia honey 265
© 2002 Taylor & Francis
References
1 Schnoor, J.L. (1992). Fate of Pesticides and Chemicals in the Environment. John
Wiley, New York, p. 436.
2 Tardiff, R.G. and Goldstein, B.D. (1991). Methods for Assessing Exposure of
Human and Non-human Biota. John Wiley, New York, p. 417.
3 Newman, P.J. (1992). Surface water quality indicators. In: Environmental
Impact Assessment (Colombo, A.G., Ed.). Kluwer Academic Publishers, Dor-
drecht, The Netherlands, pp. 211–233.
4 Colombo, A.G. and Premazzi, G. (1990). Workshop on Indicators and Indices
for Environmental Impact Assessment and Risk Analysis. Luxembourg, Office
for Official Publications of the European Communities, EUR 13060 EN, p. 333.
5 Asta, J. (1995). Les lichens bioindicateurs de pollution atmosphérique: Exem-
ples de cas étudiés en milieux perturbés dans les Alpes. In: L’Ecotoxicologie du
Milieu Aérien. SEFA, pp. 191–196.
6 Pham-Delègue, M.H. (1998). Abeilles. La Martinière, Paris, p. 47.
7 Fléché, C., Clément, M.C., Zeggane, S. and Faucon, J.P. (1997). Contamination
des produits de la ruche et risques pour la santé humaine: Situation en France.
Rev. Sci. Tech. Off. Int. Epiz. 16, 609–619.
8 Voget, M. (1989). Bees and beeproducts as biological indicators of environ-
mental contamination: An economical alternative way of monitoring pollu-
tants. Toxicol. Environ. Chem. 20–21, 199–202.
9 Accorti, M., Guarcini, R. and Persano Oddo, L. (1991). L’ape: Indicatore bio-
logico e insetto test. Redia 74, 1–15.
10 Juberg, D.R., Kleiman, C.F. and Kwon, S.C. (1997). Position paper of the
American council on science and health: Lead and human health. Ecotoxicol.
Environ. Saf. 38, 162–180.
11 Frederick, P.C., Spalding, M.G., Sepulveda, M.S., Williams, G.E., Nico, L. and
Robins, R. (1999) Exposure of great egret (Ardea albus) nestlings to mercury
through diet in the everglades ecosystem. Environ. Toxicol. Chem. 18,
1940–1947.
12 Cobb, G.P., Sands, K., Waters, M., Wixson, B.G. and Dorward-King, E. (2000).
Accumulation of heavy metals by vegetables grown in mine wastes. Environ.
Toxicol. Chem. 19, 600–607.
13 Outridge, P.M., Wagemann, R. and McNeely, R. (2000). Teeth as biomonitors
of soft tissue mercury concentrations in beluga, Delphinapterus leucas. Environ.
Toxicol. Chem. 19, 1517–1522.
14 Tong, S.C.C., Morse, R.A., Bache, C.A. and Lisk, D.J. (1975). Elemental analy-
sis of honey as an indicator of pollution. Forty-seven elements in honeys pro-
duced near highway, industrial, and mining areas. Arch. Environ. Health 30,
329–332.
15 Bromenshenk, J.J., Carlson, S.R., Simpson, J.C. and Thomas, J.M. (1985). Pol-
lution monitoring of Puget Sound with honey bees. Science 227, 632–634.
16 Jones, K.C. (1987). Honey as an indicator of heavy metal contamination. Water
Air Soil Pollut. 33, 179–190.
17 Accorti, M., Guarcini, R., Modi, G. and Persano Oddo, L. (1990). Urban pollu-
tion and honey bees. Apicoltura 6, 43–55.
18 Rowarth, J.S. (1990). Lead concentration in some New Zealand honeys. J.
Apic. Res. 29, 177–180.
266 J. Devillers et al.
© 2002 Taylor & Francis
19 Bromenshenk, J.J., Gudatis, J.L., Carlson, S.R., Thomas, J.M. and Simmons,
M.A. (1991). Population dynamics of honey bee nucleus colonies exposed to
industrial pollutants. Apidologie 22, 359–369.
20 Raes, H., Cornelis, R. and Rzeznik, U. (1992). Distribution, accumulation and
depuration of administered lead in adult honeybees. Sci. Total Environ. 113,
269–279.
21 Kump, P., Necˇemer, M. and S
ˇ
najder, J. (1996). Determination of trace ele-
ments in bee honey, pollen and tissue by total reflection and radioisotope X-ray
fluorescence spectrometry. Spectrochim. Acta B 51, 499–507.
22 Cesco, S., Barbattini, R. and Agabiti, M.F. (1994). Honey bees and bee prod-
ucts as possible indicators of cadmium and lead environmental pollution: An
experience of biological monitoring in Portogruaro city (Venice, Italy). Api-
coltura 9, 103–118.
23 Leita, L., Muhlbachova, G., Cesco, S., Barbattini, R. and Mondini, C. (1996).
Investigation on the use of honey bees and honey bee products to assess heavy
metals contamination. Environ. Monit. Ass. 43, 1–9.
24 Barisˇic´, D., Vertacˇnik, A., Bromenshenk, J.J., Kezic´, N., Lulic´, S., Hus, M.,
Kraljevic´, P., Simpraga, M. and Seletkovic´, Z. (1999). Radionuclides and
selected elements in soil and honey from Gorski Kotar, Croatia. Apidologie 30,
277–287.
25 ADE-4: />26 Devillers, J. and Karcher, W. (1990). Correspondence factor analysis as a tool
in environmental SAR and QSAR studies. In: Practical Applications of Quanti-
tative Structure–Activity Relationships (QSAR) in Environmental Chemistry and
Toxicology (Karcher, W. and Devillers, J., Eds). Kluwer Academic Publishers,
Dordrecht, The Netherlands, pp. 181–195.
27 Devillers, J., Elmouaffek, A., Zakarya, D. and Chastrette, M. (1988). Compari-
son of ecotoxicological data by means of an approach combining cluster and
correspondence factor analyses. Chemosphere 17, 633–646.
28 Fortin, V., Doré, J.C., Poirier, F., Verhille, A.M., Carbonnier-Jarreau, M.C.,
Viel, C. and Cerceau-Larrival, M.T. (1995). Les profils de composition en
oligoéléments des pollens, marqueurs potentiels en cladistique végétale. Grana
34, 421–433.
29 Zakrgynska-Fontaine, V., Doré, J.C., Ojasoo, T., Poirier-Duchêne, F. and Viel,
C. (1998). Study of the age and sex dependence of trace elements in hair by
correspondence analysis. Biol. Trace Element Res. 61, 151–168.
30 Siobud-Dorocant, E., Doré, J.C., Michelot, D., Poirier, F. and Viel, C. (1999).
Multivariate analysis of metal concentration profiles in mushrooms. SAR
QSAR Environ. Res. 10, 315–370.
31 Thioulouse, J., Devillers, J., Chessel, D. and Auda, Y. (1991). Graphical tech-
niques for multidimensional data analysis. In: Applied Multivariate Analysis in
SAR and Environmental Studies (Devillers, J. and Karcher, W., Eds). Kluwer
Academic Publishers, Dordrecht, The Netherlands, pp. 153–205.
32 Roux, M. (1991). Basic procedures in hierarchical cluster analysis. In: Applied
Multivariate Analysis in SAR and Environmental Studies (Devillers, J. and
Karcher, W., Eds). Kluwer Academic Publishers, Dordrecht, The Netherlands,
pp. 115–135.
33 Roux, M. (1991). Interpretation of hierarchical clustering. In: Applied Multi-
variate Analysis in SAR and Environmental Studies (Devillers, J. and Karcher,
Elemental analysis of French acacia honey 267
© 2002 Taylor & Francis
W., Eds). Kluwer Academic Publishers, Dordrecht, The Netherlands, pp.
137–152.
34 Persano Oddo, L., Sabatini, A.G., Accorti, M., Colombo, R., Marcazzan, G.L.,
Piana, M.L., Piaza, M.G. and Pulcini, P. (2000). I Mieli Uniflorali Italiani Nuove
Schede di Caratterizzazione. Ministero Delle Politiche Agricole e Forestali,
p. 105.
35 Bengsch, E. (1992). Connaissance du miel. Des oligo-éléments pour la santé.
Rev. Fr. Apic. 521, 383–386.
36 Lasceve, G. and Gonnet, M. (1974). Analyse par radioactivation du contenu
minéral d’un miel. Possibilité de préciser son origine géographique. Apidologie
5, 201–223.
268 J. Devillers et al.
© 2002 Taylor & Francis