STREAM ECOLOGY & SELF PURIFICATION: An Introduction - Chapter 10 pptx
Bạn đang xem bản rút gọn của tài liệu. Xem và tải ngay bản đầy đủ của tài liệu tại đây (851.76 KB, 16 trang )
CHAPTER
10
Stream
Pollution
"Most Endangered1' U.S. Rivers158
American Rivers (Washington, D.C.) announced its
15th annual list of the
most endangered rivers in the United States in April, noting that dams, lev-
ees, and stabilized riverbanks are destroying habitat and contributing to the
extinction of native fish and wildlife across the nation.
'America's native fish are homeless in most parts of the country," says
Rebecca Wodder, president of American Rivers. "We have straightened the
curves, blocked the flows, and hardened the banks of thousands of miles of
waterways, wiping out habitats and making it difficult for our nation's rivers
to support native fish and wildlife," she says.
Scientists believe that habitat loss could contribute to the extinction of hun-
dreds of freshwater species in the United States by the end of the
21
st century.
Top
10
Most Endangered U.S. Rivers
1.
Lower Snake River (Wash.)
2.
Missouri River (Mont., N.D.,
S.D.,
Neb., lowa, Kan., MO.)
3.
Ventura (Calif.)
4. Copper River (Calif.)
5.
Tri-State River Basins (Ga., Ala., Fla.)
6.
Coal River (W. Va.)
7. Rio Grande (Colo., N.M., Texas)
8. Mississippi and White Rivers (Minn., Wis., Ill., lowa, MO., Ky., Tenn.,
Ark., Miss., La)
9.
North Fork Feather River (Calif.)
10. Clear Creek (Texas)
1
0.1
WHAT
IS STREAM POLLUTION?'59
P
EOPLE'S
opinions differ in what they consider to be a pollutant on the basis
of their assessment of benefits and risks to their health and economic
'58"~onservation Group Announces 'Most Endangered' US. Rivers."
In
Water Environment
&
Technology
(WE&n,
p.
13,
July
2000.
'59~rom Spellman,
F.
R.,
The Science
of
Environmental Pollution.
Lancaster,
PA:
Technomic Publishing Com-
pany, Inc., pp.
4-5,
1999.
Copyright © 2001 by Technomic Publishing Company, Inc.
134
STREAM
POLLUTION
well-being. For example, visible and invisible chemicals spewed into water by
an industrial facility might be harmful to people and other
forms of life living
nearby
and in the stream itself. However, if the facility is required to install ex-
pensive pollution controls, forcing the industrial facility to shut down or to move
away, workers who would lose their jobs and merchants who would lose their
livelihoods might feel that the risks from polluted air and water are minor
weighed against the benefits of profitable employment. The same level of pollu-
tion can also affect two people quite differently. Some forms of water pollution,
for example, might cause only a slight irritation to a healthy person but cause
life-threatening problems to someone with autoimmune deficiency problems.
Differing priorities lead to differing perceptions of pollution (concern about the
level of pesticides in foodstuffs prompting the need for wholesale banning of in-
secticides is unlikely to help the: starving). Public perception lags behind reality
because the reality is sometimes unbearable. Pollution is a judgement, and pol-
lution demands continuous judgement.
10.2
STREAM
POLLUTION
LAWSIGO
Existing laws and their implementing regulations treat water narrowly, as if
surface and groundwater were
not connected, as if point
and non-point sources
of pollution could be treated in isolation. They undervalue the immense diver-
sity of goods and services supplied by aquatic ecosystems.
The Clean Water Act (CWA) mandates, "to restore and maintain the physi-
cal, chemical, and biological integrity of the nation's
waters."161
For 25 years,
this mandate was largely ignored in water
p01icy.l~~ Three ap-
proaches
to the use and management of water resources kept the focus narrow,
incomplete, and inadequate:
(1)
Water was viewed as afZuid for humans to use.
Too many water resource
professionals saw "the forms of life in a [stream as] purely incidental, com-
pared with the task of a [stream], which is to conduct water runoff from an
area toward
ocean."163
(2)
Pollution was the only threat to water resources, and dilution was the solu-
tion.
People managed for "-water quality" (degrees of chemical contamina-
160~dapted
from
Km,
J.
R.,
Rivers as Sentinels: Using the Biology of Rivers to Guide Landscape Management.
pacnwfimmss,
pp.
34,
revised
August
1996.
161~~~~~.
Summary of State Biological Assessment Programs for Streamsand Rivers.
Washington,
DC:
Environ-
mental
Protection
Agency,
EPA
230-R-96-07, p.
3
1996;
USEPA,
Biological
Assessment
Methods, Biocriteria,
and Biological Indicators: Bibliography of Selected Technical,
Polic): and Regulatoy Literature.
Washington,
DC:
Enviromental
Protection
Agency,
EPA
230-B-96-001,
p.
33,
1996.
162~arr,
J.
R.
and
Dudley,
D.
R.,
"Ecological
perspective
on
water
quality
goals."
Environmental Management,
555-68,
1981;
USEPA,
Biological Criteria: National Program Guidances for Su@ace Waters.
Washington,
DC:
Environmental
Protection
Agency,
EPA
440-5-90-004,
1990;
Km,
C.,
"Biological
integrity
and
the
goal
of
envi-
ronmental
legislation:
lessons
for conservation
biology."
Conservation Biologj,
4:66-84,
1991.
163~instein,
H.
A.,
LLSedimentation
(suspended
solids)."
In
River Ecology and Man.
Oglesby,
C.,
Carlson,
A.,
and
McCann,
J.
(eds.).
New York:
Academic
Press,
pp.
309-318,
1972.
Copyright © 2001 by Technomic Publishing Company, Inc.
Stream
Pollution
Laws
135
tion). In 1965, an Illinois water official observed, "Regardless of how one
may feel about the discharge of waste products into surface waters, it is ac-
cepted as a universal practice and
.
.
.
a legitimate use of stream waters."164
Surface
waters existed to receive the discharge of human society.
(3)
Only a few aquatic species "counted" as being important to human society.
Society sought to maximize sport or commercial harvest of selected species.
Production-larger harvests of fish or shellfish-became the goal, and
technofixes like hatcheries became the means to supplement falling wild
populations.165 Fish
ladders helped migrating adults pass upstream over
dams, but no provisions were made for helping young fish go around the
dams as they migrated downstream toward the ocean. Many biologists re-
moved large woody debris from stream channels to make passage easier,
never mind that fish had been passing such barriers for centuries, or that the
wood actually created fish
habitat.166
The first
two attitudes did not give any value to the life-forms associated
with stream ecosystems. Although these three philosophies have not been
abandoned, a growing number of water resource professionals recognize their
inadequacies.
10.2.1
TMDL
RULE167
On July 11,2000, a U.S. Environmental Protection Agency (USEPA) ad-
ministrator signed a rule that revised the Total
Maximum Daily Load
(TMDL)
program and made related changes to the National Pollutant Discharge Elimi-
nation System (NPDES) and Water Quality Standards programs (65
FR
43585,
July 13). According to President
Clinton, EPA's move
was a "critical, com-
mon-sense step" to clean up the nation's waterways.
The USEPA points out that over 20,000 water bodies across America have
been identified as polluted by States, Territories, and authorized Tribes. These
waters include over 300,000
streardriver and shoreline miles
and 5 million
acres of lakes. The overwhelming majority of people in the United States live
within 10 miles of one of these polluted waters.
The Clean Water Act (CWA) provides special authority for restoring pol-
luted waters. The Act calls on states to work with interested parties to develop
164~vans,
R.,
"Industrial wastes and water supplies." Journal ofAmerican Water Works Association,
57:625-628,
1965.
165~effe,
G.
K.,
"Techno-arrogance and halfway technologies: salmon hatcheries on the Pacific Coast of North
America." Conservation Biology,
6:350-354,
1992.
'66~aser, C. and Sedell, J.
R.,
From the Forestto the Sea: The Ecology of WoodlandStreams, Rivers, Estuaries, and
Oceans.
Delray Beach,
FL:
St. Lucie Press,
p.
37,
1994.
'67"~.~.
EPA signs TMDL Rule despite congressional protests." Water Environment
&
Technology
(
WE&T),
p.
40,
August
2000;
USEPA, Total Muximum Daily Load (TMDL) Program. Washington, DC: U.S. Environmental
Protection Agency, EPA
841-F-00-008,
pp.
1-4, July
2000.
Copyright © 2001 by Technomic Publishing Company, Inc.
136
STREAM
POLLUTION
Total Maximum Daily Loads (TMDLs) for polluted waters.
A
TMDL is essen-
tially a "pollution budget" designed to restore the health of the polluted body of
water.
10.2.1
.l
Goals
of
TMDL
Rule
The TMDL rule will make thousands more streamslrivers, lakes, and coastal
waters safe for swimming, fishing, and healthy population of fish and shellfish.
Key provisions of the TMDL Rule include the following:
It requires states to develop more detailed listing methods and compre-
hensive lists of polluted water bodies, which must be submitted to the
USEPA every four years. The lists also may include threatened waters.
It requires states to
prioritize water
bodies and develop
TMDLs first for
those
that are drinking water sources or that support endangered spe-
cies. Once a TMDL is developed, the rule requires states to establish a
cleanup schedule that would enable polluted water bodies to achieve
water quality standards within
10
years (within
15
years if the state re-
quests and EPA grants an extension).
TMDL development must include an implementation plan that identifies
specific actions and schedlules for meeting water quality goals and ad-
dresses point and non-point pollution sources, according to the rule. The
rule also requires that runoff controls be installed five years after this
plan is developed, if practicable, and that TMDL allocations for
non-point sources be pollution specific, implemented expeditiously, met
through effective
programs, and
supported by adequate water quality
funding.
The rule does not require new permits for forestry, livestock, or
aquaculture operations. It also does not require "offsets" for new pollu-
tion discharges to impaired waters prior to TMDL development.
10.3
STREAM POLLUTANTS
With regard to stream pollution, no single public concern is greater than
when a highly visible massive
fishkill occurs in a local
stream. Moreover, when
local, state, and national media announce that thousands of fish have died in
some particular body of water, the public clamors for remedy. Surface waters
such as local streams can have a profound impact upon the public. For example,
when one recognizes that the public may drink the stream water, eat the fish
from the stream, and use the stream as a recreational resource, then it becomes
quite apparent that the public has a stake in the quality of its local stream water.
There is irony in all this, however, as apparent in the following discourse pre-
sented by Halsam:
Copyright © 2001 by Technomic Publishing Company, Inc.
Stream
Pollutants
137
Man's actions are determined by his expediency. If it makes man's life more con-
venient, less expensive or
pleasanter,
the
stream and its aquatic life will be sacri-
ficed. Actions to benefit the stream come only when its state displeases man:
when
it
carries cholera or cadmium, when its ugliness offends, or when species or
habitats he now thinks important are being
10st.l~~
J
Note: When registered voters were asked what is the most important envi-
ronmental problem facing the nation (U.S.), they
responded:169
Air pollution
26%
Unsafe drinlung water 11%
Water pollution 11%
Toxic/hazardous waste 10%
Dealing with
household
garbagelwaste 10%
Aquatic pollution
in local streams is composed of storm-water runoff,
wastes from industry, and wastes from homes and commercial enterprises.
Several types of aquatic pollutants have caused problems in natural bodies of
water. Some of the common pollutants and their effects will be discussed in this
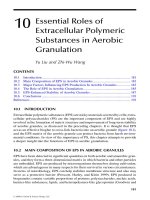
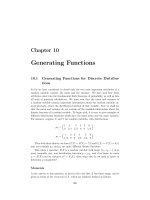
section. Miller, for convenience, breaks down biological, chemical, and physi-
cal forms of water pollution into the following eight major types (see Figure
1o.1):l7o
(1)
Bacteria, viruses, protozoa, and parasites-disease-causing agents
(2)
Domestic sewage, animal manure, and other biodegradable organic wastes
that deplete water of dissolved oxygen-oxygen-demanding wastes
(3)
Acids, salts, toxic metals, and their compounds-water-soluble inorganic
chemicals
(4) Water-soluble nitrate and phosphate salts-inorganic plant nutrients
(5)
Insoluble and water-soluble oil, gasoline, plastics, pesticides, cleaning sol-
vents, and many others-organic chemicals
(6)
Insoluble particles of soil, silt, and other inorganic and organic materials that
can remain suspended in water-sediment or suspended matter
(7)
Heat
(8)
Radioactive substances
Some of the common pollutants that have direct impact upon stream ecol-
ogy and that are pertinent to this discussion are discussed in the following sec-
tions.
'68~alsam,
S.
M.,
River Pollution: An Ecological Perspective.
New
York:
Belhaven
Press,
p.
6,
1990.
'69~~~
Today.
"Pollution
is
top
environment
concern,"
August
29,2000.
170h.liller,
G.
T.,
Environmental Science,
2nd
ed.
Belmont,
CA:
Wadsworth,
p.
347, 1988.
Copyright © 2001 by Technomic Publishing Company, Inc.
STREAM
POLLUTION
-(
Water
FOmsOf
Pollution
)-c->
Soluble Inorganic Materials
Organic
Chemicals
a
Figure
10.1
Biological, chemical,
and
physical forms
of
water
pollution.
Both acidic and alkaline wastes may be generated by mine drainage, various
industrial wastes, and by acid deposition (acid rain). Streams located in rural
settings are not exempt from acidification. Mason points out that several min-
ing operations are situated in rural settings and end up discharging waste prod-
uct into streams that would otherwise be normal and quite
clean.171
A sharp change in pH in
a natural stream may cause the death of most organ-
isms in the stream. To ensure the protection of aquatic organisms, discharged
wastes should not lower the pH below
6.5
or raise it above
8.5.
Recent studies
have shown that some organisms are capable of acclimating to alkaline waters.
However, to date, there has been no evidence that organisms can acclimate to
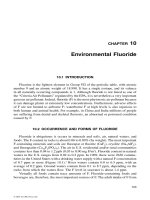
more acidic water conditions. The sensitivities of various aquatic organisms to
lowered pH, based on studies conducted in Scandinavian lakes, are provided in
Table
10.1.
10.3.1
.l
Effects of Mine Drainage on Aquatic ~acroinvertebrates~~~
According to Kimmel
"
. .
,
The influx of untreated acid mine drainage into
streams can severely degrade both habitat and water quality often producing an
l7l~ason, C.
F.,
"Biological aspects of freshwater pollution." In
Pollution: Causes, Effects, and Control.
Harrison,
R.
M. (ed.). Cambridge, Great Britain: The Royal Society of Chemistry, p.
133,
1990.
172~arle,
J.
and Callaghan,
J.,
Impact of Mine Drainage on Aquatic
Life,
Water Uses, and Man-made Structures.
Pennsylvania Dept. of Environmental Protection
(PA
DEP), pp.
1-13,
1998.
Copyright © 2001 by Technomic Publishing Company, Inc.
Stream Pollutants
139
TABLE
10.1.
Sensitivities of Aquatic Organisms to Lowered
pH.
pH
6.0 Crustaceans, mollusks, etc., disappear.
White moss increases.
5.8
Salmon, char, trout, and roach die.
Sensitive insects, phytoplankton, and zooplankton die.
5.5 Whitefish, grayling die.
5.0
Perch, pike die.
4.5
Eels, brook trout die.
Source: Reproduced by permission from Pollution by
J.
N. Lester, Royal Society of Chem~stry,
Cambridge,
p. 109,1990.
environment devoid of most aquatic life and unfit for desired uses. The severity
and extent of damage depends upon a variety of factors including the fre-
quency, volume, and chemistry of the drainage, and the size and buffering ca-
pacity of the receiving
stream."173
Mine drainage
is a toxic cocktail of intricately mixed elements that interact
to cause a variety of effects on stream life that are difficult to separate into indi-
vidual components. Toxicity is dependent on discharge volume, pH, total acid-
ity, and concentration of dissolved metals. pH is the most critical component,
because the lower the pH, the more severe the potential effects of mine drainage
on aquatic life. The overall effect of mine drainage is also dependent on the di-
lution rate of flow, pH, and alkalinity or buffering capacity of the receiving
stream. The higher the concentration of bicarbonate and carbonate ions in the
receiving stream, the higher the buffering capacity and the greater the protec-
tion of aquatic life from adverse effects of acid mine
drainage.174 Alkaline mine
drainage
with low concentrations of metals may have little discernible effect on
receiving streams. Acid mine drainage with elevated metals concentrations dis-
charging into headwater streams or lightly buffered streams can have a devas-
tating effect on aquatic life. Secondary effects such as increased carbon dioxide
tensions, oxygen reduction by the oxidation of metals, increased osmotic pres-
sure from high concentrations of mineral salts, and synergistic effects of metal
ions also contribute to
t0xi~ity.l~~ According
to Parsons and Warner, in addi-
tion to the chemical effects of mine drainage, physical effects such as increased
turbidity from soil erosion, accumulation of coal fines, and smothering of the
stream substrate from precipitated metal compounds may also
occur.176
'73~irnmel, W.
G.,
"The impact of acid mine drainage on the stream ecosystem."
In
Pennsylvania Coal: Resources,
Technology and Utilization,
Majumdar,
S.
K.
andMiller,
W.
W. (eds.),
The Pa. Acad. Sci. Publ.,
pp.
424-437,1983.
'74~irnrnel, W.
G.,
"The impact of acid mine drainage on the streamecosystem." In
Pennsylvania Coal: Resources,
Technology and Utilization,
Majumdar,
S.
K.
andMiller,
W.
W. (eds.),
The Pa. Acad. Sci. Publ.,
pp.
424-437,1983.
175~arsons,
J.
D., "Literature pertaining to formation of acid mine waters and their effects on the chemistry and
fauna of streams."
Trans. Ill. State Acad. Sci.,
v.
50,
pp.
49-52,
1957.
'76~arsons,
J.
D.,
"Theeffects of acid strip-mineeffluents on theecology of a stream."Arch.
Hydrobiol.,
65:25-50,
1968;
Warner,
R.W.,
"Distribution of biota in a stream polluted by acid mine-drainage."
Ohio
J.
Sci.,
v.
71,
pp.
202-215,1971.
Copyright © 2001 by Technomic Publishing Company, Inc.
140
STREAM
POLLUTION
As mentioned, benthic macroinvertebrates are often used as indicators of
water quality because of their varying degrees of sensitivity to pollutants. Unaf-
fected streams generally have a variety of species with representatives of all in-
sect orders, including a high diversity of insects such as mayflies, stoneflies,
and caddisflies. Like many other potential pollutants, mine drainage can cause
a reduction in the diversity and total numbers, or abundance, of
macroinvertebrates and changes in community structure, such as a lower per-
centage of various macroinvertebrate
taxa. Moderate pollution eliminates
the
more sensitive
species.177 Severely
degraded conditions are characterized by
dominance of certain taxonomic representatives of pollution-tolerant organ-
isms, such as
tubifex worms,
midge larvae,
alderfly larvae, fishfly larvae,
cranefly larvae, caddisfly larvae, and
non-benthic insects like predaceous div-
ing beetles and water
boatmen.178 While
these tolerant organisms may also be
present in unpolluted streams, they dominate in impacted stream sections.
Mayflies are generally sensitive to acid mine drainage; however, some
stoneflies and caddisflies are tolerant of dilute acid mine drainage.
J
Note:
Most organisms have a well-defined range of pH tolerance. If the pH
falls below the tolerance range, death will occur due to respiratory or
osmoregulatory failure.
1
0.3.2
THERMAL
POLLUTION
Oxygen is more soluble in cold water than in warm water; thus, oxygen lev-
els are higher in
colder waters.
When a natural stream is heated by thermal pol-
lution to a point above its
normal water
temperature, the stream's health is af-
fected. The common source of thermal pollution is from cooling water of
industrial power plants, which is discharged clean but quite warm into aquatic
systems. Such thermal pollution has caused many complex aquatic problems.
Mason reports that an "increase in temperature alters the physical environment,
in terms of both areduction in the density of the water and its oxygen
concentra-
ti~n."'~~
Moreover, Jeffries and
Mills note that because all aquatic organisms
have "thermal tolerance limits, a discharge may be lethal if beyond the thresh-
old for a
species."180
177~eed, C.
E.
and Rutschky,
C.
W.,
"Benthic macroinvertebrate community structure in a stream receiving acid
mine drainage."
Proc. Pa. Acad. Sci.
v.
50,
pp.
41-46,
1971.
'78~ichols,
L.
E. and Bulow,
F.
J.,
"Effects of acid mine drainage on the stream ecosystem of the East Fork of the
Obey River, Tennessee."
J.
Tenn. Acad. Sci.,
v.
48,
pp.
30-39,
1973;
Roback,
S.S.
and Richardson, J. W., "The ef-
fects of acid mine drainage on aquatic insects."
Proc. Acad. Nut. Sci. Phil.,
v.
121,
pp.
81-107,1969;
Parsons, J.
D.,
"The effects of strip-mine effluents on the ecology of a stream."
Arch. Hydrobiol.,
v.
65,
pp.
25-50,
1968.
'79~ason, C.
F.,
"Biological aspects of freshwater pollution."
Pollution: Causes, Effects, and Control,
Harrison,
R.M.
(ed.). Cambridge, Great Britain: The Royal Society of Chemistry,
p.
11
8,
1990.
la0~effries,
M.
and
Mills,
D.,
Freshwater Ecology: Principles andApplications.
London: Belhaven Press, p.
178,
1
990.
Copyright © 2001 by Technomic Publishing Company, Inc.
Stream Pollutants
141
Thus, direct heat may cause the death of aquatic animals. Another effect is
the increased susceptibility to toxins at higher solubility at higher temperatures.
With the reduced solubility of oxygen in the water there is, in addition, an in-
crease in the metabolism and respiratory demands of most animals because of
higher temperatures, so that each animal actually requires more oxygen at
75OF
than at
55°F.
Water temperature can be a principal ecological factor governing the pres-
ence, or absence, distribution, and abundance of aquatic life. A major increase
in water temperature magnifies the effects of toxic and organic pollution, low-
ers the oxygen-holding capacity of water, and causes the death of many aquatic
organisms.
J
Note:
The industrial use of large amounts of stream water for cooling is the
primary cause of thermal pollution in streams. Thermal pollution is also
caused by the removal of
riparian vegetation.
In fact, the most important fac-
tor influencing changes in stream water temperature is shade. In addition to
shade provided by vegetation, water temperatures are also influenced by to-
pography, surface area and volume of the stream, altitude, stream gradient,
underground water inflow, and type of stream or channel. However, by
maintaining adequate vegetation cover of such height and density as to ade-
quately shade the stream during periods of maximum solar radiation, abnor-
mal water temperature increases can often be prevented or
minimized.181
10.3.3
CHEMICAL TOXINS
Several types of chemical toxins disrupt aquatic communities. The list in-
cludes phenol (toxic at
1.0
mg/L), arsenic (recommended limit of
0.01
mg/L),
fluorides (recommended limit
0.9
mg/L), and cyanide (may be fatal to fish at
0.1
mg/L). Of particular concern to stream ecologists are those toxic com-
pounds that accumulate in tissues, especially pesticides and
PCBs. The prob-
lem these toxins
pose to higher life forms, including humans, is that the toxins
accumulate in tissues and are passed along the food chain.
10.3.4
HEAVY METALS
Heavy metals (metals generally in the first two columns of the periodic
chart) are introduced into aquatic ecosystems as a result of the weathering of
rocks and soils, volcanic activity, and a variety of anthropogenic (man-made)
activities. Various heavy metals such as cadmium, copper, mercury, lead, sil-
ver, and chromium have also been found to be too toxic to aquatic life as well as
181~ope,
P.
E.,
Forest? and Water Quality: Pollution Control Practices.
West Lafayette,
IN:
Purdue University, pp.
1-8,2000.
Copyright © 2001 by Technomic Publishing Company, Inc.
142
STREAM
POLLUTION
human beings. Laws points out that "virtually all metals, including the essential
metal micronutrients, are toxic to aquatic organisms as well as
humans."182
It is interesting to
note the findings of aquatic research relating to the impact
on aquatic life of combining different metals in the same discharge. As a case in
point, Smith points out that "many chemical wastes, harmless alone, react with
other chemicals to produce highly toxic
conditions.'y183 Smith's point
can be
seen when small, harmless amounts of copper or zinc alone will not harm most
aquatic organisms. However, when these two metals are combined
(synergized), in even extremely small concentrations, they will destroy all the
fish in a stream.
10.4
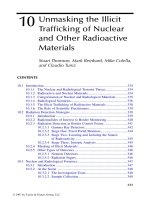
SELECTED INDICATORS OF STREAM WATER QUALITY'84
Generally (from water year to water year), the most abundant data for de-
scribing U.S. stream water-quality conditions are traditional sanitary and
chemical water-quality parameters (indicators) such as dissolved oxygen,
fecal
coliform bacteria, nutrients
(nitrate and total phosphorus), dissolved solids, and
suspended sediment (see Figure 10.2).
[Note:
A water year is the 12-month pe-
riod from October
1
through September 30 and is identified by the calendar
year in which it ends.]
10.4.1
DISSOLVED OXYGEN (DO)
Dissolved oxygen in streams is as critical to the good health of stream organ-
isms as is gaseous oxygen to humans.
DO
is essential to the respiration of
aquatic organisms, and its concentration in streams is a major determinant of
the species composition of biota in the water and underlying sediments. More-
over, the
DO
in streams has a profound effect on the biochemical reactions that
occur in water and sediments, which in turn affect numerous aspects of water
quality, including the solubility of many lotic elements and aesthetic qualities
of odor and taste. For these reasons, DO historically has been one of the most
frequently measured indicators of water
quality.lg5
In the
absence of substances that cause its depletion, the DO concentration in
stream water approximates the saturation level for oxygen in water in contact
with the atmosphere and decreases with increasing water temperature from
about
14
mg/L (milligrams per liter) at freezing to about
7
mg/L at 86OF (30°C).
lg2~aws, E.
A.,
Aquatic Pollution: An Introductor). Text.
New
York:
John
Wiley
&
Sons,
Inc.,
p.
352,
1993.
lg3Smith,
R.
L.,
Ecology and Field Biology
New York:
Harper
&
Row,
p.
624,
1974.
lg4~rorn
USGS:
Smith,
R.
A.,
Alexander,
R. B.,
and Lanfear,
K.
J.,
Stream Water Qualit). in the Conterminous
United States-Status and Trends of Selected Indicators during the 1980's.
Washington,
DC:
U.S.
Geological
Sur-
vey
(USGS)
Water-Supply
Paper
2400,
pp.
1-12,
February
1997.
la5~ern,
J.
D.,
Study andlnterpretation of the Chemical Characteristics ofNatural Water,
3rd
ed.
Washington,
DC:
US.
Geological
Survey
Water-Supply
Paper
2254,
p.
263,
1985.
Copyright © 2001 by Technomic Publishing Company, Inc.
Selected Indicators of Stream Water Quality
Dissolved Oxygen
a
Total
Phosphates
Figure
10.2
Water quality parameters.
For this reason, in ecologically healthy streams, the DO concentration depends
primarily on temperature, which varies with season and climate.
Criteria for defining desirable DO concentration are often differentiated as
applicable to cold-water biota, such as trout and their insect prey, and the more
low-oxygen-tolerant species of warm-water ecosystems. Moreover, because of
the critical respiratory function of DO in aquatic animals, criteria are often
ex-
pressed in terms of the short-term duration and frequency of occurrence of min-
imum concentration rather than long-term average concentrations. Studies
cited by the USEPA on the dependence of freshwater biota on DO suggest that
streams in which the concentration is less than
6.5
mg/L for more than about
20% of the time generally are not capable of supporting trout or other
cold-wa-
ter fish, and
such concentrations could impair population growth among some
warm-water game fish, such as largemouth
bass.186
Furthermore, streams
in which the DO-deficit concentration is greater than
4
mg/L for more
than 20% of the time generally cannot support either cold- or
warm-water game fish. DO deficit refers to the difference between the satura-
tion and measured concentrations of
DO
in a water sample and is a direct mea-
sure of the effects of oxygen-demanding substances on DO in streams.
Major sources of substances that cause depletion of DO in streams are
dis-
'86~~~~~.
Qualizy Criteria for Water
1986.
Washington,
DC:
U.S.
Environmental Protection Agency, Oftice of
Water, EPA
44015-86-00
[variously paginated],
1986.
Copyright © 2001 by Technomic Publishing Company, Inc.
144
STREAM
POLLUTION
charges from municipal and industrial wastewater treatment plants; leaks and
overflows from sewage lines and septic tanks; stormwater runoff from agricul-
tural and urban lands; and decaying vegetation, including aquatic plants from
the stream itself and detrital terrestrial vegetation.
DO
is added to stream water
by the process of aeration (waterfalls, riffles) and the photosynthesis of plants.
10.4.2
FECAL COLIFORM BACTERIA
Historically, the concentration of fecal coliform bacteria has been consid-
ered an important indicator of water quality because the presence of these or-
ganisms in streams is a reliable indicator of fecal contamination from
warm-blooded
animals.lg7 The presence of fecal material
in water where hu-
mans swim or where shellfish are harvested presents a significant risk of infec-
tion from pathogenic organisms associated with fecal coliform
bacteria.188 The
correlation
between documented cases of infectious disease and selected spe-
cies of fecal coliform bacteria such as
Escherichia coli
(E.
coli)
is well estab-
lished, but total concentrations of the fecal coliform group are easier to measure
than selected species and, thus, have been widely used as indicators for many
years.
A
concentration of 200 bacterial colonies/100 mL (colonies per l00 mil-
liliters) of water has long
been considered the acceptable limit for
fe-
cal-coliform
density in waters where human contact
occurs.18g In
addition to
this limit, an arbitrary threshold of 1,000 bacterial
colonies/100
mL
was se-
lected for this discussion to categorize high
fecal-coliform concentrations. The
major sources of fecal
coliform bacteria are untreated sewage, effluent from
sewage-treatment plants (point-source pollution), and runoff from pastures,
feedlots, and urban areas (non-point-source pollution).
10.4.3
DISSOLVED SOLIDS
Dissolved solids refers to the sum of all dissolved constituents in a water
sample. In most streams, the major components of dissolved solids are the ions
of calcium, magnesium, sodium, potassium, sulfate, and chloride. The signifi-
cance of these constituents in streams is related mostly to the potential limita-
tions that large dissolved-solids concentrations impose on certain domestic, in-
dustrial, and irrigation water uses rather than to their ecological significance. In
this discussion, dissolved-solids concentrations are classified arbitrarily as low
(less than 100
mg/L), medium (1 00 to
500
mg/L), high (500 to 1000 mgL), and
very high
(greater than
1000 mgL).
'87~~~~~.
Qualiq Criteria for Water:
Washington,
DC:
US. Environmental Protection Agency, p.
256,
1976.
'88~~~~~.
Qualir). Criteria for Water
Washington,
DC:
US. Environmental Protection Agency,
EPA
44015-86-00
[variously paginated],
1986.
'89~~~~~.
Qualiry Criteria for Water.
Washington,
DC:
U.S. Environmental Protection Agency,
p.
256,
1976.
Copyright © 2001 by Technomic Publishing Company, Inc.
Selected Indicators of Stream Water Quality
145
In most streams, the major source of dissolved solids is the dissolution of
minerals naturally found in soil and rock. Because of the wide variation in the
solubility of different minerals, and in the amount of precipitation available to
dissolve them, the concentration of dissolved solids in streams nationwide
ranges from only a few milligrams per
liter to several
thousand milligrams per
liter. Within ths broad
range, the highest dissolved-solids concentrations
(greater than
500
mg/L) are found in the arid Southwest, where high rates of
evaporation and transpiration tend to concentrate dissolved solids. Concentra-
tions are medium to high (greater than
100
mg/L) in parts of the midwestern
United States, where soluble carbonates are abundant, and they are lowest (less
than
100
mgL) in the eastern and northwestern parts of the United States,
where high precipitation rates dilute dissolved constituents. Average concen-
trations were lowest in forested areas and highest in range areas, which reflect
the more arid areas of the country.
Human activities contribute significantly to dissolved-solids concentrations
in most streams. For example, a moderate correlation between population and
dissolved-solids concentration in streams has long been noted for much of the
eastern and northwestern United States, where point-source municipal and in-
dustrial effluents typically have higher dissolved-solids concentrations than
their receiving
streams.lgO Also, land
disturbance associated with mining and
agriculture increases the exposure of mineral deposits to precipitation and in-
creases the non-point-source load of dissolved solids. In recent years, the corre-
lation between population and dissolved-solids concentrations has been
strengthened by the increased dissolved salts in streams as a result of the in-
creased use
of
highway deicing salt.lgl
10.4.4
NITRATE
Ecological concern about high concentrations of nitrate in streams stems
from its potential for contributing to eutrophication, which is the excessive
growth of aquatic plants that can impart unpleasant odors and tastes to water
and reduce its clarity, and, upon dying, can lower the
DO
concentration^.^^^
It
has not been possible, however, to establish a nationally applicable threshold
concentration for nitrate to protect against eutrophication because effects of ni-
trate concentrations are highly variable in different locations and are greatest in
coastal waters that are far removed from inland nitrate sources. Historically,
lgopeters,
N.
E.,
Evaluation of Environmental Factors Affecting Yields of Major Dissolved Ions of Streams in the
United States.
Washington,
DC:
U.S. Geological Survey Water-Supply Paper 2228, p. 39, 1984.
lgl~rnith,
R.
A., Alexander,
R.
B.,
and Wolrnan, M.
G.,
"Water-quality trends in the nation's rivers."
Science,
v.
235, no. 4796, pp. 1607-1615,1987.
lg2~ational Academy
of Sciences,
Eutrophication-Causes, Consequences, Correctives-Proceedings of Inter-
national Symposium
on Eutrophication,
Madison, Wisconsin, June 11-1 5,1967. Washington,
DC:
National Acad-
emy of Sciences,
p.
661,1969.
Copyright © 2001 by Technomic Publishing Company, Inc.
146
STREAM POLLUTION
government standards and eutrophication-control strategies for inland waters
have focused on phosphorus concentration rather than on nitrate concentration
because phosphorus is usually depleted more rapidly by the growth of aquatic
plants than is nitrate, and, therefore, is frequently the limiting factor in
eutrophication. Increasingly, however, it is recognized that control of estuarine
and coastal eutrophication will require control of nitrate from inland sources.
Major sources of nitrate in streams are municipal and industrial wastewater
discharge and agricultural and urban runoff. Deposition from the atmosphere of
the nitrogenous material in automobile exhaust and industrial emissions is also
a source.
10.4.5
TOTAL PHOSPHATE
In streams, phosphorus occurs primarily as phosphates and can be either dis-
solved, incorporated in organisms, or attached to particles in the water or in bot-
tom sediments. Total phosphorus refers to the sum of all forms of phosphorus in
a water sample and is reported in terms of elemental phosphorus.
Phosphorus is a particularly important nutrient in freshwater ecosystems be-
cause, as mentioned, it is usually the nutrient in shortest supply, and its avail-
ability often controls the rate of eutrophication. When human activities make
phosphorus available in larger quantities, the accelerated growth of algae and
other aquatic plants in streams can cause eutrophication, which depletes DO,
imparts undesirable tastes and odors in water, and clogs water-supply intakes.
To protect against eutrophication, the USEPA recommends an upper limit of
0.1
mg/L as the standard for total phosphorus in streams.lg3 For this discussion,
a threshold of
0.1
mg/L and an arbitrary threshold of
0.5
mg/L were selected for
analysis of total phosphorus concentrations in streams.
Sources of phosphorus are the decomposition of organic matter and inor-
ganic phosphate minerals that are mined and incorporated in fertilizers, deter-
gents, and other commodities. Thus, major point sources of phosphorus to
streams are waste discharges from wastewater treatment and food-processing
plants and other industrial facilities. Non-point sources of phosphorus include
agricultural and urban runoff and, in certain regions, the runoff and groundwa-
ter flow from areas that contain natural deposits of phosphate
minerals.lg4
10.4.6
SUSPENDED SEDIMENT
The suspended-sediment concentration of streams consists of the total quan-
tity of suspended organic and inorganic particulate matter in water and has an
Quali~ Criteria for Water.
Washington,
DC:
U.S. Environmental Protection Agency, Office of Water,
EPA
44015-86-00
[variously paginated],
1986.
lg4~em,
J.
D.,
Study and Interpretation of the Chemical Characteristics of Natural Watel;
3rd ed. Washington,
DC:
U.S. Geological Survey Water-Supply Paper 2254, p. 263,
1985.
Copyright © 2001 by Technomic Publishing Company, Inc.
Summary
of
Key
Terms
147
important influence on aspects of water use and ecosystem health. High con-
centrations of suspended sediment in streams diminish the recreational use of
streams because pathogens and toxic substances commonly associated with
suspended sediments are threats to public health. High concentrations also re-
duce water clarity, thereby affecting the aesthetic appeal of streams. They are
detrimental to stream biota because they inhibit respiration and feeding, dimin-
ish the transmission of light needed for plant photosynthesis, promote infec-
tions, and, when the sediment is deposited, can suffocate benthic organisms, es-
pecially in the embryonic and larval
stages.lg5 Most
sediment must be removed
from water that is withdrawn for human use, and high sediment concentrations
add significantly to the cost of treatment. Additionally, suspended sediment
can cause significant wear to bridge footings and other stream structures, and,
as it accumulates in a reservoir, it decreases its storage capacity.
The source of most suspended sediment is soil erosion. Although organic
particles frequently form an important component of suspended sediment,
most is inorganic by weight. Rates of soil erosion vary widely and depend on
such factors as soil characteristics, precipitation frequency and intensity, slope
of the land surface, and the nature and extent of land disturbance from agricul-
ture, mining, and construction. Because the quantities of sediment entering
streams depend greatly on natural factors, it is difficult to establish national cri-
teria for suspended-sediment concentration. In many western areas, for exam-
ple, stream ecosystems are naturally adapted to suspended-sediment concen-
trations that periodically are many times greater than those that are detrimental
in other areas. Rather than establish national criteria for suspended-sediment
concentration, the
USEPA
has recommended that light penetration in water not
be reduced by suspended material by more than 10% from its natural
leve1.1g6 In
this discussion,
average suspended-sediment concentrations for this study pe-
riod are arbitrarily grouped into three concentration classes-less than 100
mg/L, 100
to 500
mg/L, and
greater than 500
mg/L.
10.5
SUMMARY
OF
KEY
TERMS
Dissolved oxygen (DO)-is found in amounts of
9
to 10 parts per mil-
lion in streams and lakes.
Solubility of gaseous oxygen-in water, controls the amount of
DO
in
an aquatic system.
Oxygen-is more soluble in cold water than in warm water (oxygen lev-
els are higher in
colder waters).
Oxygen
demand-from organisms and decaying organic matter in-
creases as the temperature of the water increases.
195~~~~~.
Qualiq Criteria for Water
Washington,
DC:
U.S. Environmental Protection Agency, Office
of
Water,
EPA
44015-86-00
[variously
paginated],
1986.
lg61bid,
[variously
paginated].
Copyright © 2001 by Technomic Publishing Company, Inc.
148
STREAM POLLUTION
TMDL-is essentially a "pollution budget" designed to restore the
health of the polluted body of water.
pH-refers to the concentration of hydrogen ions in water. The allow-
able pH range is 6.5 to 8.5 for protection of aquatic organisms and for
controlling undesirable chemical reactions.
Thermal pollution-refers to
rising temperatures in streams that de-
crease
DO
content and increase the toxicity of substances by increasing
their solubility or changing their ionic character.
Fecal colifomz bacteria-is commonly used as an indicator organism.
That is, the presence of coliforms is taken as an indication that patho-
genic organisms may be present, and the absence of coliforms is taken
as an indication that the water is free from disease-producing organisms.
Dissolved solids-consist
of organic and inorganic molecules and ions
that are present in true solution in water.
10.6
CHAPTER REVIEW QUESTIONS
10.1 The Clean Water Act mandates:
10.2 A
TMDL
is essentially a
10.3 Examples of disease-causing agents include:
10.4
are often used as indicators of water quality.
10.5 Oxygen is more soluble in
than in
10.6
A
major increase in water temperature magnifies the effect of
and pollution.
10.7 The main problem
pose to human life forms is that the
accumulate in
and are passed along the
10.8 List six indicators of water quality.
10.9
historically has been one of the most frequently measured
indicators of water quality.
10.10
refers to the sum of all dissolved constituents in a water
sample.
Copyright © 2001 by Technomic Publishing Company, Inc.